. 2021 Jul 14;7(29):eabf9635.
doi: 10.1126/sciadv.abf9635. Print 2021 Jul.

Snake extract-laden hemostatic bioadhesive gel cross-linked by visible light

Affiliations

Snake extract-laden hemostatic bioadhesive gel cross-linked by visible light

Yicheng Guo et al. Sci Adv. .

Abstract

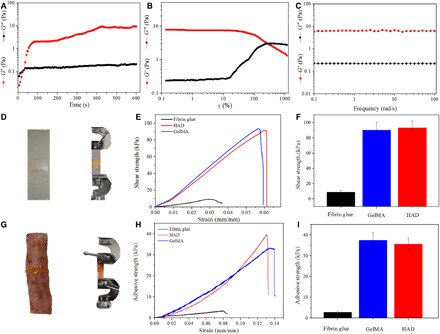
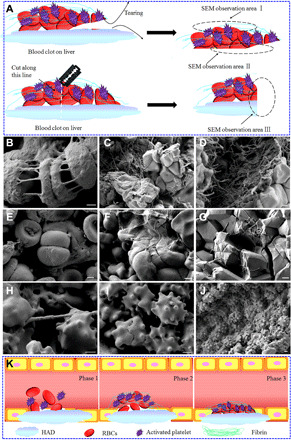
Bioadhesives reduce operation time and surgical complications. However, in the presence of blood, adhesion strength is often compromised. Inspired by the blood clotting activity of snake venom, we report a visible light-induced blood-resistant hemostatic adhesive (HAD) containing gelatin methacryloyl and reptilase, which is a hemocoagulase (HC) extracted from Bothrops atrox HAD leads to the activation and aggregation of platelets and efficiently transforms fibrinogen into fibrin to achieve rapid hemostasis and seal the tissue. Blood clotting time with HAD was about 45 s compared with 5 to 6 min without HAD. HAD instantaneously achieved hemostasis on liver incision (~45 s) and cut rat tail (~34 s) and reduced blood loss by 79 and 78%, respectively. HAD is also efficient in sealing severely injured liver and abdominal aorta. HAD has great potential to bridge injured tissues by combing hemostasis with adhesives.


Figures

Fig. 1
Fig. 1. Preparation and characterizations of HAD.
(A) Schematic representation of a visible light–induced photopolymerization system. (B) Digital photograph of the HAD gelling transition before (top), during (middle), and after visible light illumination (bottom). (C) UV-vis absorption spectra of TEA, VC, HC, GelMA, Eosin Y, GelMA prepolymer, and HAD prepolymer. Concentration of TEA, VC, Eosin Y, HC, and GelMA was 1.88, 1.25% (w/v), 0.5 mM, and 1 and 20% (w/v), respectively. (D) UV-vis absorption spectra of HAD after illumination for 0, 20, 40, and 60 s. (E and F) SEM images of GelMA and HAD, respectively. GelMA and HAD were freeze-dried and used for SEM observation. The average pore size was about 50 μm for both HAD and GelMA. Scale bar, 30 μm. Photo credit: Y. C. Guo and Y. Wang, Army Medical University.
Fig. 2
Fig. 2. Mechanical properties of HAD.
(A) Dynamic time-sweep rheological analysis showing the gelation kinetics of HAD. (B) G′ and G″ of HAD on strain amplitude sweep (γ = 0.1 to 1000%) at a fixed angular frequency (10 rad s−1). (C) Rheological performance of HAD under oscillation frequency test at 37°C. (D) Schematic of the lap shear test to determine the shear strength of HAD, GelMA, and fibrin glue on glass slides (n = 3). (E) Shear strength (stress) versus strain curves of lap shear tests. (F) Lap shear strength of HAD, GelMA, and fibrin glue (n = 3). (G) Porcine skin as a substrate for end-to-end adhesion strength of HAD, GelMA, and fibrin glue sealant. (H) Adhesive strength (stress) versus strain curves on a porcine skin test. (I) The end-to-end adhesive strength of HAD, GelMA, and fibrin glue (n = 3). For the dynamic time-sweep rheological analysis, the gel was cross-linked in situ during the course of the experiment (A). For other tests (B to I), the gel was precross-linked. Photo credit: Y. C. Guo and Y. Wang, Army Medical University.
Fig. 3
Fig. 3. In vitro hemostatic performance of HAD.
(A) Selection of the amount of HC to be incorporated in the GelMA by plasma clotting kinetics. (B) Slope (clotting rate) in the linear region of plasma clotting kinetics curves (n = 3). (C) The release of HC incorporated in HAD (n = 3). (D) Clot formation as a function of time for control, HC, GelMA, HAD, and fibrin glue. (E) Quantitative clot times (n = 3). (F to H) SEM images of whole-blood contact with GelMA for 1, 2, and 3 min, respectively. (I to K) SEM images of whole-blood contact with HAD for 1, 2, and 3 min, respectively. Scale bars, 3 μm. (*P < 0.05, **P < 0.01). Photo credit: Y. C. Guo and Y. Wang, Army Medical University.
Fig. 4
Fig. 4. Hemostatic performance of HAD in rat tail amputation model.
(A) Schematic illustration of the establishment of rat tail bleeding and hemostatic model. (B) The hemostatic test process in the rat tail model. (C) Qualitative bleeding images for different treatments. (D and E) Blood loss and hemostasis time, respectively (n = 3). (*P < 0.05, **P < 0.01, and ***P < 0.001). Photo credit: Y. C. Guo and Y. Wang, Army Medical University.
Fig. 5
Fig. 5. Skin wound closure with different treatments.
(A) Schematic illustration of the skin incision. (B) Photographs of the incision at days 0, 3, 5, and 20 (D0, D3, D5, and D20). (C) H&E staining of the wound at days 5 and 20. Wound profile is shown by the dotted yellow lines. Photo credit: Y. C. Guo and Y. Wang, Army Medical University.
Fig. 6
Fig. 6. Hemostatic properties of HAD in liver injury.
(A) Schematic illustration of the establishment of rat liver bleeding and hemostasis. (B) Testing process in liver injury. (C) Liver injury treated with gauze. (D) Time-course bleeding images of the liver. (E and F) Hemostasis time and blood loss (n = 3). (G) H&E staining of the wound at day 5 (*P < 0.05, **P < 0.01, and ***P < 0.001). Photo credit: Y. C. Guo and Y. Wang, Army Medical University.
Fig. 7
Fig. 7. Hemostatic effect on severe injury liver.
(A) Schematic illustration of the hemostatic process. (B) Hemostatic test process with HAD in severe liver wound model. (C) Hemostatic test process with GelMA in severe liver wound model. (D) Untreated wound as a control group. Photo credit: Y. C. Guo and Y. Wang, Army Medical University.
Fig. 8
Fig. 8. Hemostatic effect of HAD on rat abdominal aorta injury model.
(A) Schematic illustration of the establishment of the rat abdominal aorta injury model and sealing. (B) Hemostasis and sealing test in rat abdominal aorta injury model of HAD. (C) Hemostasis and sealing test in rat abdominal aorta injury model of GelMA. (D) The outer surface image of the abdominal aorta sealed by HAD. (E) The inner surface image of the abdominal aorta sealed by HAD. (F and G) HAD sealed abdominal aorta subjected to large bending and twisting. (H) SEM of the interface between HAD and the abdominal aorta. Scale bars, 100 μm. Photo credit: Y. C. Guo and Y. Wang, Army Medical University.
Fig. 9
Fig. 9. SEM investigation of hemostasis surface and interface in vivo.
(A-C) Illustration of the observation area about SEM. SEM observation area I is shown in (A1) and (A2); SEM observation area II is shown in (B1) and (B2); SEM observation area III is shown in (C). (A1 and A3) SEM of the exterior blood clot in GelMA group after cessation of bleeding. (A2 and A4) SEM of the exterior blood clot in HAD group after cessation of bleeding. (B1) SEM of the interior interface between bleeding liver and the GelMA (white arrow). (B2) SEM of the interior interface between bleeding liver and HAD (white arrow). (C1) SEM of the interior wound. Arbitrary locations from the cut site to the edge were marked as (C2) to (C5), and their corresponding magnified images in (C2), (C3), (C4), and (C5), respectively. Scale bars, 3 μm (A1 to A4), 2 μm (B1 and B2), 10 μm (C1), and 2 μm (C2 to C5).
Fig. 10
Fig. 10. SEM of the blood clots in rat liver with HAD treatment.
(A) Illustration of the SEM observation area. SEM observation area I shown in (B); SEM observation area II shown in (C) and (D); SEM observation area III shown in (E) to (J). (B) SEM of the interaction of fibrin and RBCs. (C and D) SEM image of an inside clot. (E to G) SEM of RBCs at 30 s and 1 and 2 min in a bleeding liver. (H) Platelets pulling and bending fibrin fibers to generate contractile stress and causing clot contraction. (I) Platelets deformed to form a compact structure. (J) The internally contracted platelets developed a close-packed, tessellated array of compressed polyhedra, forming a dense barrier important for hemostasis. (K) The process of clot contraction in the shrinkage of clot volume over time. Scale bars, 1 μm.

References

    1. Li J., Celiz A. D., Yang J., Yang Q., Wamala I., Whyte W., Seo B. R., Vasilyev N. V., Vlassak J. J., Suo Z., Mooney D. J., Tough adhesives for diverse wet surfaces. Science 357, 378–381 (2017). - PMC - PubMed
    1. Yuk H., Varela C. E., Nabzdyk C. S., Mao X., Padera R. F., Roche E. T., Zhao X., Dry double-sided tape for adhesion of wet tissues and devices. Nature 575, 169–174 (2019). - PubMed
    1. Ghobril C., Charoen K., Rodriguez E. K., Nazarian A., Grinstaff M. W., A dendritic thioester hydrogel based on thiol-thioester exchange as a dissolvable sealant system for wound closure. Angew. Chem. Int. Ed. 52, 14070–14074 (2013). - PMC - PubMed
    1. Sharma B., Fermanian S., Gibson M., Unterman S., Herzka D. A., Cascio B., Coburn J., Hui A. Y., Marcus N., Gold G. E., Elisseeff J. H., Human cartilage repair with a photoreactive adhesive-hydrogel composite. Sci. Transl. Med. 5, 167ra166 (2013). - PMC - PubMed
    1. Xu X., Xia X., Zhang K., Rai A., Li Z., Zhao P., Wei K., Zou L., Yang B., Wong W.-K., Chiu P. W.-Y., Bian L., Bioadhesive hydrogels demonstrating pH-independent and ultrafast gelation promote gastric ulcer healing in pigs. Sci. Transl. Med. 12, eaba8014 (2020). - PubMed

LinkOut - more resources