

Systematic evaluation of the association between hemoglobin levels and metabolic profile implicates beneficial effects of hypoxia
- PMID: 34261659
- PMCID: PMC8279517
- DOI: 10.1126/sciadv.abi4822
Systematic evaluation of the association between hemoglobin levels and metabolic profile implicates beneficial effects of hypoxia
Abstract
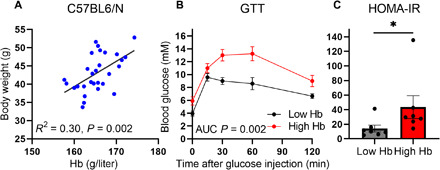
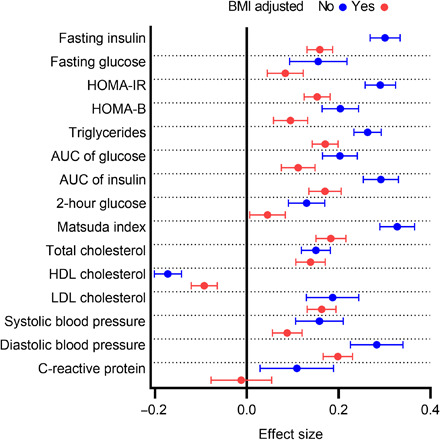
Activation of the hypoxia-inducible factor (HIF) pathway reprograms energy metabolism. Hemoglobin (Hb) is the main carrier of oxygen. Using its normal variation as a surrogate measure for hypoxia, we explored whether lower Hb levels could lead to healthier metabolic profiles in mice and humans (n = 7175) and used Mendelian randomization (MR) to evaluate potential causality (n = 173,480). The results showed evidence for lower Hb levels being associated with lower body mass index, better glucose tolerance and other metabolic profiles, lower inflammatory load, and blood pressure. Expression of the key HIF target genes SLC2A4 and Slc2a1 in skeletal muscle and adipose tissue, respectively, associated with systolic blood pressure in MR analyses and body weight, liver weight, and adiposity in mice. Last, manipulation of murine Hb levels mediated changes to key metabolic parameters. In conclusion, low-end normal Hb levels may be favorable for metabolic health involving mild chronic activation of the HIF response.
Copyright © 2021 The Authors, some rights reserved; exclusive licensee American Association for the Advancement of Science. No claim to original U.S. Government Works. Distributed under a Creative Commons Attribution License 4.0 (CC BY).
Figures


References
-
- van der Harst P., Zhang W., Leach I. M., Rendon A., Verweij N., Sehmi J., Paul D. S., Elling U., Allayee H., Li X., Radhakrishnan A., Tan S. T., Voss K., Weichenberger C. X., Albers C. A., Al-Hussani A., Asselbergs F. W., Ciullo M., Danjou F., Dina C., Esko T., Evans D. M., Franke L., Gogele M., Hartiala J., Hersch M., Holm H., Hottenga J. J., Kanoni S., Kleber M. E., Lagou V., Langenberg C., Lopez L. M., Lyytikainen L. P., Melander O., Murgia F., Nolte I. M., O’Reilly P. F., Padmanabhan S., Parsa A., Pirastu N., Porcu E., Portas L., Prokopenko I., Ried J. S., Shin S. Y., Tang C. S., Teumer A., Traglia M., Ulivi S., Westra H. J., Yang J., Zhao J. H., Anni F., Abdellaoui A., Attwood A., Balkau B., Bandinelli S., Bastardot F., Benyamin B., Boehm B. O., Cookson W. O., Das D., de Bakker P. I., de Boer R. A., de Geus E. J., de Moor M. H., Dimitriou M., Domingues F. S., Doring A., Engstrom G., Eyjolfsson G. I., Ferrucci L., Fischer K., Galanello R., Garner S. F., Genser B., Gibson Q. D., Girotto G., Gudbjartsson D. F., Harris S. E., Hartikainen A. L., Hastie C. E., Hedblad B., Illig T., Jolley J., Kahonen M., Kema I. P., Kemp J. P., Liang L., Lloyd-Jones H., Loos R. J., Meacham S., Medland S. E., Meisinger C., Memari Y., Mihailov E., Miller K., Moffatt M. F., Nauck M., Novatchkova M., Nutile T., Olafsson I., Onundarson P. T., Parracciani D., Penninx B. W., Perseu L., Piga A., Pistis G., Pouta A., Puc U., Raitakari O., Ring S. M., Robino A., Ruggiero D., Ruokonen A., Saint-Pierre A., Sala C., Salumets A., Sambrook J., Schepers H., Schmidt C. O., Sillje H. H., Sladek R., Smit J. H., Starr J. M., Stephens J., Sulem P., Tanaka T., Thorsteinsdottir U., Tragante V., van Gilst W. H., van Pelt L. J., van Veldhuisen D. J., Volker U., Whitfield J. B., Willemsen G., Winkelmann B. R., Wirnsberger G., Algra A., Cucca F., d’Adamo A. P., Danesh J., Deary I. J., Dominiczak A. F., Elliott P., Fortina P., Froguel P., Gasparini P., Greinacher A., Hazen S. L., Jarvelin M. R., Khaw K. T., Lehtimaki T., Maerz W., Martin N. G., Metspalu A., Mitchell B. D., Montgomery G. W., Moore C., Navis G., Pirastu M., Pramstaller P. P., Ramirez-Solis R., Schadt E., Scott J., Shuldiner A. R., Smith G. D., Smith J. G., Snieder H., Sorice R., Spector T. D., Stefansson K., Stumvoll M., Tang W. H., Toniolo D., Tonjes A., Visscher P. M., Vollenweider P., Wareham N. J., Wolffenbuttel B. H., Boomsma D. I., Beckmann J. S., Dedoussis G. V., Deloukas P., Ferreira M. A., Sanna S., Uda M., Hicks A. A., Penninger J. M., Gieger C., Kooner J. S., Ouwehand W. H., Soranzo N., Chambers J. C., Seventy-five genetic loci influencing the human red blood cell. Nature 492, 369–375 (2012). - PMC - PubMed
-
- Patel K. V., Variability and heritability of hemoglobin concentration: An opportunity to improve understanding of anemia in older adults. Haematologica 93, 1281–1283 (2008). - PubMed
-
- Lobigs L. M., Knight E. J., Schumacher Y. O., Gore C. J., Within-subject haemoglobin variation in elite athletes: A longitudinal investigation of 13 887 haemoglobin concentration readings. Drug Test. Anal. 8, 228–234 (2016). - PubMed
-
- Jobsis F. F., Noninvasive, infrared monitoring of cerebral and myocardial oxygen sufficiency and circulatory parameters. Science 198, 1264–1267 (1977). - PubMed
-
- Sevick E. M., Chance B., Leigh J., Nioka S., Maris M., Quantitation of time- and frequency-resolved optical spectra for the determination of tissue oxygenation. Anal. Biochem. 195, 330–351 (1991). - PubMed
Publication types
MeSH terms
Substances
Grants and funding
LinkOut - more resources
Full Text Sources
Other Literature Sources
Miscellaneous
