. 2021 Nov 1;27(21):5939-5950.
doi: 10.1158/1078-0432.CCR-20-4607. Epub 2021 Jul 14.

Integrative Profiling of T790M-Negative EGFR-Mutated NSCLC Reveals Pervasive Lineage Transition and Therapeutic Opportunities

Affiliations

Integrative Profiling of T790M-Negative EGFR-Mutated NSCLC Reveals Pervasive Lineage Transition and Therapeutic Opportunities

Khi Pin Chua et al. Clin Cancer Res. .

Abstract

Purpose: Despite the established role of EGFR tyrosine kinase inhibitors (TKIs) in EGFR-mutated NSCLC, drug resistance inevitably ensues, with a paucity of treatment options especially in EGFR T790M-negative resistance.

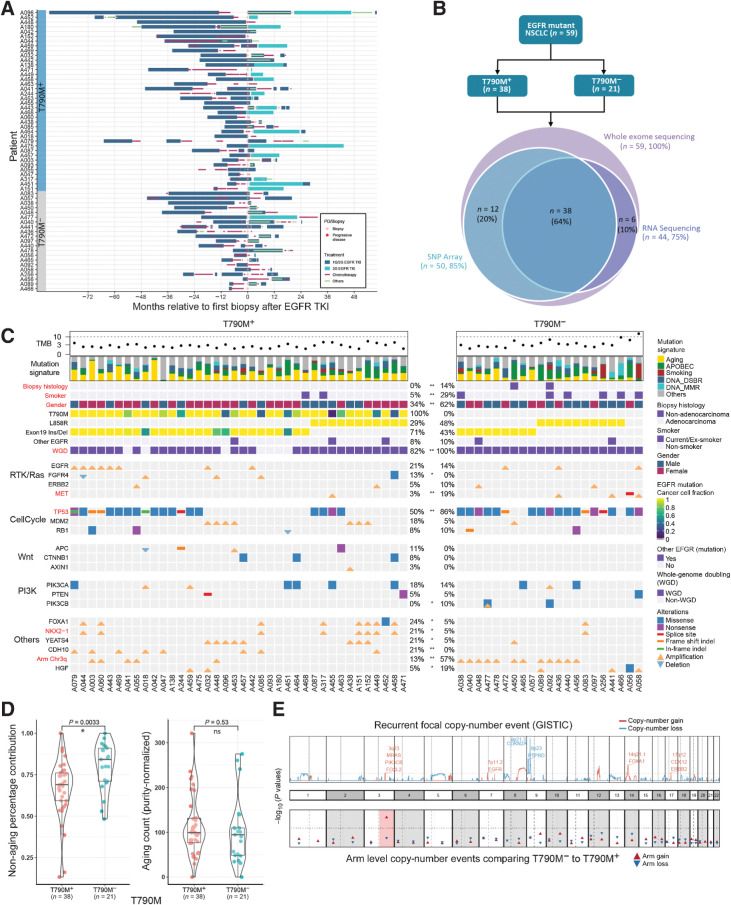
Experimental design: We performed whole-exome and transcriptome analysis of 59 patients with first- and second-generation EGFR TKI-resistant metastatic EGFR-mutated NSCLC to characterize and compare molecular alterations mediating resistance in T790M-positive (T790M+) and -negative (T790M-) disease.

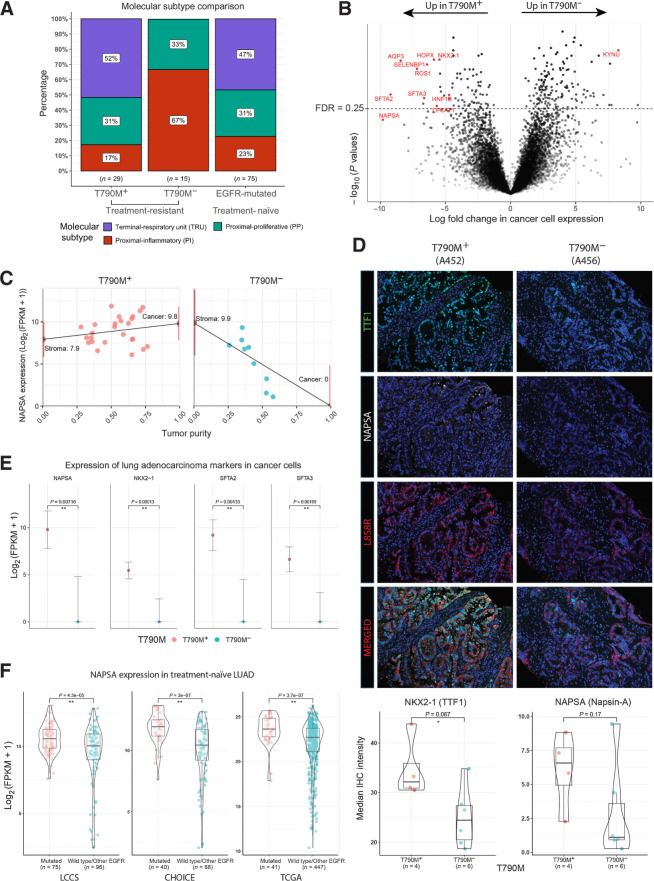
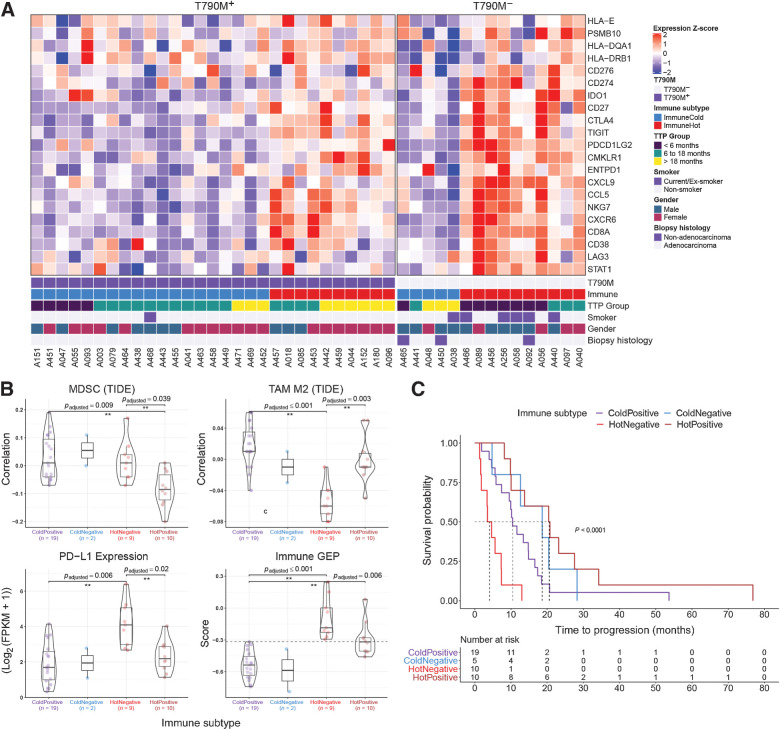
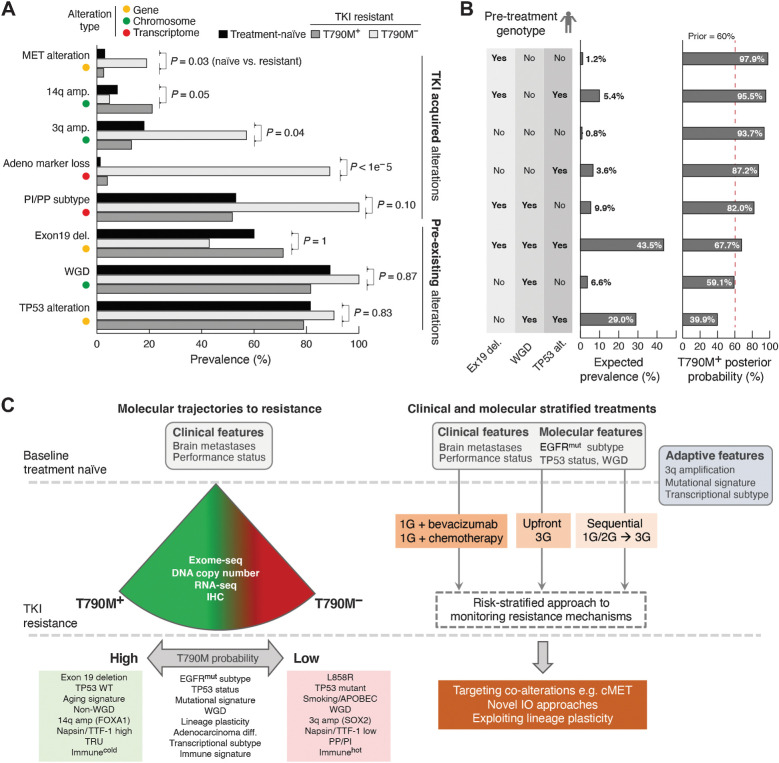
Results: Transcriptomic analysis revealed ubiquitous loss of adenocarcinoma lineage gene expression in T790M- tumors, orthogonally validated using multiplex IHC. There was enrichment of genomic features such as TP53 alterations, 3q chromosomal amplifications, whole-genome doubling and nonaging mutational signatures in T790M- tumors. Almost half of resistant tumors were further classified as immunehot, with clinical outcomes conditional on immune cell-infiltration state and T790M status. Finally, using a Bayesian statistical approach, we explored how T790M- and T790M+ disease might be predicted using comprehensive genomic and transcriptomic profiles of treatment-naïve patients.

Conclusions: Our results illustrate the interplay between genetic alterations, cell lineage plasticity, and immune microenvironment in shaping divergent TKI resistance and outcome trajectories in EGFR-mutated NSCLC. Genomic and transcriptomic profiling may facilitate the design of bespoke therapeutic approaches tailored to a tumor's adaptive potential.


Figures

Figure 1. Genomic correlates of EGFR TKI resistance. A, Treatment histories for individual patients; each bar color represents a treatment type. B, Sequencing experiments conducted in this study. C, Genomic landscape of EGFR TKI resistance. Mutations shown are previously proposed mechanisms (EGFR, ERBB2 and MET amplification; MDM2, RB1, PIK3CA, PTEN, PIK3CB alterations) or alterations in >5 patients that were significantly different between T790M+ and T790M− cohorts (*, P < 0.10; **, P < 0.05). Significant differences between T790M+ and T790M− tumors are highlighted in bold red color. WGD: whole-genome doubling. Other EGFR: any other EGFR mutations besides L858R and exon 19 indel. D, Left, relative contribution of aging signature mutations comparing T790M+ and T790M− cohorts. Right, the absolute number of aging mutations (adjusted for tumor purity) are similar between T790M+ and T790M− tumors. E, (Top) Recurrent focal copy-number events (red: amplification; blue: deletion). Bottom, P values comparing proportion of samples with chromosomal arm events between T790M+ and T790M− cohorts. Chromosome 3q gain (highlighted in red) is the only significant event.
Figure 1.
Genomic correlates of EGFR TKI resistance. A, Treatment histories for individual patients; each bar color represents a treatment type. B, Sequencing experiments conducted in this study. C, Genomic landscape of EGFR TKI resistance. Mutations shown are previously proposed mechanisms (EGFR, ERBB2 and MET amplification; MDM2, RB1, PIK3CA, PTEN, PIK3CB alterations) or alterations in >5 patients that were significantly different between T790M+ and T790M cohorts (*, P < 0.10; **, P < 0.05). Significant differences between T790M+ and T790M tumors are highlighted in bold red color. WGD: whole-genome doubling. Other EGFR: any other EGFR mutations besides L858R and exon 19 indel. D, Left, relative contribution of aging signature mutations comparing T790M+ and T790M cohorts. Right, the absolute number of aging mutations (adjusted for tumor purity) are similar between T790M+ and T790M tumors. E, (Top) Recurrent focal copy-number events (red: amplification; blue: deletion). Bottom, P values comparing proportion of samples with chromosomal arm events between T790M+ and T790M cohorts. Chromosome 3q gain (highlighted in red) is the only significant event.
Figure 2. Tumor transcriptomic correlates of EGFR TKI resistance. A, Proportions of molecular transcriptomic subtype assigned to EGFR TKI-resistant tumors and treatment-naïve EGFR-mutated tumors. B, Volcano plot of log10(P values) against log-fold change in cancer cell expression of all genes tested. Lung adenocarcinoma markers (NAPSA, NKX2–1, SFTA2, and SFTA2) and other pulmonary differentiation markers are highlighted in red (Supplementary Table S4). C, Illustration of tumor transcriptome deconvolution approach for napsin-A (NAPSA). NAPSA gene expression is strongly correlated with purity in T790M− but not T790M+ tumors. NAPSA expression is inferred for a tumor with 0% (stroma) and 100% (cancer) tumor purity. Only lung tumor tissue and samples without abnormal high expression of squamous or neuroendocrine related genes are used for (B) and (C). D, Multiplex IHC staining of NAPSA, NKX2–1, and L858R (Surrogate for cancer cells). Images shown represent two tumors with striking difference in the IHC staining. Bottom, Bar–violin plots compare the median IHC intensity in NAPSA and NKX2–1 in all cells stained for L858R for each individual tumor with IHC data available. E, Cancer cell expression of lung adenocarcinoma markers comparing T790M+ and T790M− cohorts. F, Bulk tumor expression of lung adenocarcinoma markers comparing treatment-naïve EGFR-mutated and EGFR wild-type tumors across three public cohorts.
Figure 2.
Tumor transcriptomic correlates of EGFR TKI resistance. A, Proportions of molecular transcriptomic subtype assigned to EGFR TKI-resistant tumors and treatment-naïve EGFR-mutated tumors. B, Volcano plot of log10(P values) against log-fold change in cancer cell expression of all genes tested. Lung adenocarcinoma markers (NAPSA, NKX2–1, SFTA2, and SFTA2) and other pulmonary differentiation markers are highlighted in red (Supplementary Table S4). C, Illustration of tumor transcriptome deconvolution approach for napsin-A (NAPSA). NAPSA gene expression is strongly correlated with purity in T790M but not T790M+ tumors. NAPSA expression is inferred for a tumor with 0% (stroma) and 100% (cancer) tumor purity. Only lung tumor tissue and samples without abnormal high expression of squamous or neuroendocrine related genes are used for (B) and (C). D, Multiplex IHC staining of NAPSA, NKX2–1, and L858R (Surrogate for cancer cells). Images shown represent two tumors with striking difference in the IHC staining. Bottom, Bar–violin plots compare the median IHC intensity in NAPSA and NKX2–1 in all cells stained for L858R for each individual tumor with IHC data available. E, Cancer cell expression of lung adenocarcinoma markers comparing T790M+ and T790M cohorts. F, Bulk tumor expression of lung adenocarcinoma markers comparing treatment-naïve EGFR-mutated and EGFR wild-type tumors across three public cohorts.
Figure 3. Stromal transcriptomic correlates of EGFR TKI resistance. A, Relative expression of genes used in the immune GEP calculation (39). Patients were clustered into two groups using consensus k-mean clustering and sorted by T790M status followed by time to progression (TTP). B, Comparison of immune-suppressive cells correlation index (derived using TIDE) and expression levels of immune checkpoint genes (PD-L1 gene expression shown here) between immune subtypes. Immune GEP score was calculated using the method from Cristescu et al. (39). Horizontal line demarcates GEP score of −0.318, defined as the cutoff for high GEP in the original article. Pairwise comparison test was carried out using Games–Howell test and P values were adjusted using Benjamin–Hochberg procedure. C, Kaplan–Meier curve of EGFR TKI TTP comparing different immune subtypes.
Figure 3.
Stromal transcriptomic correlates of EGFR TKI resistance. A, Relative expression of genes used in the immune GEP calculation (39). Patients were clustered into two groups using consensus k-mean clustering and sorted by T790M status followed by time to progression (TTP). B, Comparison of immune-suppressive cells correlation index (derived using TIDE) and expression levels of immune checkpoint genes (PD-L1 gene expression shown here) between immune subtypes. Immune GEP score was calculated using the method from Cristescu et al. (39). Horizontal line demarcates GEP score of −0.318, defined as the cutoff for high GEP in the original article. Pairwise comparison test was carried out using Games–Howell test and P values were adjusted using Benjamin–Hochberg procedure. C, Kaplan–Meier curve of EGFR TKI TTP comparing different immune subtypes.
Figure 4. Data-driven TKI treatment algorithm. A, Genomic and transcriptomic alterations with distinct frequencies in patients with T790M+ and T790M− disease. The observed prevalence of each alteration in T790M+ and T790M− groups as well as patients with treatment-naïve late-stage EGFR-mutated tumors are shown. Testing the null-hypothesis that frequencies of individual alteration types are not different between treatment-naïve and resistant cohorts, alterations were divided into either likely pre-existing or likely TKI-treatment acquired alterations. B, The expected patient prevalence for each (n = 8) combination/genotype of the three inferred pre-existing alterations. The posterior probability was estimated for each genotype using Bayesian updating. C, Summary of molecular features that modify probability of T790M (left), and potential to use baseline clinical and molecular features, as well as adaptive changes to determine optimal therapeutic strategy (right).
Figure 4.
Data-driven TKI treatment algorithm. A, Genomic and transcriptomic alterations with distinct frequencies in patients with T790M+ and T790M disease. The observed prevalence of each alteration in T790M+ and T790M groups as well as patients with treatment-naïve late-stage EGFR-mutated tumors are shown. Testing the null-hypothesis that frequencies of individual alteration types are not different between treatment-naïve and resistant cohorts, alterations were divided into either likely pre-existing or likely TKI-treatment acquired alterations. B, The expected patient prevalence for each (n = 8) combination/genotype of the three inferred pre-existing alterations. The posterior probability was estimated for each genotype using Bayesian updating. C, Summary of molecular features that modify probability of T790M (left), and potential to use baseline clinical and molecular features, as well as adaptive changes to determine optimal therapeutic strategy (right).

References

    1. Mok TS, Wu Y-L, Thongprasert S, Yang C-H, Chu D-T, Saijo N, et al. Gefitinib or carboplatin-paclitaxel in pulmonary adenocarcinoma. N Engl J Med 2009;361:947–57. - PubMed
    1. Park K, Tan E-H, O'Byrne K, Zhang L, Boyer M, Mok T, et al. Afatinib versus gefitinib as first-line treatment of patients with EGFR mutation-positive non–small cell lung cancer (LUX-Lung 7): a phase 2B, open-label, randomised controlled trial. Lancet Oncol 2016;17:577–89. - PubMed
    1. Rosell R, Carcereny E, Gervais R, Vergnenegre A, Massuti B, Felip E, et al. Erlotinib versus standard chemotherapy as first-line treatment for European patients with advanced EGFR mutation-positive non–small cell lung cancer (EURTAC): a multicentre, open-label, randomised phase 3 trial. Lancet Oncol 2012;13:239–46. - PubMed
    1. Soria J-C, Ohe Y, Vansteenkiste J, Reungwetwattana T, Chewaskulyong B, Lee KH, et al. Osimertinib in untreated EGFR-mutated advanced non–small cell lung cancer. N Engl J Med 2018;378:113–25. - PubMed
    1. Noronha V, Patil VM, Joshi A, Menon N, Chougule A, Mahajan A, et al. Gefitinib versus gefitinib plus pemetrexed and carboplatin chemotherapy in EGFR-mutated lung cancer. J Clin Oncol 2020;38:124–36. - PubMed

Publication types

MeSH terms