

Predicting the SARS-CoV-2 effective reproduction number using bulk contact data from mobile phones
- PMID: 34261775
- PMCID: PMC8346907
- DOI: 10.1073/pnas.2026731118
Predicting the SARS-CoV-2 effective reproduction number using bulk contact data from mobile phones
Abstract
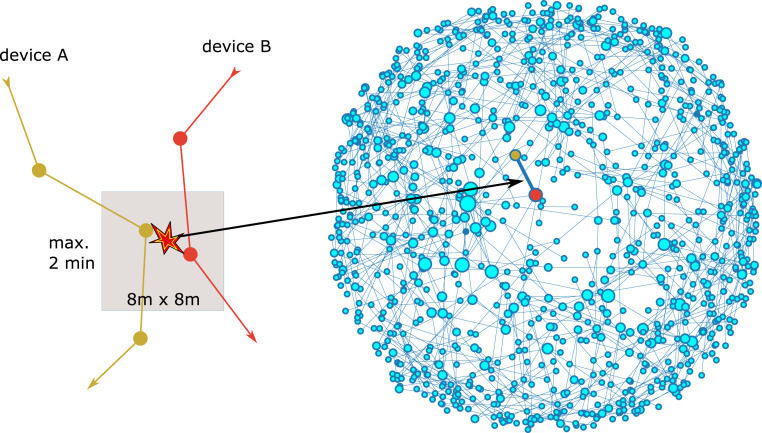
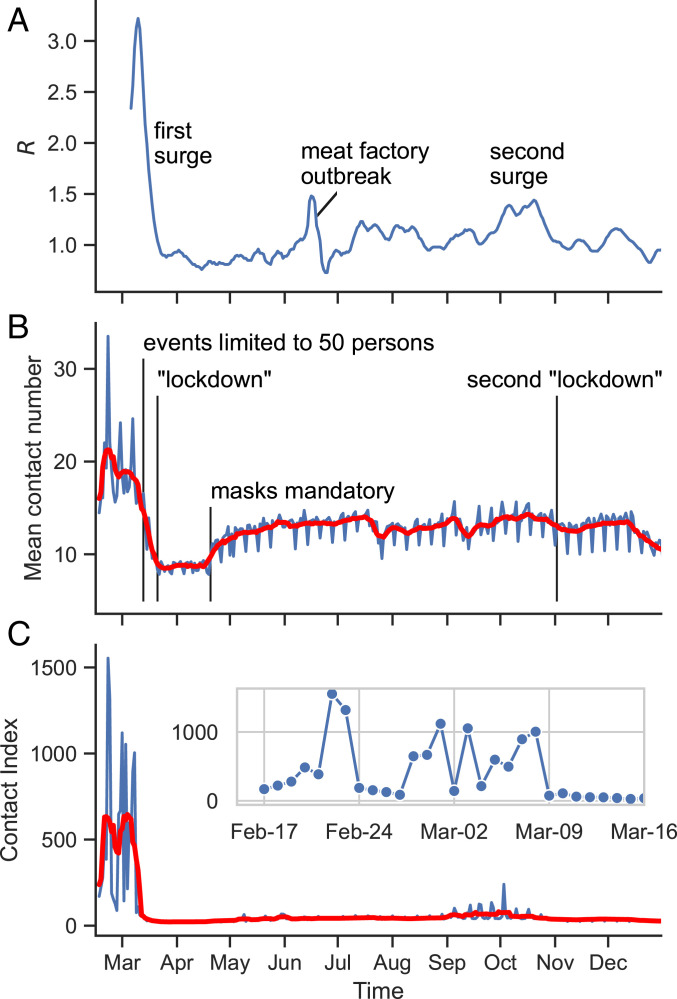
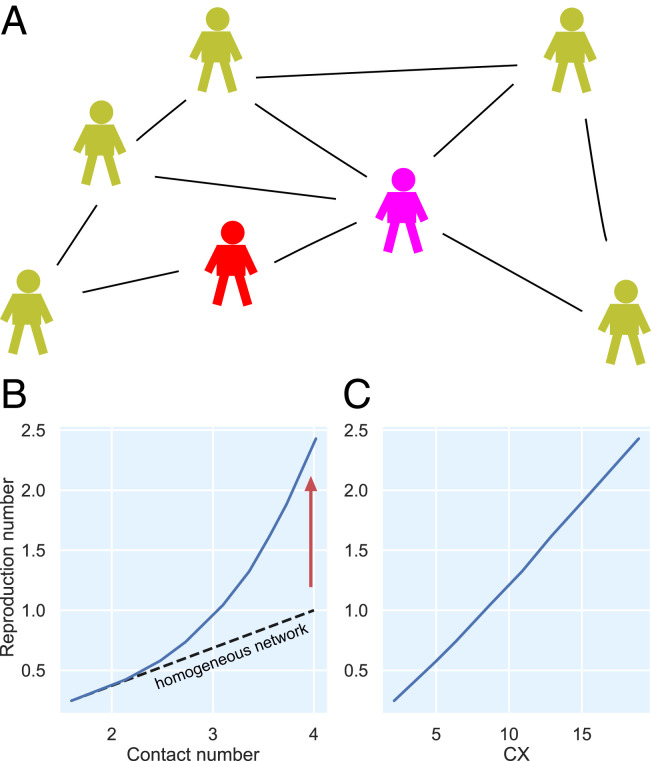
Over the last months, cases of SARS-CoV-2 surged repeatedly in many countries but could often be controlled with nonpharmaceutical interventions including social distancing. We analyzed deidentified Global Positioning System (GPS) tracking data from 1.15 to 1.4 million cell phones in Germany per day between March and November 2020 to identify encounters between individuals and statistically evaluate contact behavior. Using graph sampling theory, we estimated the contact index (CX), a metric for number and heterogeneity of contacts. We found that CX, and not the total number of contacts, is an accurate predictor for the effective reproduction number R derived from case numbers. A high correlation between CX and R recorded more than 2 wk later allows assessment of social behavior well before changes in case numbers become detectable. By construction, the CX quantifies the role of superspreading and permits assigning risks to specific contact behavior. We provide a critical CX value beyond which R is expected to rise above 1 and propose to use that value to leverage the social-distancing interventions for the coming months.
Keywords: COVID-19; epidemiology; network science.
Copyright © 2021 the Author(s). Published by PNAS.
Conflict of interest statement
The authors declare no competing interest.
Figures

Similar articles
-
Overdispersion in COVID-19 increases the effectiveness of limiting nonrepetitive contacts for transmission control.Proc Natl Acad Sci U S A. 2021 Apr 6;118(14):e2016623118. doi: 10.1073/pnas.2016623118. Proc Natl Acad Sci U S A. 2021. PMID: 33741734 Free PMC article.
-
Development of a web-based contact tracing and point-of-care-testing workflow for SARS-CoV-2 at a German University Hospital.Antimicrob Resist Infect Control. 2021 Jul 2;10(1):102. doi: 10.1186/s13756-021-00971-2. Antimicrob Resist Infect Control. 2021. PMID: 34215330 Free PMC article.
-
Effective control of SARS-CoV-2 transmission in Wanzhou, China.Nat Med. 2021 Jan;27(1):86-93. doi: 10.1038/s41591-020-01178-5. Epub 2020 Nov 30. Nat Med. 2021. PMID: 33257893
-
Transmission dynamics and control of two epidemic waves of SARS-CoV-2 in South Korea.BMC Infect Dis. 2021 May 26;21(1):485. doi: 10.1186/s12879-021-06204-6. BMC Infect Dis. 2021. PMID: 34039296 Free PMC article.
-
Clustering and superspreading potential of SARS-CoV-2 infections in Hong Kong.Nat Med. 2020 Nov;26(11):1714-1719. doi: 10.1038/s41591-020-1092-0. Epub 2020 Sep 17. Nat Med. 2020. PMID: 32943787
Cited by
-
Country-report pattern corrections of new cases allow accurate 2-week predictions of COVID-19 evolution with the Gompertz model.Sci Rep. 2024 May 11;14(1):10775. doi: 10.1038/s41598-024-61233-w. Sci Rep. 2024. PMID: 38730261 Free PMC article.
-
A high-frequency mobility big-data reveals how COVID-19 spread across professions, locations and age groups.PLoS Comput Biol. 2023 Apr 27;19(4):e1011083. doi: 10.1371/journal.pcbi.1011083. eCollection 2023 Apr. PLoS Comput Biol. 2023. PMID: 37104532 Free PMC article.
-
Epidemic modelling of monitoring public behavior using surveys during pandemic-induced lockdowns.Commun Med (Lond). 2023 Jun 8;3(1):80. doi: 10.1038/s43856-023-00310-z. Commun Med (Lond). 2023. PMID: 37291090 Free PMC article.
-
Global or local modeling for XGBoost in geospatial studies upon simulated data and German COVID-19 infection forecasting.Sci Rep. 2025 Mar 14;15(1):8858. doi: 10.1038/s41598-025-92995-6. Sci Rep. 2025. PMID: 40087346 Free PMC article.
-
Transmission Dynamics and Effectiveness of Control Measures during COVID-19 Surge, Taiwan, April-August 2021.Emerg Infect Dis. 2022 Oct;28(10):2051-2059. doi: 10.3201/eid2810.220456. Epub 2022 Sep 14. Emerg Infect Dis. 2022. PMID: 36104202 Free PMC article.
References
Publication types
MeSH terms
LinkOut - more resources
Full Text Sources
Medical
Miscellaneous
