. 2021 Jul 14;6(1):270.
doi: 10.1038/s41392-021-00688-z.

Spontaneous apoptosis of cells in therapeutic stem cell preparation exert immunomodulatory effects through release of phosphatidylserine

Affiliations

Spontaneous apoptosis of cells in therapeutic stem cell preparation exert immunomodulatory effects through release of phosphatidylserine

Xuemei He et al. Signal Transduct Target Ther. .

Erratum in

Abstract

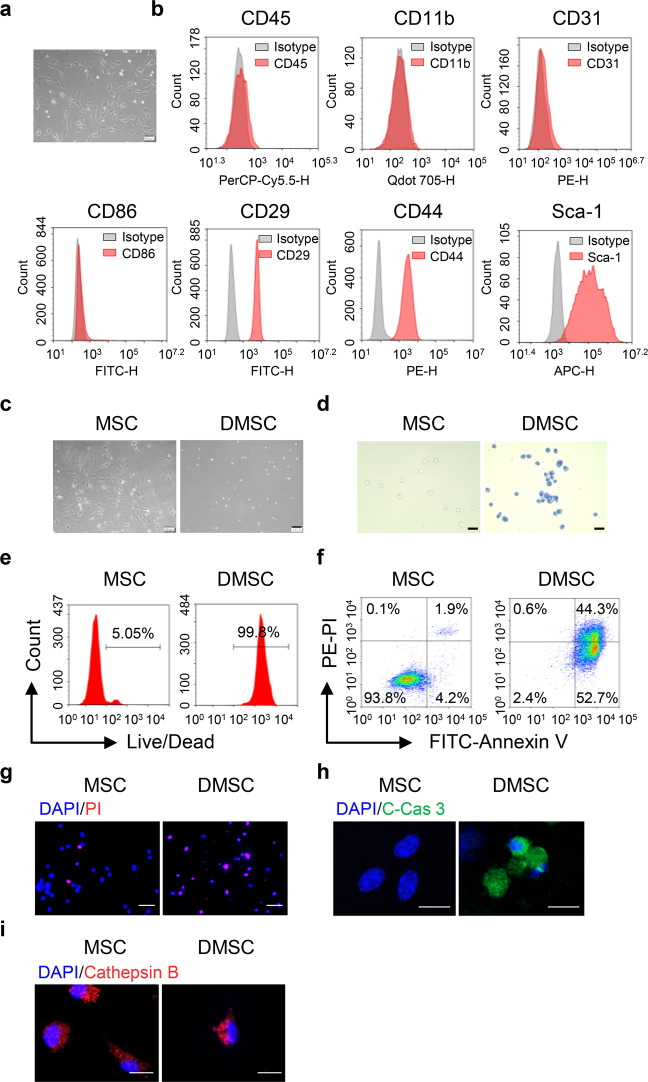
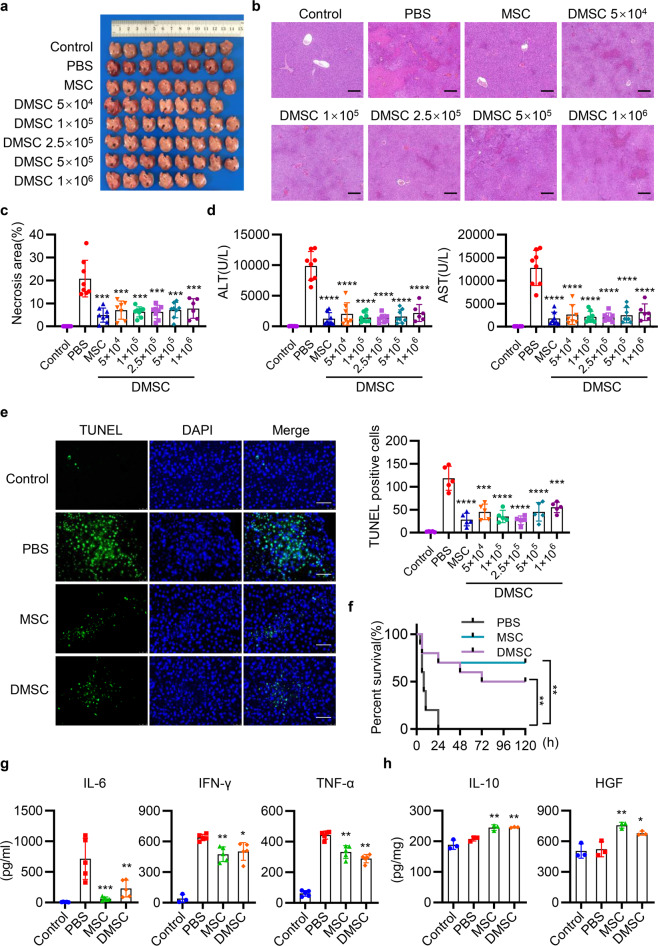
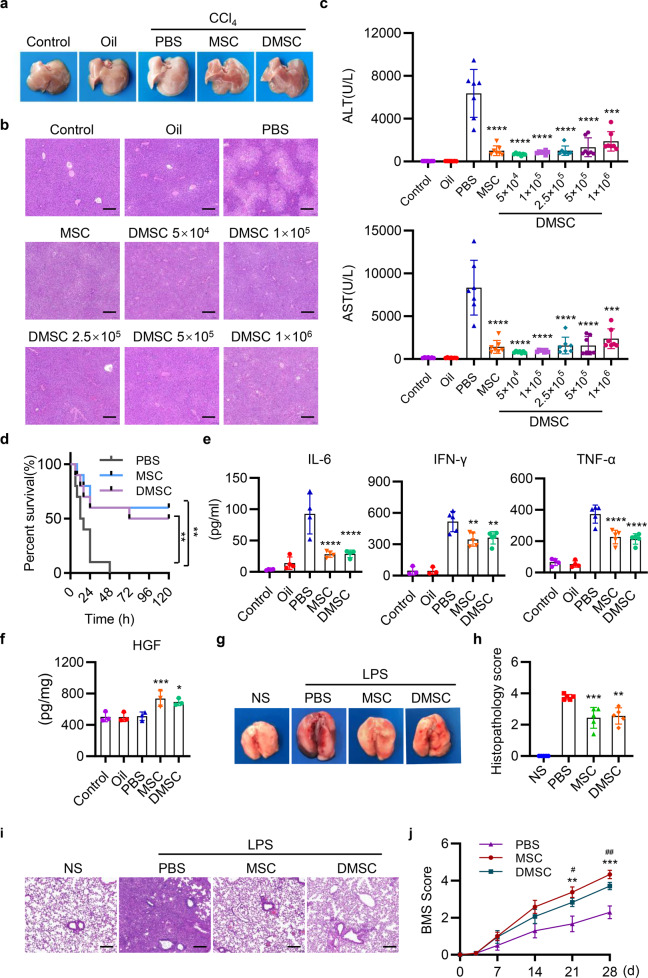
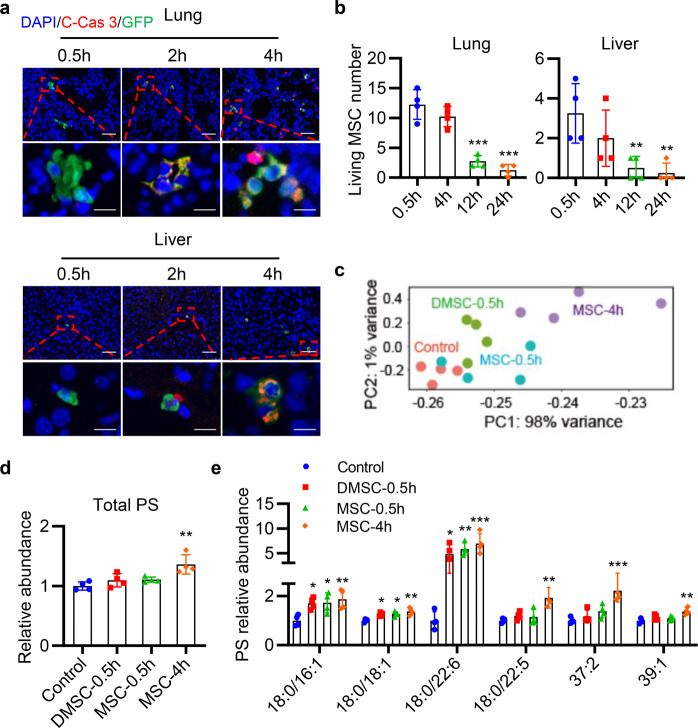
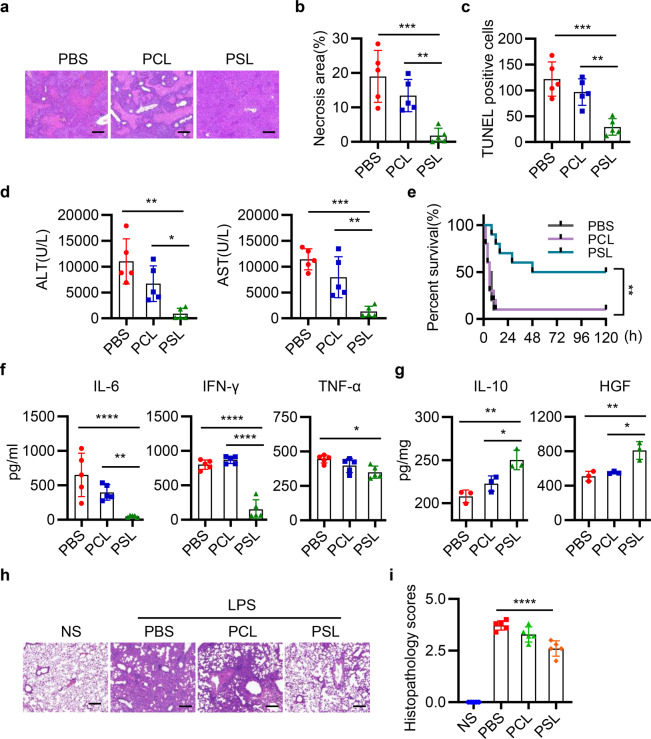
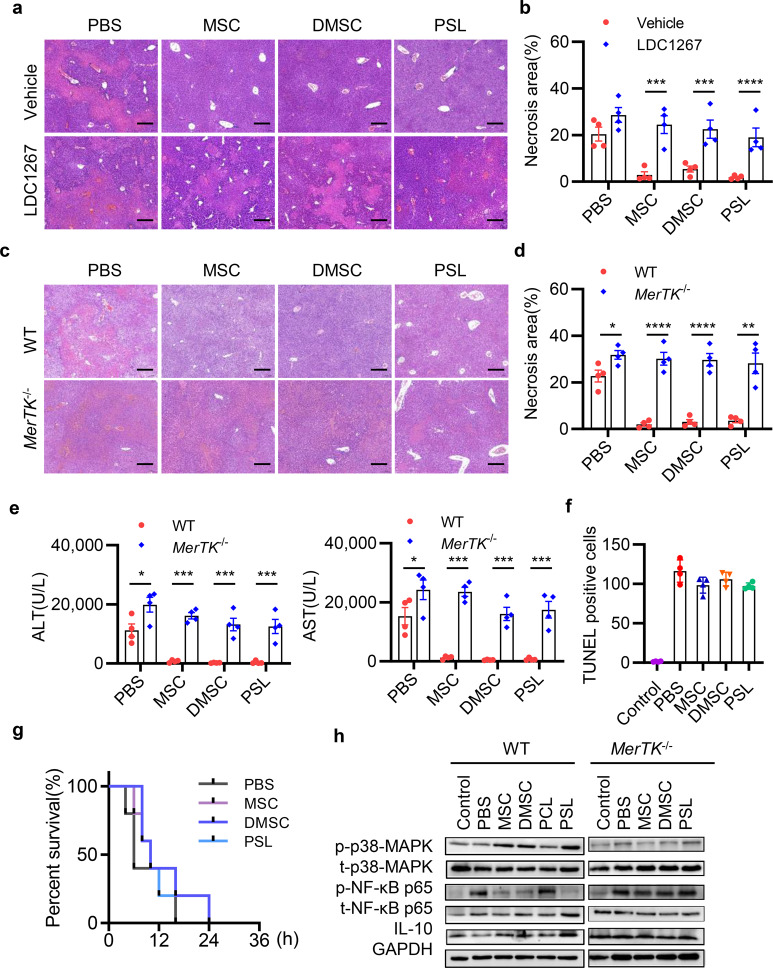
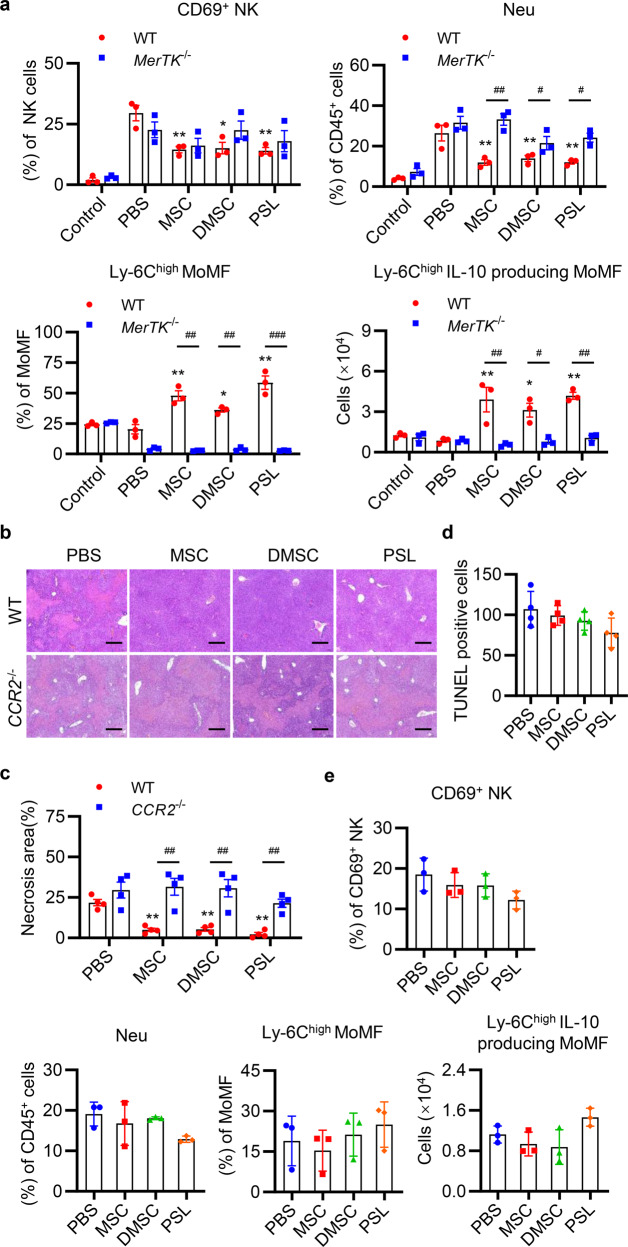
Mesenchymal stem cell (MSC)-mediated immunomodulation has been harnessed for the treatment of human diseases, but its underlying mechanism has not been fully understood. Dead cells, including apoptotic cells have immunomodulatory properties. It has been repeatedly reported that the proportion of nonviable MSCs in a MSC therapeutic preparation varied from 5~50% in the ongoing clinical trials. It is conceivable that the nonviable cells in a MSC therapeutic preparation may play a role in the therapeutic effects of MSCs. We found that the MSC therapeutic preparation in the present study had about 5% dead MSCs (DMSCs), characterized by apoptotic cells. Namely, 1 × 10⁶ MSCs in the preparation contained about 5 × 10⁴ DMSCs. We found that the treatment with even 5 × 10⁴ DMSCs alone had the equal therapeutic effects as with 1 × 10⁶ MSCs. This protective effect of the dead MSCs alone was confirmed in four mouse models, including concanavalin A (ConA)- and carbon tetrachloride (CCl4)-induced acute liver injury, LPS-induced lung injury and spinal cord injury. We also found that the infused MSCs died by apoptosis in vivo. Furthermore, the therapeutic effect was attributed to the elevated level of phosphatidylserine (PS) upon the injection of MSCs or DMSCs. The direct administration of PS liposomes (PSLs) mimic apoptotic cell fragments also exerted the protective effects as MSCs and DMSCs. The Mer tyrosine kinase (MerTK) deficiency or the knockout of chemokine receptor C-C motif chemokine receptor 2 (CCR2) reversed these protective effects of MSCs or DMSCs. These results revealed that DMSCs alone in the therapeutic stem cell preparation or the apoptotic cells induced in vivo may exert the same immunomodulatory property as the "living MSCs preparation" through releasing PS, which was further recognized by MerTK and participated in modulating immune cells.


Conflict of interest statement

All authors declare no competing interests. C.H. is the editorial board member of Signal Transduction and Targeted Therapy, but he has not been involved in the process of the manuscript handling.

Figures

Fig. 1
Fig. 1
Culture and identification of MSCs and DMSCs. a The morphology of MSCs. Scale bar represents 100 μm. b MSCs were identified as CD45CD11bCD31CD86CD29+CD44+Sca-1+. c Morphology of living MSCs and DMSCs. Scale bar represents 100 μm. d Identification of living and dead MSCs by Trypan blue. Scale bar represents 100 μm. e Living and dead MSCs were stained using LIVE/DEADTM Near-IR Dead Cell Stain Kit and were analyzed by flow cytometry. f The apoptosis of MSCs and DMSCs detected by flow cytometry. g The PI staining of MSCs and DMSCs. Scale bar represents 50 μm. h, i The expression of cleaved caspase 3 (h) and Cathepsin B (i) in MSCs and DMSCs. Scale bar represents 10 μm. C-Cas 3, cleaved caspase 3
Fig. 2
Fig. 2
MSCs and DMSCs attenuate ConA-induced liver injury in mice. a Mice were intravenously injected with 12 mg/kg ConA, followed by intravenous injection with PBS, 1 × 106 MSCs (containing 5 × 104 DMSCs) or 5 × 104 to 5 × 106 DMSCs. Twelve hours after administration of ConA, mice were killed and representative macroscopic images of livers were shown. n = 6~8. b Representative images of liver histopathology with H&E staining. Scale bar represents 200 μm. ce Quantitative analysis of necrotic area (c), serum ALT and AST levels (d), and TUNEL-positive cells (e, scale bar represents 50 μm) in mice with PBS, MSCs, or DMSCs treatment after ConA injection. n = 6~8 in c, d and n = 5 in e. f Survival of 25 mg/kg ConA-injected mice treated with PBS, MSCs, and DMSCs. n = 10. g, h The levels of IL-6, IFN-γ, and TNF-α in serum (g), and IL-10 and HGF in hepatic tissues (h) were determined by ELISA in each group. n = 3~5 in each group. Data are represented as mean ± SEM. ANOVA with Dunnett’s multiple comparison test was performed. Statistical significance is indicated by *p < 0.05, **p < 0.01, ***p < 0.001, ****p < 0.0001, compared with PBS group
Fig. 3
Fig. 3
MSCs and DMSCs attenuate tissue injury in mice. a Mice were intraperitoneally injected with 0.5 ml/kg CCl4, followed by intravenous injection with PBS, MSCs, or DMSCs. Representative macroscopic images of livers 24 h after CCl4 injection. b Representative images of liver histopathology with H&E staining 24 h after CCl4 administration. Scale bar represents 200 μm. c Quantification of serum AST and ALT after CCl4 injection in each group. n = 7 in each group. d Survival 5 ml/kg CCl4-injected mice treated with PBS, MSCs, and DMSCs. n = 10. e, f The levels of IL-6, IFN-γ, TNF-α in serum (e) and HGF in hepatic tissues (f) were determined by ELISA in each group. n = 3~5 in each group. g Mice were intratracheally instilled with 5 mg/kg LPS, followed by intravenous injection with PBS, MSCs, or DMSCs. The representative macroscopic images of the lungs 72 h after LPS administration were shown. h, i Representative images of lung histopathology with H&E staining (i) and histopathology score (h) 72 h after LPS administration. Scale bar represents 200 μm. j MSCs and DMSCs improved the behavior of mice in spinal cord injury model. Data are represented as mean ± SEM. *p < 0.05, **p < 0.01, ***p < 0.001, ****p < 0.0001, compared with PBS group in cf, h. **p < 0.01, ***p < 0.001, MSC compared with PBS group; #p < 0.05, ##p < 0.01, DMSC compared with PBS group in j
Fig. 4
Fig. 4. Transplanted MSCs undergo apoptosis within few hours and release phospholipid in vivo.
a Here, 1 × 106 GFP-MSCs were injected into mice by i.v. and the lung and liver tissues were taken for frozen section and stained for C-Cas 3 (red) and DAPI (blue) at 0.5, 2, and 4 h. Scale bar represents 50 μm (upper row) or 10 μm (lower panel). b Quantification of living MSC number in the lung and liver after GFP-MSCs injection. **p < 0.01, ***p < 0.001, compared with the 0.5 h group. c Mice were injected with 1 × 106 MSCs (containing 5 × 104 DMSCs), or 5 × 104 DMSCs through tail vein. Plasma lipid was isolated at 0.5 or 4 h, and the lipid levels were detected by Nano high-resolution liquid mass analyzer. PCA plot on all samples using the normalized lipid levels of total lipids. d, e Fold change of total PS (d), PS (18:0/16:1)-H, PS (18:0/18:1)-H, PS (18:0/22:6)-H, PS (18:0/22:5)-H, PS (37:2)-H, and PS (39:1)-H (e) abundance after injection of MSCs and DMSCs at 0.5 and 4 h. Data are represented relative to the Control group. *p < 0.05, **p < 0.01, ***p < 0.001, compared with the Control group. ce Every dot represents one individual animal. Data are represented as mean ± SEM. n = 4 in each group in be. ANOVA with Dunnett’s multiple comparison test was performed. C-Cas 3, cleaved Caspase 3
Fig. 5
Fig. 5. PSLs ameliorate ConA-induced ALI and LPS-induced lung injury.
a Mice were intravenously injected with 12 mg/kg ConA, followed by treatment with PBS, PCLs, or PSLs. Representative images of liver histopathology with H&E staining in each group. Scale bar represents 200 μm. bd Quantitative analysis of necrosis area (b), TUNEL-positive cells (c), and serum ALT and AST levels (d) in mice with PBS, PCLs, or PSLs treatment. n = 5. e Survival of 25 mg/kg ConA-injected mice treated with PBS, PCLs, and PSLs. n = 10. f, g The levels of IL-6, IFN-γ, and TNF-α in serum (f) and IL-10, HGF in hepatic tissues (g) were determined by ELISA. n = 3~5 in each group. h Representative images of lung histopathology 72 h after LPS administration. Scale bar represents 200 μm. i Histopathology score of lung sections in each group. n = 5 in each group. Data are represented as mean ± SEM. *p < 0.05, **p < 0.01, ***p < 0.001
Fig. 6
Fig. 6
MSCs, DMSCs, and PSLs rescued ConA-induced liver injury via MerTK signaling. a Representative images of liver histopathology with H&E staining in ConA-injected mice treated with Vehicle and TAM receptor inhibitor LDC1267. Scale bar represents 200 μm. b Quantitative analysis of necrotic area in the liver of PBS-, MSCs-, DMSCs-, or PSLs-treated mice. c Representative H&E staining analysis of liver sections for necrosis area, inflammatory cell infiltration in WT or MerTK−/− mice after PBS, MSCs, DMSCs, or PSLs treatment. Scale bar represents 200 μm. df Quantitative analysis of necrosis area (d), serum ALT and AST levels (e), and TUNEL-positive cells (f) in WT or MerTK−/− mice with PBS, MSCs, DMSCs, or PSLs treatment. n = 4 in each group in af. g Survival of ConA-injected MerTK−/− mice treated with PBS, MSCs, DMSCs, or PSLs. n = 4 in each group. h Protein levels of p-p38-MAPK, t-p38-MAPK, p-NF-κB p65, t-NF-κB p65, and IL-10 in each group were determined using western blotting. Data are represented as mean ± SEM. *p < 0.05, **p < 0.01, ***p < 0.001
Fig. 7
Fig. 7
MSCs, DMSCs, and PSLs recruit Ly-6Chigh MoMF and reduce inflammatory cell infiltration partly through CCR2. a Flow cytometric analyses of active NK cells (CD45+CD3NK1.1+CD69+), neutrophils (CD45+CD11b+Ly-6G+), Ly-6Chigh MoMF (CD45+CD11b+Ly-6GF4/80lowLy-6Chigh), and total number of Ly-6Chigh IL-10 producing MoMF in the livers of WT and MerTK−/− mice 12 h after ConA injection followed by PBS, MSCs, DMSCs, and PSLs treatment. n = 3 in each group. b Representative H&E staining analysis of liver sections in WT or CCR2−/− mice after PBS, MSCs, DMSCs, or PSLs treatment. Scale bar represents 200 μm. c, d Quantitative analysis of necrotic area (c) and TUNEL-positive cells (d) in liver sections of WT or CCR2−/− mice with PBS, MSCs, DMSCs, or PSLs treatment. n = 4 in each group. e Quantitative analysis of the proportion of active NK cells, neutrophils, and Ly-6Chigh MoMF, and the total number of Ly-6Chigh IL-10 producing MoMF in the livers of CCR2−/− mice by flow cytometry. n = 3 in each group. Data are represented as mean ± SEM. *p < 0.05, **p < 0.01, ***p < 0.001, compared with PBS group in WT mice. #p < 0.05, ##p < 0.01, compared with each other

Comment in

References

    1. Hofmann M, et al. Monitoring of bone marrow cell homing into the infarcted human myocardium. Circulation. 2005;111:2198–2202. - PubMed
    1. Lee KC, Lin HC, Huang YH, Hung SC. Allo-transplantation of mesenchymal stem cells attenuates hepatic injury through IL1Ra dependent macrophage switch in a mouse model of liver disease. J. Hepatol. 2015;63:1405–1412. - PubMed
    1. Lee JS, et al. A long-term follow-up study of intravenous autologous mesenchymal stem cell transplantation in patients with ischemic stroke. Stem Cells. 2010;28:1099–1106. - PubMed
    1. Banas A, et al. IFATS collection: in vivo therapeutic potential of human adipose tissue mesenchymal stem cells after transplantation into mice with liver injury. Stem Cells. 2008;26:2705–2712. - PubMed
    1. Islam D, et al. Identification and modulation of microenvironment is crucial for effective mesenchymal stromal cell therapy in acute lung injury. Am. J. Respir. Crit. Care Med. 2019;199:1214–1224. - PubMed

Publication types

Substances