. 2021 Jul 14;6(1):268.
doi: 10.1038/s41392-021-00677-2.

CD147 receptor is essential for TFF3-mediated signaling regulating colorectal cancer progression

Affiliations

CD147 receptor is essential for TFF3-mediated signaling regulating colorectal cancer progression

Hong-Yong Cui et al. Signal Transduct Target Ther. .

Abstract

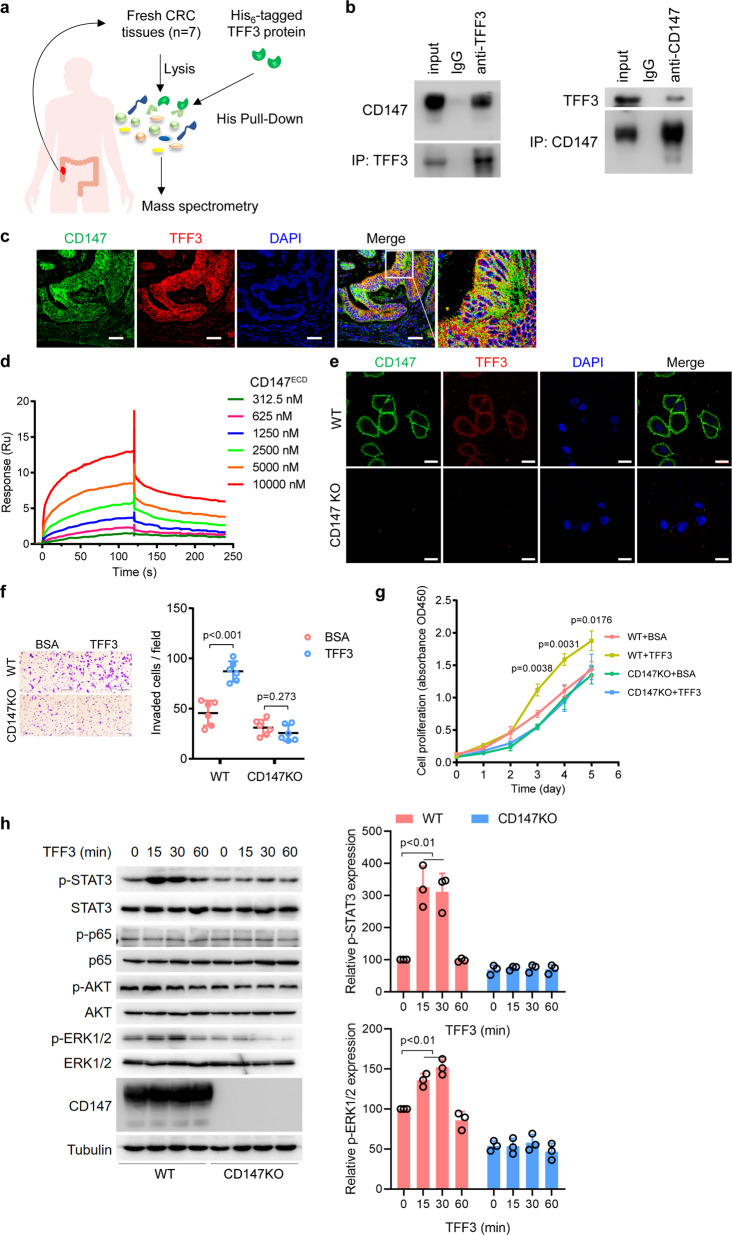
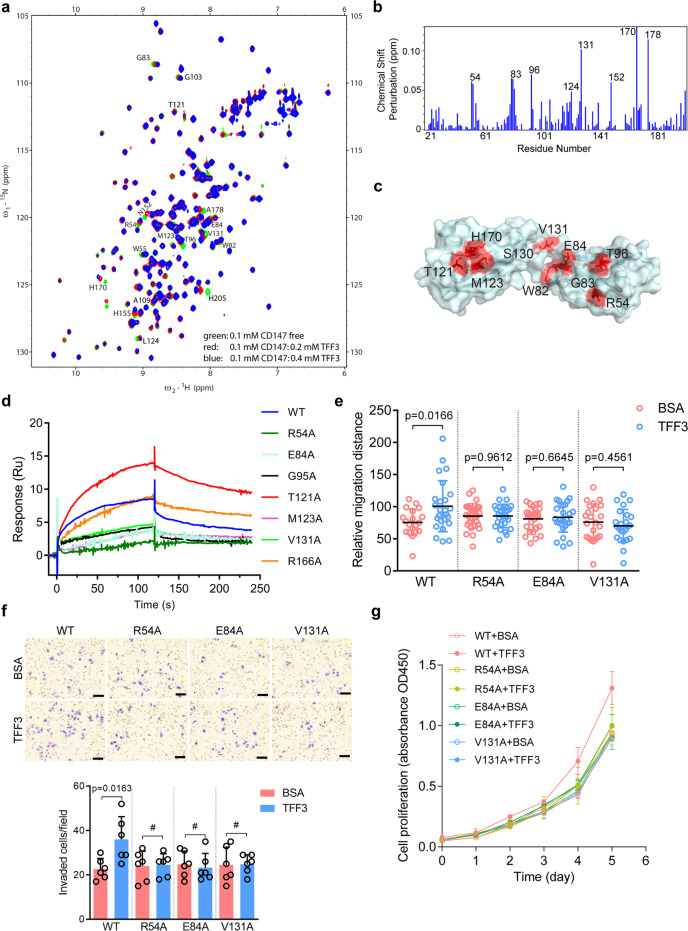
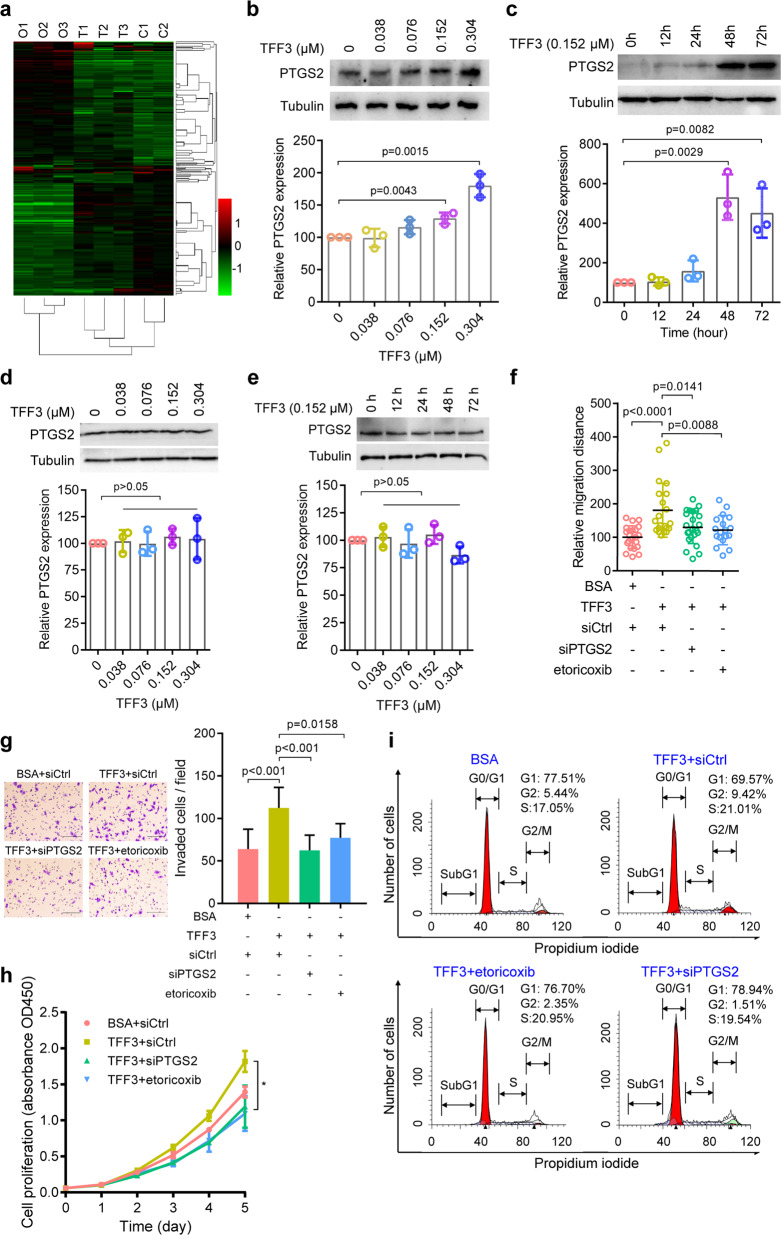
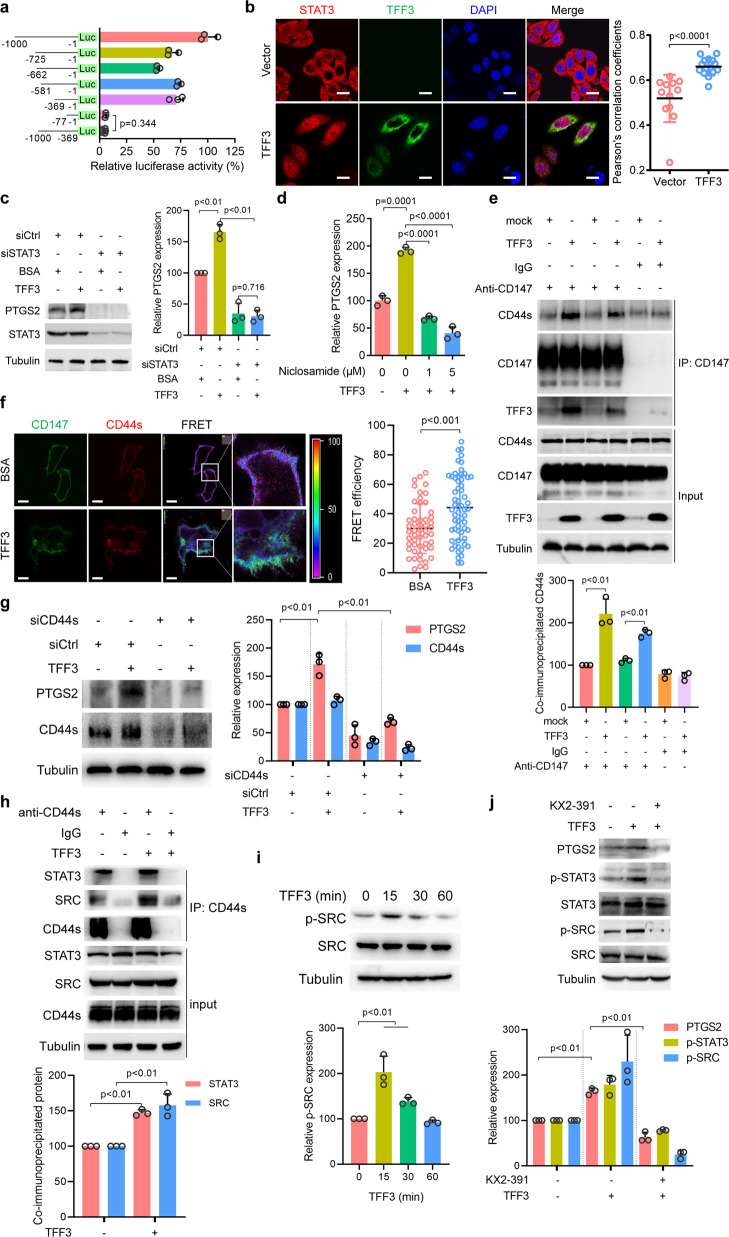
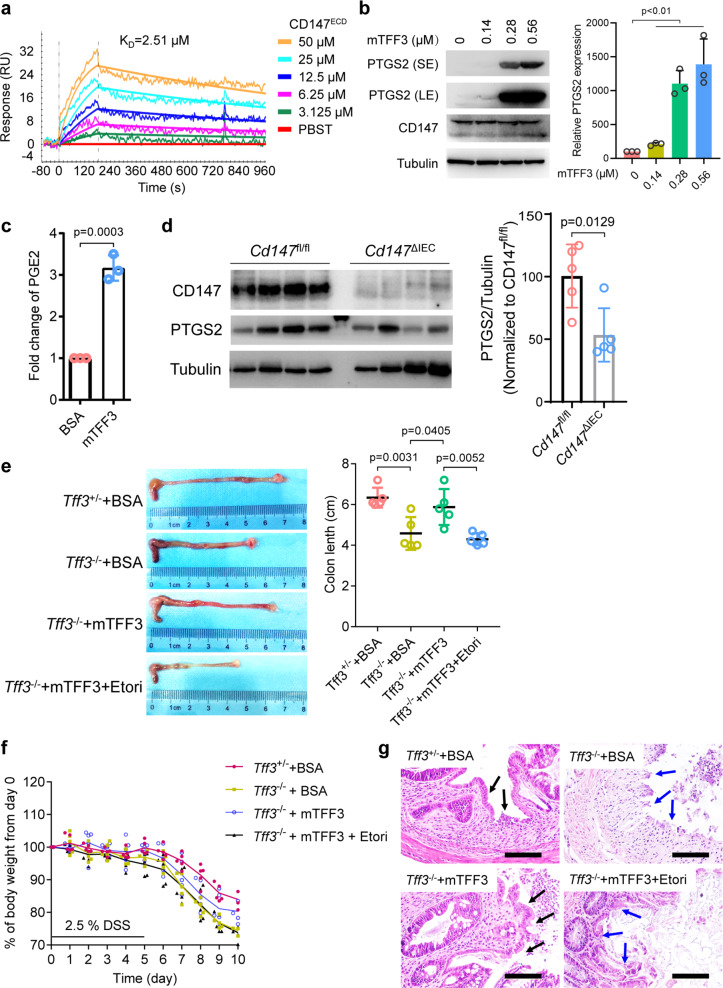
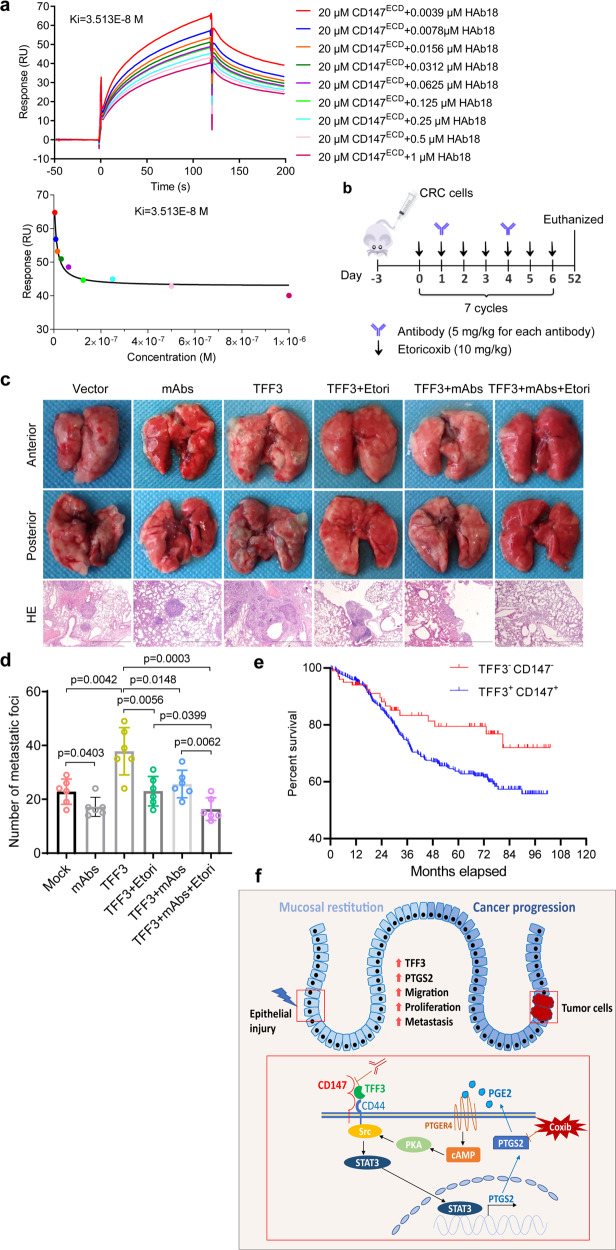
Major gaps in understanding the molecular mechanisms of colorectal cancer (CRC) progression and intestinal mucosal repair have hampered therapeutic development for gastrointestinal disorders. Trefoil factor 3 (TFF3) has been reported to be involved in CRC progression and intestinal mucosal repair; however, how TFF3 drives tumors to become more aggressive or metastatic and how TFF3 promotes intestinal mucosal repair are still poorly understood. Here, we found that the upregulated TFF3 in CRC predicted a worse overall survival rate. TFF3 deficiency impaired mucosal restitution and adenocarcinogenesis. CD147, a membrane protein, was identified as a binding partner for TFF3. Via binding to CD147, TFF3 enhanced CD147-CD44s interaction, resulting in signal transducer and activator of transcription 3 (STAT3) activation and prostaglandin G/H synthase 2 (PTGS2) expression, which were indispensable for TFF3-induced migration, proliferation, and invasion. PTGS2-derived PGE2 bound to prostaglandin E2 receptor EP4 subtype (PTGER4) and contributed to TFF3-stimulated CRC progression. Solution NMR studies of the TFF3-CD147 interaction revealed the key residues critical for TFF3 binding and the induction of PTGS2 expression. The ability of TFF3 to enhance mucosal restitution was weakened by a PTGS2 inhibitor. Blockade of TFF3-CD147 signaling using competitive inhibitory antibodies or a PTGS2 inhibitor reduced CRC lung metastasis in mice. Our findings bring strong evidence that CD147 is a novel receptor for TFF3 and PTGS2 signaling is critical for TFF3-induced mucosal restitution and CRC progression, which widens and deepens the understanding of the molecular function of trefoil factors.


Conflict of interest statement

The authors declare no competing interests.

Figures

Fig. 1
Fig. 1. CD147 is identified as a TFF3-binding protein and is indispensable for promoting cancer progression and activating downstream signaling by TFF3.
a Schematic representation illustrating the strategy of using His6-tagged TFF3 to capture interacting proteins from CRC tissues and of characterizing the interacting partner via LC-MS/MS. b Western blotting analyses of endogenous TFF3 co-IP with CD147 from CRC tissues. IgG was used as a control antibody. c Representative images of immunofluorescence staining of endogenous TFF3 and CD147 in CRC tissues. Scale bar, 50 μm. d Biacore diagram of human TFF3 protein bound to CD147ECD. The KD values were calculated by the Biacore T200 evaluation software. e Representative confocal images of HCT-8 and HCT-8 CD147KO cells incubated with Alexa Fluor™ 555-labeled TFF3. Scale bar, 10 μm. f Representative images of HCT-8 and HCT-8 CD147KO cells invading through matrigel-coated transwell inserts toward serum for 24 h. Cells were treated with 0.152 μM of TFF3 or BSA. Scale bar, 50 μm. The graph shows the average number of invaded cells per field. g Proliferation curve of HCT-8 and HCT-8 CD147KO cells determined by CCK-8 assays. Cells were treated with 0.152 μM of TFF3 or BSA. Significance relative to the WT+BSA group was determined by a two-tailed Student’s t-test. h Western blotting analyses of the indicated proteins in HCT-8 or HCT-8 CD147KO cells treated with 0.152 μM of TFF3. Graphs show semi-quantitative analysis of relative p-STAT3 and p-ERK1/2 expression. The p-values in fh were determined by using two-tailed Student’s t-test
Fig. 2
Fig. 2. Defining the binding site of TFF3 on CD147 and the key residues.
a 15N-1H-HSQC spectra for 0.1 mM CD147ECD were generated in the presence of 0.2 mM (red) or 0.4 mM (blue) TFF3, or the absence of TFF3 (green); the spectra were then superimposed. Residues that show CSPs due to TFF3 binding are labeled. b Plot of chemical shift perturbations between CD147ECD/TFF3 (ratio 1:4) and free CD147ECD. Residues with significant CSPs [Δδ(N–H) > 0.048 ppm] were labeled. c TFF3-induced CSPs mapped onto the 3D structure of human CD147ECD (PDB ID: 3B5H, residues 22–203). The colors in the space-filling model correspond to the amplitude of the observed CSPs [red: Δδ(N–H) > 0.035 ppm]. d Biacore diagram of human TFF3 protein bound to CD147ECD mutants. e Quantification of the migration ability of HCT-8 CD147KO cells transfected with wild-type (WT), R54A, E84A, or V131A CD147 in the presence of 0.152 μM of TFF3 or BSA treatment. f Representative images of HCT-8 CD147KO cells invading through matrigel-coated transwell inserts towards serum for 24 h. Cells transfected with WT, R54A, E84A, or V131A CD147 were treated with 0.152 μM of TFF3 or BSA. Scale bar, 50 μm. The graph shows the average number of invaded cells per field. The p-values in ef were determined by using a two-tailed Student’s t-test (#p > 0.05). g Proliferation curve of HCT-8 CD147KO cells determined by CCK-8 assays. Cells transfected with WT, R54A, E84A, or V131A CD147 were treated with 0.152 μM of TFF3 or BSA
Fig. 3
Fig. 3. TFF3 promotes migration, invasion, and proliferation via PTGS2.
a Heatmap of differentially expressed proteins in control (C1–C2), TFF3-treated (T1–T3), and TFF3-overexpressing (O1–O3) HCT-8 cells. bc Western blotting analyses of PTGS2 expression in SW480 cells treated with increasing amounts of TFF3 for 48 h (b) or following increasing periods of TFF3 treatment (c). de Western blotting analyses of PTGS2 expression in HCT-8 CD147KO cells treated with increasing amounts of TFF3 for 48 h (d) or following increasing periods of TFF3 treatment (e). Graphs in be show semi-quantitative analyses of relative PTGS2 expression. f Quantification of cell migration ability of HCT-8 cells treated with 0.152 μM of TFF3 alone or in combination with either siPTGS2 transfection or the PTGS2 inhibitor etoricoxib. g Representative images of HCT-8 cells invading through matrigel-coated transwell inserts toward serum for 24 h. Cells were treated with 0.152 μM of TFF3 alone or in combination with either siPTGS2 transfection or the PTGS2 inhibitor etoricoxib. Scale bar, 50 μm. The graph shows the average number of invaded cells per field. The p-values in (bg) were determined by using a two-tailed Student’s t-test. h Proliferation curve of HCT116 cells determined by CCK-8 assay. Cells were treated with 0.152 μM of TFF3 alone or in combination with either siPTGS2 transfection or the PTGS2 inhibitor etoricoxib. Significance relative to the TFF3 treatment group was determined by using a two-tailed Student’s t-test (*p < 0.05). i Flow cytometry analysis of cell cycle progression in HCT-8 cells treated with 0.152 μM of TFF3 alone or in combination with either siPTGS2 transfection or the PTGS2 inhibitor etoricoxib
Fig. 4
Fig. 4. TFF3 induces PTGS2 expression via promoting the interaction between CD147 and CD44s.
a Schematic representation of the PTGS2 promoter-reporter constructs. HCT-8 cells were transfected with the indicated constructs. b Representative images of immunofluorescence staining of endogenous STAT3 in HCT-8 cells transfected with control plasmid or TFF3. Scale bar, 10 μm. The graph shows Pearson’s correlation coefficients between STAT3 and DAPI. c Western blotting analyses of the indicated proteins in HCT-8 cells treated with 0.152 μM of TFF3 alone or in combination with either control siRNA (siCtrl) or siRNA targeting STAT3 (siSTAT3). The graph shows a semi-quantitative analysis of relative PTGS2 expression. d qPCR for PTGS2 normalized to GAPDH expression in HCT-8 cells treated with 0.152 μM of TFF3 alone or in combination with niclosamide. e Western blotting analyses of endogenous CD147 co-immunoprecipitated with endogenous CD44s in the presence or absence of 0.152 μM of TFF3. IgG was used as a control antibody for immunoprecipitation. The graph shows a semi-quantitative analysis of co-immunoprecipitated CD44s. f The interaction between the indicated constructs in the presence or absence of TFF3 was analyzed with fluorescence resonance energy transfer (FRET). The color bar represents the FRET ratio. Scale bar, 10 μm. The graph shows FRET efficiency. g Western blotting analyses of the indicated proteins in HCT-8 cells treated with 0.152 μM of TFF3 alone or in combination with either siRNA targeting CD44s (siCD44s) or control siRNA (siCtrl). The graph shows a semi-quantitative analysis of PTGS2 and CD44s expression. h Western blotting analyses of endogenous CD44s co-IP with endogenous STAT3 and SRC in the presence or absence of 0.152 μM of TFF3. IgG was used as a control antibody for immunoprecipitation. The graph shows a semi-quantitative analysis of co-immunoprecipitated STAT3 and SRC. i Western blotting analyses of SRC activation in HCT116 cells after increasing periods of 0.152 μM of TFF3 treatment. The graph shows a semi-quantitative analysis of p-SRC expression. j Western blotting analyses of the indicated proteins in HCT-8 cells treated with 0.152 μM of TFF3 alone or in combination with the SRC inhibitor KX2-391. The graph shows a semi-quantitative analysis of PTGS2, p-STAT3, and p-SRC expression. The p-values in aj were determined by two-tailed Student’s t-test
Fig. 5
Fig. 5. TFF3 promotes mucosal restitution via CD147-PTGS2-PGE2 signaling.
a Biophysical analysis of the mTFF3-mCD147ECD interaction using SPR. b Western blotting analysis of the indicated proteins in mouse primary IECs treated with increasing amounts of mTFF3. SE, short exposure, 20 s; LE, long exposure, 1 min. c Quantification of PGE2 in the culture supernatant of mouse primary IECs treated with 0.28 μM of BSA or mTFF3. d Western blotting analyses of the indicated proteins in colonic tissue of the floxed mice (Cd147fl/fl) or the intestinal epithelial-specific CD147 knockout mice (Cd147ΔIEC). e Representative macroscopic views of colons from mice of the indicated genotypes treated with BSA or mTFF3 (7.7 μM protein/20 g weight) alone or in combination with etoricoxib (Etori, 0.2 mg/20 g weight). The graph shows the average length of the colon. The p-values in be were determined by using a two-tailed Student’s t-test. f Weight loss (expressed as a percentage of the initial weight) over time (n = 5). g Representative areas of healing ulceration. Black arrow, healing, and re-epithelialization are apparent; blue arrow, healing is not apparent
Fig. 6
Fig. 6. Blockage of TFF3-CD147 signaling reduces metastasis of CRC cells.
a Biophysical analysis of the TFF3-CD147ECD interaction in the presence of the monoclonal antibody HAb18 using SPR. The indicated concentrations of HAb18 and purified CD147ECD were injected over immobilized TFF3. b Schematic representation of tail-vein injection of HCT-8–TFF3 or HCT-8-vector cells, as well as the schedule of PTGS2 inhibitor etoricoxib (Etori) and anti-CD147ECD antibody administration in the nude mouse model of CRC metastasis. After injection of HCT-8-TFF3 cells, the mice were randomized to 4 treatment groups for 7 weeks: placebo, etoricoxib only, monoclonal antibodies only, and a combination of etoricoxib and monoclonal antibodies. After injection of HCT-8-vector cells, the mice were randomized to 2 groups for 7 weeks: placebo and monoclonal antibodies only (n = 6 in each group). c Representative images of lung metastases and HE staining of metastatic tumors that developed in the mouse model in b. Scale bar, 2 mm. d The lung metastases from each mouse were counted, and data are presented as a scatter diagram. The p-values were determined by using a two-tailed Student’s t-test. e Cumulative overall survival of patients with double positive or double negative tumor TFF3 and CD147 expression. f Model depicting the proposed mechanism mediating mucosal restitution and CRC progression

Similar articles

Cited by

References

    1. Podolsky DK, et al. Identification of human intestinal trefoil factor. Goblet cell-specific expression of a peptide targeted for apical secretion. J. Biol. Chem. 1993;268:6694–6702. doi: 10.1016/S0021-9258(18)53305-6. - DOI - PubMed
    1. Wright NA, et al. Epidermal growth factor (EGF/URO) induces expression of regulatory peptides in damaged human gastrointestinal tissues. J. Pathol. 1990;162:279–284. doi: 10.1002/path.1711620402. - DOI - PubMed
    1. Braga Emidio N, Hoffmann W, Brierley SM, Muttenthaler M. Trefoil factor family: unresolved questions and clinical perspectives. Trends Biochem. Sci. 2019;44:387–390. doi: 10.1016/j.tibs.2019.01.004. - DOI - PMC - PubMed
    1. Yio X, et al. Trefoil factor family-3 is associated with aggressive behavior of colon cancer cells. Clin. Exp. Metastasis. 2005;22:157–165. doi: 10.1007/s10585-005-6615-z. - DOI - PubMed
    1. Yusufu A, et al. TFF3 and TFF1 expression levels are elevated in colorectal cancer and promote the malignant behavior of colon cancer by activating the EMT process. Int. J. Oncol. 2019;55:789–804. - PMC - PubMed

Publication types

MeSH terms