. 2021 Jul 14;12(1):4303.
doi: 10.1038/s41467-021-24632-5.

Intracellular lipid droplet accumulation occurs early following viral infection and is required for an efficient interferon response

Affiliations

Intracellular lipid droplet accumulation occurs early following viral infection and is required for an efficient interferon response

E A Monson et al. Nat Commun. .

Abstract

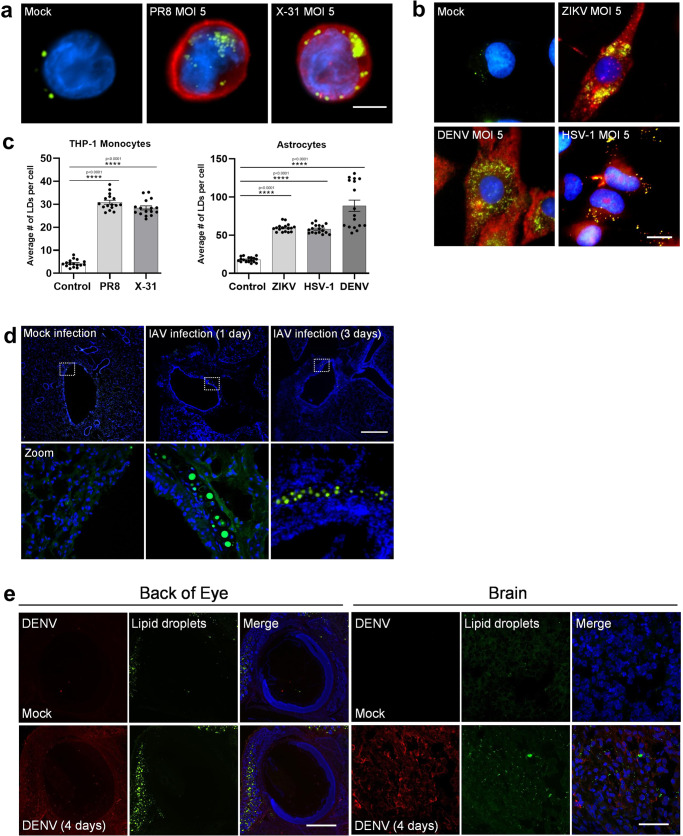
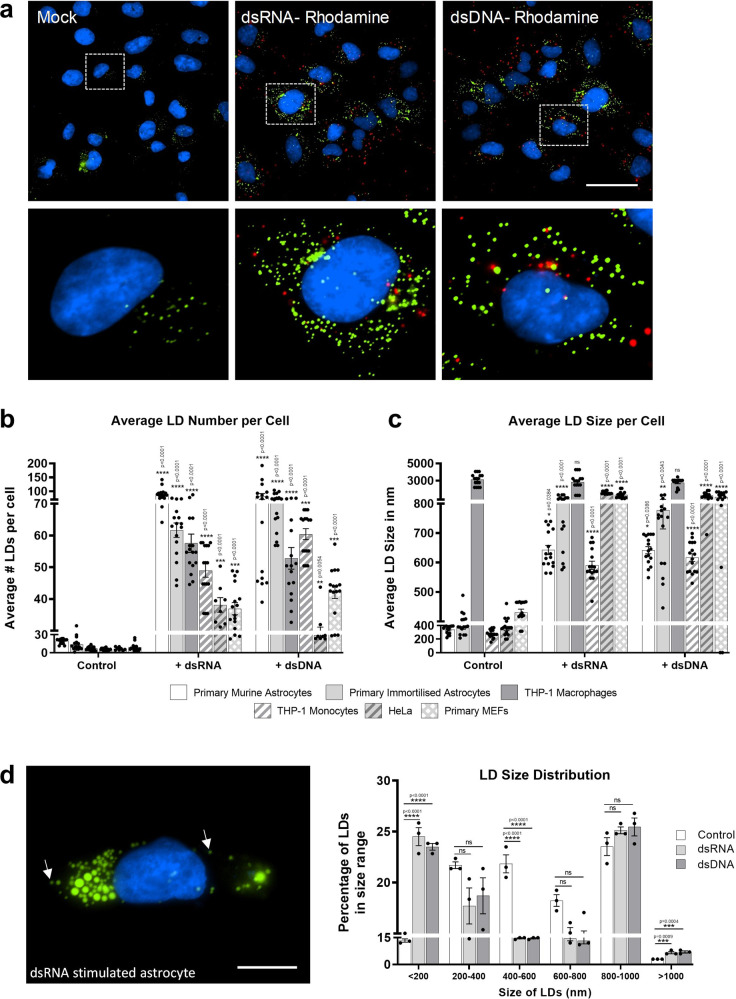
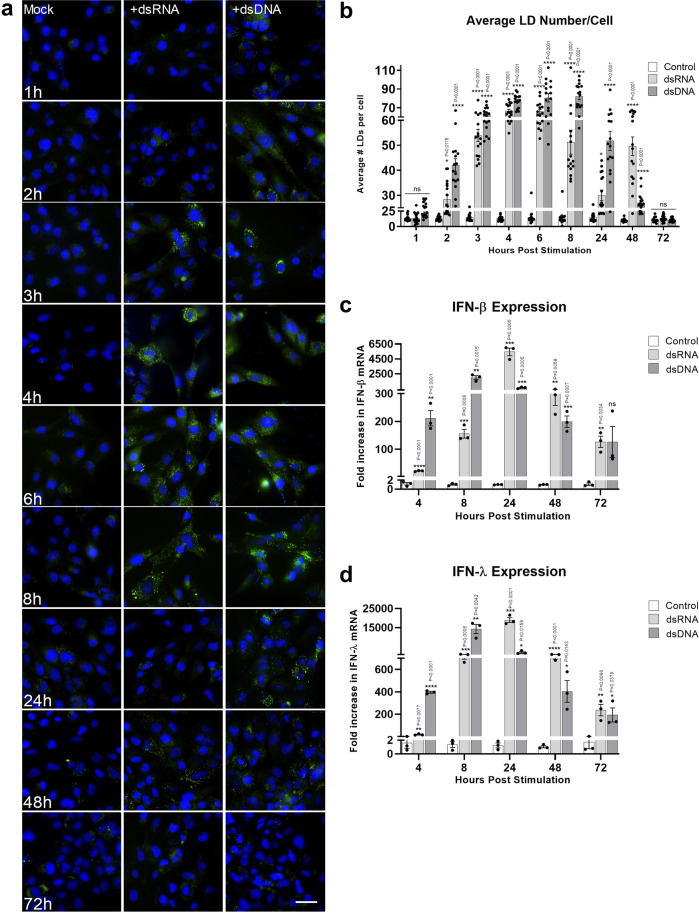
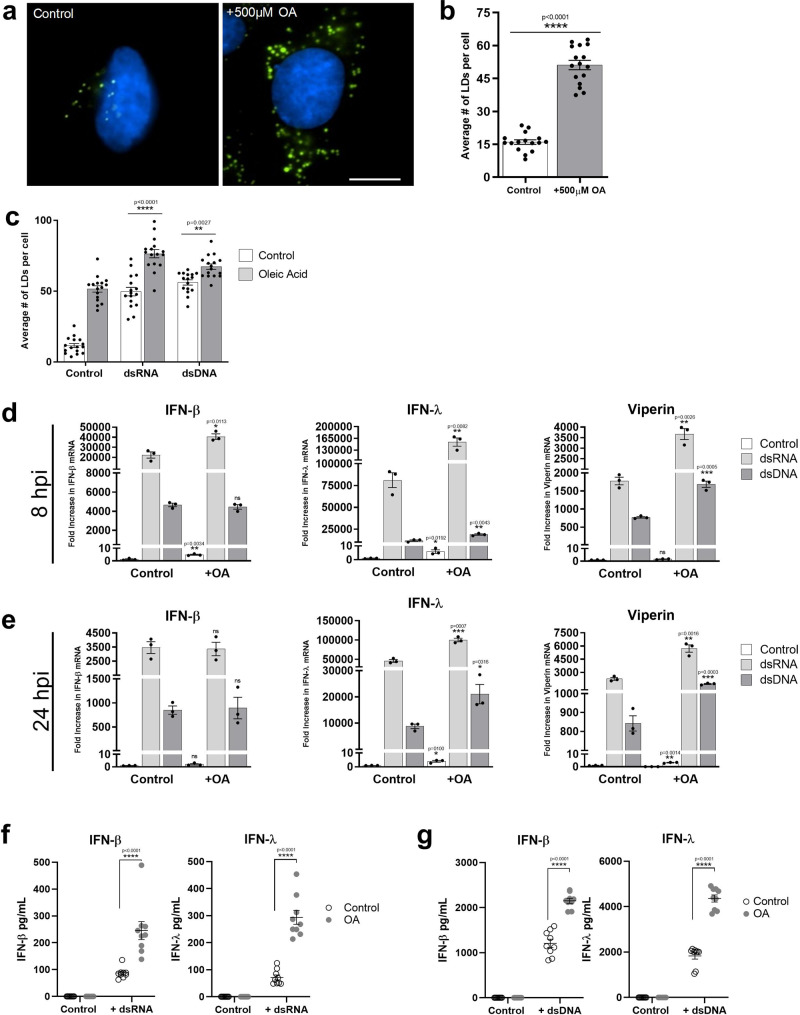
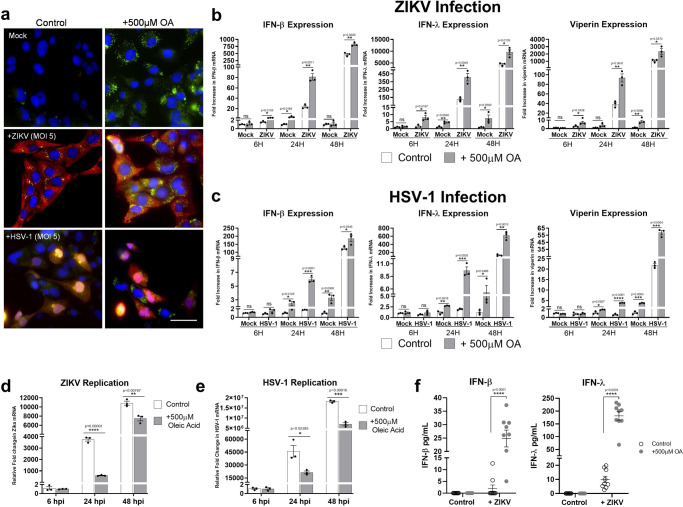
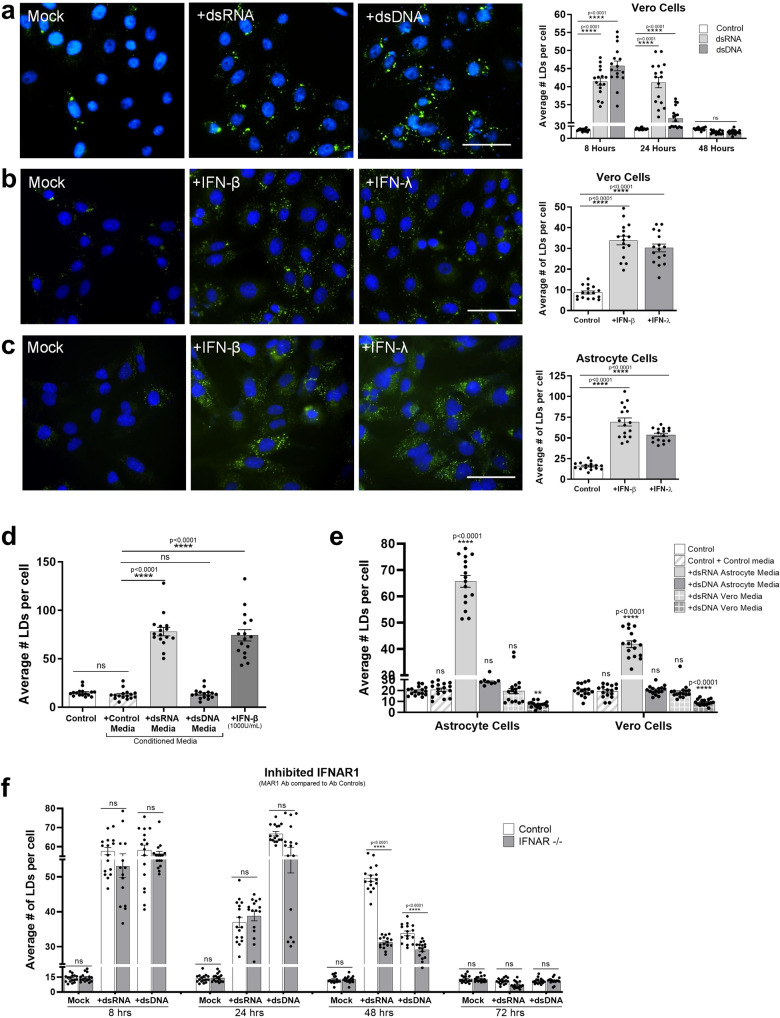
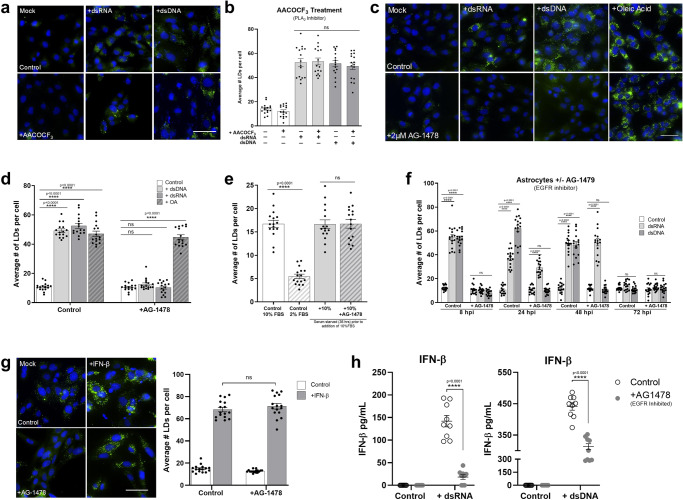
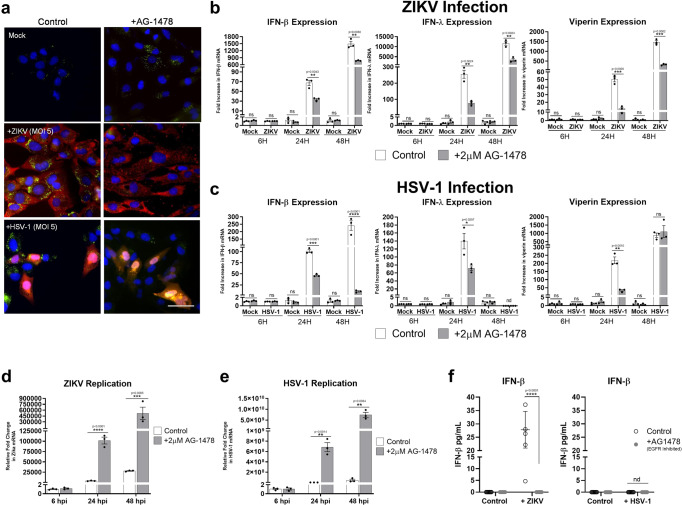
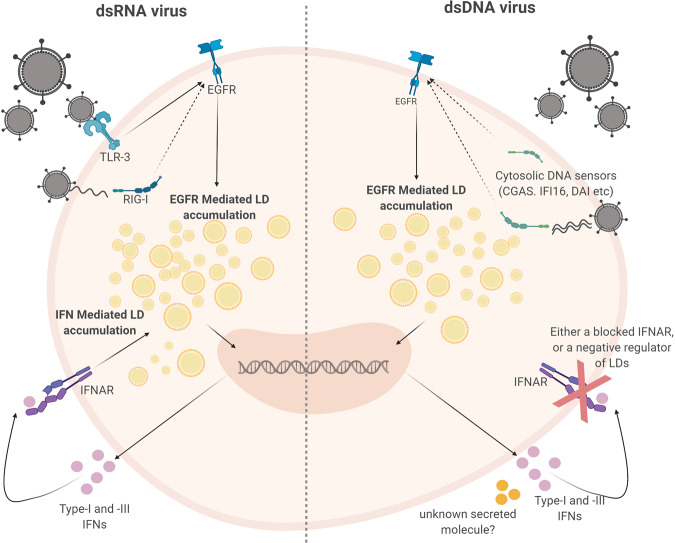
Lipid droplets (LDs) are increasingly recognized as critical organelles in signalling events, transient protein sequestration and inter-organelle interactions. However, the role LDs play in antiviral innate immune pathways remains unknown. Here we demonstrate that induction of LDs occurs as early as 2 h post-viral infection, is transient and returns to basal levels by 72 h. This phenomenon occurs following viral infections, both in vitro and in vivo. Virally driven in vitro LD induction is type-I interferon (IFN) independent, and dependent on Epidermal Growth Factor Receptor (EGFR) engagement, offering an alternate mechanism of LD induction in comparison to our traditional understanding of their biogenesis. Additionally, LD induction corresponds with enhanced cellular type-I and -III IFN production in infected cells, with enhanced LD accumulation decreasing viral replication of both Herpes Simplex virus 1 (HSV-1) and Zika virus (ZIKV). Here, we demonstrate, that LDs play vital roles in facilitating the magnitude of the early antiviral immune response specifically through the enhanced modulation of IFN following viral infection, and control of viral replication. By identifying LDs as a critical signalling organelle, this data represents a paradigm shift in our understanding of the molecular mechanisms which coordinate an effective antiviral response.


Conflict of interest statement

The authors declare no competing interests.

Figures

Fig. 1
Fig. 1. Lipid Droplets accumulate in response to IAV, ZIKV and HSV-1 infections.
a Human THP-1 monocytes were infected with two different strains of influenza- PR8 and X-31 at an MOI 5 for 8 h, Scale bars, 50 μm. b Primary immortalised astrocyte cells were infected with either the ZIKV (MR766 strain), DENV (DENV2) or HSV-1 (KOS strain) at MOI 5 for 8 h. All cells were stained with Bodipy (493/503) to visualise LDs (green) and DAPI to visualise the cell nuclei (blue). IAV was detected with a αNS2 antibody (1:1000), ZIKV and DENV RNA was detected using an anti-3G1.1 and 2G4 dsRNA antibodies (in combination, used neat) and HSV-1 was detected using the anti-HSV-1 antibody (Abcam, ab9533), all shown in red staining. Scale bars, 50 μm. c LD numbers were analysed using ImageJ analysis software. Error bars, mean values ± SEM, P values were determined by unpaired two-tailed Student’s t test with a Holm-Sidak correction for multiple comparisons (n = 2 biological replicates). Stimulated cells were statistically compared with their respective mock controls. d C57BL/6 mice were either mock infected or infected with 104 PFU of IAV for 24 or 72 h prior to removal of both lung lobes for immunofluorescence analysis of LDs via Bodipy (493/503) staining (green). DAPI was utilised to visualise the cell nuclei (blue), scale bars, 500 μm. e 1-day old BALB/c pups were either mock infected or infected with 800 PFU of DENV-2 (MON601) for 2 or 4 days prior to removal of pup heads for immunofluorescence analysis of LDs via Bodipy (493/503) staining (green) in the brain and eye. DAPI was utilised to visualise the cell nuclei (blue) and DENV RNA was detected using anti-3G1.1 and 2G4 dsRNA antibodies (in combination). Scale bars, 500 μm, n = 3 mice. Source data are provided as a Source Data file.
Fig. 2
Fig. 2. Detection of intracellular dsRNA and dsDNA initiates accumulation of LDs in multiple cell types.
a Primary immortalised human astrocyte cells stimulated with dsRNA and dsDNA tagged with Rhodamine (red) for 8 h and stained with Bodipy (493/503) to visualise LDs (green) and DAPI to visualise the cell nuclei (blue). Cells were imaged on a Nikon TiE microscope. Original magnification is 60X. Scale bar, 50 μm. b Average number of LDs per cell and (c) average LD sizes (diameters) were analysed from greater than 200 cells in a range of cell types, using ImageJ analysis software (n = 2 biological replicates). d LD size distribution in primary immortalised astrocyte cells stimulated with either dsDNA or dsRNA for 8 h. Image represents a single astrocyte cell following dsRNA stimulation. Cells were stained with Bodipy (493/503) to visualise LDs (green) and DAPI to visualise the cell nuclei (blue) and LD size distributions were analysed on ImageJ analysis software. Scale bar, 15 μm. In (bd) error bars, mean values ± SEM, P values were determined by unpaired two-tailed Student’s t test with a Holm-Sidak correction for multiple comparisons (greater than 300 cells; n = 3 biological replicates). Stimulated cells were statistically compared with their respective mock controls, ns = not significant. Source data are provided as a Source Data file.
Fig. 3
Fig. 3. Lipid Droplet accumulation is transient following detection of intracellular nucleic acids.
a Primary immortalised astrocyte cells were stimulated with dsRNA and dsDNA and were fixed at regular time points until 72 h post-stimulation. Cells were stained with Bodipy (493/503) to visualise LDs (green) and DAPI to visualise the cell nuclei (blue). Scale bar, 50 μm. Images are a representation of n = 3 independent experiments. b Average number of LDs per cell were analysed from all time points using ImageJ analysis software (n > 300 cells; n = 3 separate biological replicates). c, d Primary immortalised astrocyte cells were stimulated with dsRNA and dsDNA and RTq-PCR was utilised to quantify IFN-β and IFN- λ mRNA up to 72 h post-stimulation. In (bd) error bars, mean values ± SEM, P values were determined by unpaired two-tailed Student’s t test with a Holm-Sidak correction for multiple comparisons (greater than 300 cells; n = 3 biological replicates). Stimulated cells were statistically compared with their respective mock controls, ns = not significant. Source data are provided as a Source Data file.
Fig. 4
Fig. 4. Increasing cellular LD numbers acts to enhance the type I and III IFN response to dsRNA and dsDNA.
a, b Primary immortalised astrocyte cells were treated with 500 μM oleic acid (OA) for 16 h. Cells were stained with Bodipy (493/503) to visualise LDs (green) and DAPI to visualise the cell nuclei (blue) and LDs numbers were assessed with ImageJ analysis software (greater than 200 cells, n = 2) Bar, 15 μm. c Primary immortalised astrocyte cells were treated with 500 μM oleic acid for 16 h prior to stimulation with dsDNA or dsRNA for 8 h LD numbers were analysed. RT-qPCR was performed to evaluate IFN-β, IFN-λ and viperin mRNA expression at (d) 8 h or (e) 24 h post stimulation. All results are in comparison to RPLPO expression. In (be) error bars, mean values ± SEM, P values were determined by unpaired two-tailed Student’s t test with a Holm-Sidak correction for multiple comparisons for 2 or more groups (greater than 300 cells; n = 3 biological replicates). Stimulated cells were statistically compared with their respective mock controls, ns = not significant. f, g IFN protein levels in the media from the previous experiments at 16 h post-infection were analysed via ELISA for IFN- β and IFN-λ protein. Error bars, mean values ± SEM, P values were determined by two-way ANOVA post-hoc pairwise comparisons with Bonferroni correction (n = 3 biological replicates). Source data are provided as a Source Data file.
Fig. 5
Fig. 5. Increasing cellular LD numbers enhances IFN responses to restrict ZIKV and HSV-1 viral replication.
a Primary immortalised astrocyte cells were treated with 500 μM oleic acid (OA) for 16 h prior to infection with ZIKV (MR766 strain) at MOI 0.1 or HSV-1 (KOS strain) at MOI 0.01 for 8 h. Cells were stained with Bodipy (493/503) to visualise LDs (green) and DAPI to visualise the cell nuclei (blue). ZIKV RNA was detected using an anti-3G1.1 and 2G4 dsRNA antibodies and HSV-1 was detected using the anti-HSV-1 antibody (Abcam, ab9533), both viral proteins shown with red staining. Images are a representation of n = 3 independent experiments. RT-qPCR was utilised to evaluate IFN-β, IFN-λ and viperin mRNA expression at 8, 24 and 48 hpi post (b) ZIKV or (c) HSV-1 infection (MOI 0.1). Primary immortalised astrocyte cells were treated with 500 μM oleic acid for 16 h prior to infection with (d) ZIKV at a MOI 0.1 or (e) HSV-1 at an MOI 0.1, and RT-qPCR was utilised to evaluate viral replication at 6, 24 and 48 hpi. In (b–e) error bars, mean values ± SEM, P values were determined by unpaired two-tailed Student’s t test with a Holm-Sidak correction for multiple comparisons for 2 or more groups (greater than 300 cells; n = 3 biological replicates). Stimulated cells were statistically compared with their respective mock controls, ns = not significant. f At 16 h post-infection secreted IFN protein levels from these experiments were analysed with ELISA plates for IFN- β and IFN-λ protein. Error bars, mean values ± SEM, P values were determined by two-way ANOVA post-hoc pairwise comparisons with Bonferroni correction (n = 3 biological replicates). Source data are provided as a Source Data file.
Fig. 6
Fig. 6. Lipid droplet accumulation following intracellular nucleic acid detection is type I IFN Independent.
a Vero cells were stimulated with dsRNA and dsDNA and were stained with Bodipy (493/503) to visualise LDs (green) and DAPI to visualise the cell nuclei (blue) at 8 h post-stimulation, bars, 50 μm. Cells were fixed at 8, 24 and 48 h post stimulation and analysed for LD numbers using ImageJ analysis software (greater than 200 cells (n = 2)) (b) Vero cells were stimulated with either IFN- β or IFN-λ for 8 h prior to fixation and staining with Bodipy (493/503) to visualise LDs (green) and DAPI to visualise the cell nuclei (blue), bars, 50 μm. LD numbers were analysed using ImageJ analysis software (greater than 200 cells (n = 2)). c Primary immortalised astrocyte cells were stimulated with either IFN- β or IFN-λ for 8 h prior to fixation and staining, and LD analysis, all performed as above (greater than 200 cells (n = 2)). d Astrocyte cells were treated with pre-conditioned media from prior dsRNA or dsDNA stimulated astrocyte cells or were stimulated with 1000 U/mL of INF-β for 8 h and their LD numbers were analysed using ImageJ analysis software (greater than 200 cells (n = 2)). e Astrocyte and Vero cells were treated with dsRNA or dsDNA conditioned media from either astrocytes or Vero cells and their LD numbers were analysed using ImageJ analysis software (greater than 200 cells (n = 2)). f Astrocyte cells were treated with MAR1 (anti IFNAR1) antibody to block type-I IFN signalling. Cells were then stimulated with dsRNA and dsDNA up to 72 h and LDs were analysed using ImageJ analysis software. In (af) error bars, mean values ± SEM, P values were determined by unpaired two-tailed Student’s t test with a Holm-Sidak correction for multiple comparisons for 2 or more groups (greater than 300 cells; n = 3 biological replicates). Stimulated cells were statistically compared with their respective mock controls, ns = not significant. Source data are provided as a Source Data file.
Fig. 7
Fig. 7. LD Induction following nucleic acid detection is EGFR mediated.
Primary immortalised astrocyte cells were treated with 2 μM AACOCF3 (PLA2 inhibitor) for 16 h prior to stimulation with dsRNA or dsDNA for 8 h and (a) were stained with Bodipy (493/503) to visualise LDs (green) and DAPI to visualise the cell nuclei (blue) 8 h post stimulation and (b) average numbers of LDs per cell was analysed using ImageJ analysis software (greater 200 cells, n = 2). c Primary immortalised astrocyte cells were treated with 2 μM AG-1478 (EGFR inhibitor) 16 h prior to stimulation with dsRNA or dsDNA, or treatment with OA and were stained with Bodipy (493/503) to visualise LDs and DAPI to visualise the cell nuclei 8 h post-stimulation. d The average number of LDs per cell analysed using ImageJ analysis software (greater 200 cells, n = 2). e Primary immortalised astrocyte cells were serum starved for 48 h, plated into wells and treated with 2 μM AG-14789 or control for 16 h. All cells were then given fresh full serum media for 36 h and stained to visualise LDs (green) as above. LDs were analysed using ImageJ analysis software. f Primary immortalised astrocyte cells were treated with 2 μM AG-1478 (EGFR inhibitor) for 16 h prior to stimulation with dsRNA and dsDNA for up to 72 h and were fixed at regular time points until 72 h post stimulation. Average numbers of LDs per cell was analysed using ImageJ analysis software (greater than 200 cells, n = 2). g Primary immortalised astrocyte cells were treated with 2 μM AG-1478 (EGFR inhibitor) for 16 h prior to stimulation with IFN- β and their LDs were numbers assessed using image J analysis software. In (bg) error bars, mean values ± SEM, P values were determined by unpaired two-tailed Student’s t test with a Holm-Sidak correction for multiple comparisons for 2 or more groups (greater than 300 cells; n = 3 biological replicates). Stimulated cells were statistically compared with their respective mock controls, ns = not significant. h Primary immortalised astrocyte cells were treated with 2 μM AACOCF3 for 16 h prior to stimulation with dsRNA or dsDNA for 16 h where secreted IFN protein levels from these experiments were analysed via ELISA for IFN- β and IFN-λ protein. Error bars, mean values ± SEM, P values were determined by two-way ANOVA post-hoc pairwise comparisons with Bonferroni correction (n = 3 biological replicates). Source data are provided as a Source Data file.
Fig. 8
Fig. 8. EGFR treatment enhances viral infection and dampens the interferon response to ZIKV and HSV-1.
a Primary immortalised astrocyte cells were treated with 2 μM AG-1478 (EGFR inhibitor) for 16 h prior to infection with ZIKV and HSV-1. Cells were stained with Bodipy (493/503) to visualise LDs (green) and DAPI to visualise the cell nuclei (blue). ZIKV RNA was detected using anti-3G1.1 and 2G4 dsRNA antibodies and HSV-1 was detected using the anti-HSV-1 antibody (Abcam, ab9533), both viral proteins shown with red staining. Images are a representation of n = 3 independent experiments. b, c RT-qPCR was utilised to evaluate IFN-β, IFN-λ and viperin mRNA expression at 8, 24 and 48 hpi for both ZIKV at MOI 0.1 or HSV-1 at MOI 0.01. RT-PCRs were performed to detect viral nucleic acid levels of (d) ZIKV and (e) HSV-1. In (be) error bars, mean values ± SEM, P values were determined by unpaired two-tailed Student’s t test with a Holm-Sidak correction for multiple comparisons for 2 or more groups (greater than 300 cells; n = 3 biological replicates). Stimulated cells were statistically compared with their respective mock controls, ns = not significant. f IFN protein levels from these experiments were analysed via ELISA for IFN- β and IFN-λ protein at 16 h post infection. Error bars, mean values ± SEM, P values were determined by two-way ANOVA post-hoc pairwise comparisons with Bonferroni correction (n = 3 biological replicates), nd = not detected. Source data are provided as a Source Data file.
Fig. 9
Fig. 9. Lipid droplets are induced to enhance an effective interferon response.
Here we demonstrate that the host upregulates LDs following pathogen detection in two waves. The first wave is EGFR dependent which is independent of interferon production, and the second wave is induced via interferon production. During dsDNA stimulation, there is no second wave, and this is hypothesised to be due to a negative regulator of LD accumulation produced by cells during this response. Figure created by authors on BioRender.com.

Comment in

References

    1. Arrese EL, Saudale FZ, Soulages JL. Lipid droplets as signaling platforms linking metabolic and cellular functions. Lipid Insights. 2014;7:7–16. doi: 10.4137/LPI.S11128. - DOI - PMC - PubMed
    1. den Brok MH, Raaijmakers TK, Collado-Camps E, Adema GJ. Lipid droplets as immune modulators in myeloid cells. Trends Immunol. 2018;39:380–392. doi: 10.1016/j.it.2018.01.012. - DOI - PubMed
    1. Gao Q, Goodman JM. The lipid droplet-a well-connected organelle. Front Cell Dev. Biol. 2015;3:49. doi: 10.3389/fcell.2015.00049. - DOI - PMC - PubMed
    1. Henne, W. M., Reese, M. L. & Goodman, J. M. The assembly of lipid droplets and their roles in challenged cells. EMBO J. 38, e98947 (2019). - PMC - PubMed
    1. Mattos KA, et al. Modulation of lipid droplets by Mycobacterium leprae in Schwann cells: a putative mechanism for host lipid acquisition and bacterial survival in phagosomes. Cell. Microbiol. 2011;13:259–273. doi: 10.1111/j.1462-5822.2010.01533.x. - DOI - PubMed

Publication types