. 2021 Sep;27(9):1525-1529.
doi: 10.1038/s41591-021-01449-9. Epub 2021 Jul 14.

Immune responses against SARS-CoV-2 variants after heterologous and homologous ChAdOx1 nCoV-19/BNT162b2 vaccination

Affiliations

Immune responses against SARS-CoV-2 variants after heterologous and homologous ChAdOx1 nCoV-19/BNT162b2 vaccination

Joana Barros-Martins et al. Nat Med. 2021 Sep.

Abstract

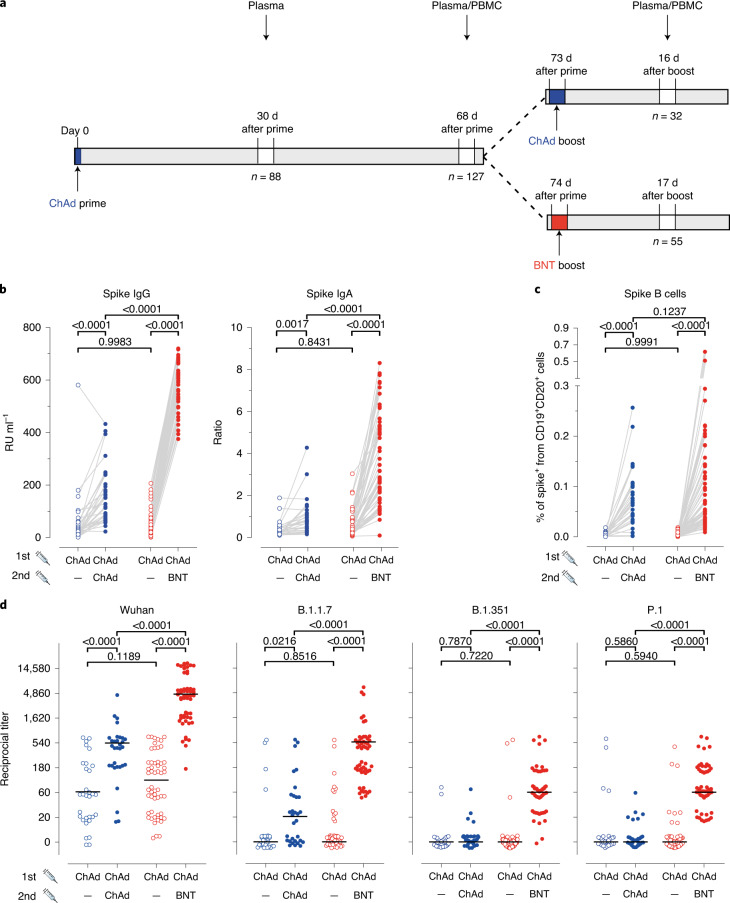
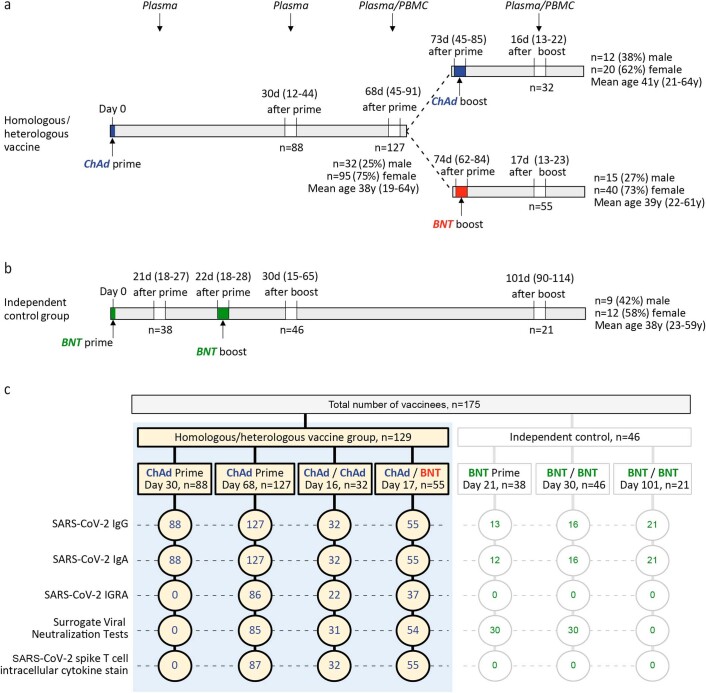
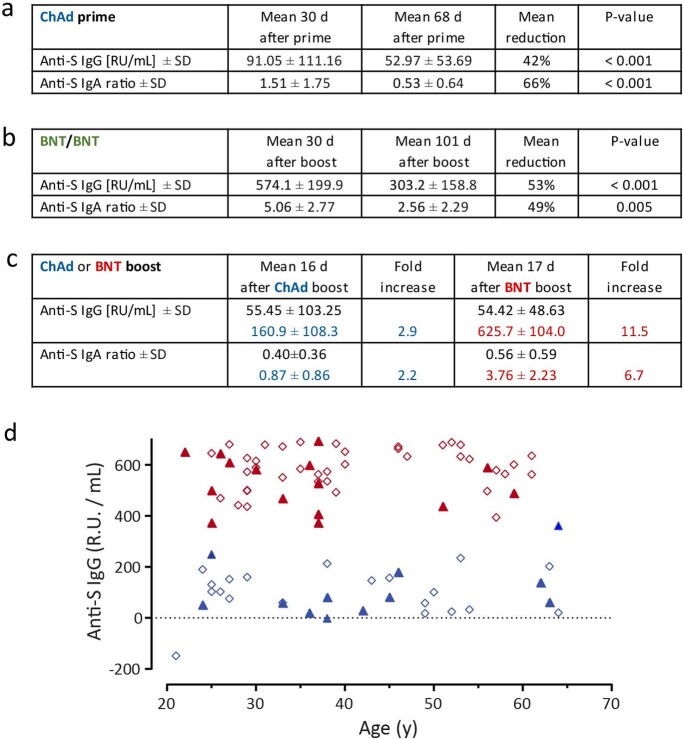
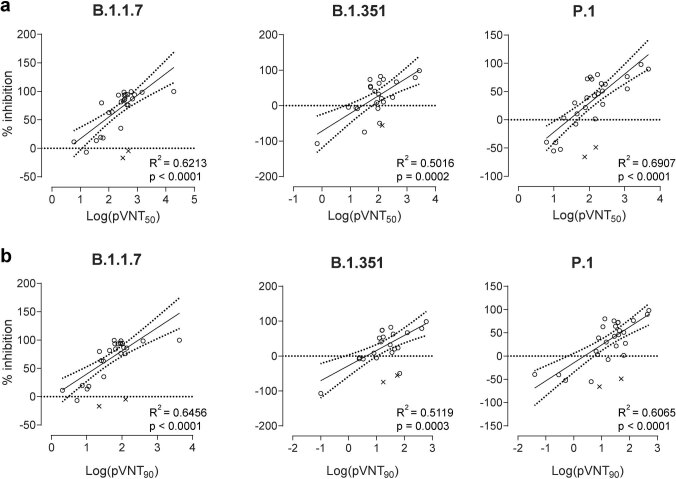
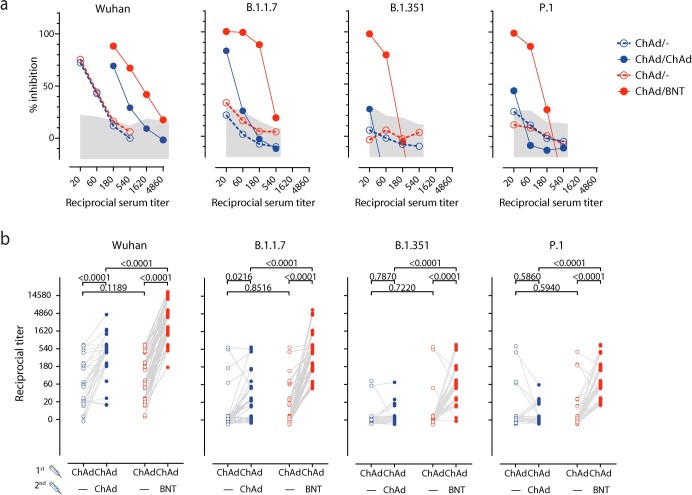
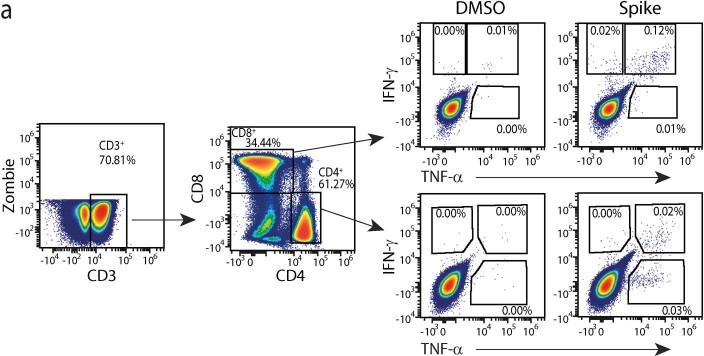
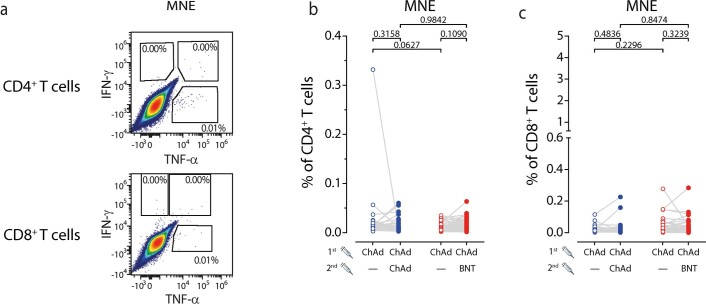
Currently approved viral vector-based and mRNA-based vaccine approaches against coronavirus disease 2019 (COVID-19) consider only homologous prime-boost vaccination. After reports of thromboembolic events, several European governments recommended using AstraZeneca's ChAdOx1-nCov-19 (ChAd) only in individuals older than 60 years, leaving millions of already ChAd-primed individuals with the decision to receive either a second shot of ChAd or a heterologous boost with mRNA-based vaccines. However, such combinations have not been tested so far. We used Hannover Medical School's COVID-19 Contact Study cohort of healthcare professionals to monitor ChAd-primed immune responses before and 3 weeks after booster with ChAd (n = 32) or BioNTech/Pfizer's BNT162b2 (n = 55). Although both vaccines boosted prime-induced immunity, BNT162b2 induced significantly higher frequencies of spike-specific CD4+ and CD8+ T cells and, in particular, high titers of neutralizing antibodies against the B.1.1.7, B.1.351 and P.1 variants of concern of severe acute respiratory syndrome coronavirus 2.


Conflict of interest statement

The authors declare no competing interests.

Figures

Fig. 1
Fig. 1. Stronger humoral immune responses against all SARS-CoV-2 variants after heterologous ChAd/BNT versus homologous ChAd/ChAd vaccination.
a, Participant recruitment scheme. b, S-specific IgG and IgA levels in plasma after prime (open circles) and after boost (closed circles) from homologous ChAd/ChAd (blue symbols) and heterologous ChAd/BNT (red symbols) vaccinees. Data are from n = 32 biologically independent samples from the ChAd/ChAd group and n = 55 biologically independent samples from the ChAd/BNT group. c, Percentage of spike-specific from total B cells in the whole blood measured using flow cytometry. Data are from n = 32 biologically independent samples from the ChAd/ChAd group and n = 55 biologically independent samples from the ChAd/BNT group. d, Reciprocal titers of neutralizing antibodies against Wuhan, B.1.1.7 (Alpha), P.1 (B.1.1.28.1; Gamma) and B.1.351 (Beta) SARS-CoV-2-S variants measured using the sVNT. Data are from n = 31 biologically independent samples from the ChAd/ChAd group and n = 54 biologically independent samples from the ChAd/BNT group. For better visualization of identical titer values, data were randomly and proportionally adjusted closely around the precise titer results. Statistics: b and c. Paired t-test (within groups) or two-way ANOVA followed by Sidak’s multiple comparison test (between groups). d: chi-square test for trend. bd: Dots represent individual vaccinees; lines represent group median. Source data
Fig. 2
Fig. 2. Heterologous ChAd/BNT vaccination induces stronger anti-SARS-CoV-2 spike T cell responses versus homologous ChAd/ChAd vaccination.
a, b, Boost vaccination increased total percentage of cytokine-secreting CD4+ (a) and CD8+ (b) T cells. We calculated the total number of cytokine-secreting cells as the sum of IFN-γ+TNF-α, IFN-γ+TNF-α+ and IFN-γTNF-α+ cells in the gates indicated in Extended Data Fig. 7. Data are from n = 32 biologically independent samples from the ChAd/ChAd group and n = 55 biologically independent samples from the ChAd/BNT group. c, Increased percentage of double cytokine-secreting CD4+ and CD8+ T cells after the second vaccine dose. Data are from n = 32 biologically independent samples from the ChAd/ChAd group and n = 55 biologically independent samples from the ChAd/BNT group. d, IFN-γ and TNF-α concentration in full blood supernatants after stimulation with SARS-CoV-2 S1 domain for 20–24 h measured in duplicate by LEGENDplex (BioLegend). Data are from n = 22 biologically independent samples from the ChAd/ChAd group and n = 37 biologically independent samples from the ChAd/BNT group. Statistics: a, b and d. Paired t-test (within groups) or two-way ANOVA followed by Sidak’s multiple comparison test (between groups). Dots represent individual vaccinees. c: Data are represented as mean − s.d. Source data
Extended Data Fig. 1
Extended Data Fig. 1. Participant recruitment schemes.
a, Participant recruitment scheme including age and sex information. Days are given as mean (range). b, Participant recruitment scheme for vaccinees immunized twice with BNT vaccine. c, Scheme indicating number of samples analyzed with each assay in each group.
Extended Data Fig. 2
Extended Data Fig. 2. Mean anti-S IgG and IgA values in study groups.
a, Time course of anti-S IgG and IgA decline over mean 38 days after ChAd prime and before full BNT vaccination (n = 86). Differences were assessed by paired t-test. b, Time course of anti-S IgG and IgA decline over mean 71 days in the independent control group after BNT/BNT full vaccination (n = 21). Differences were assessed by paired t-test. c, Fold increase of anti-S IgG and IgA after ChAd prime (top values) followed by either ChAd (n = 32) or BNT (n = 55) booster vaccination (blue or red values). d, Increase in anti-S IgG after ChAd prime followed by either ChAd (blue) or BNT (red) booster vaccination in relation to age and sex (male = triangles, female=rhombs). It should be noted that anti-S IgG differences for heterologous vaccination were always greater than for homologous vaccination. Source data
Extended Data Fig. 3
Extended Data Fig. 3. Humoral immune response against all SARS-CoV-2 variants following homologous BNT162b2 (BNT) / BNT162b2 (BNT) vaccination.
a,b, Spike-specific IgG (a) and IgA (b) levels in plasma after prime (open circles) and 30 days (mean) after booster (closed circles) homologous BNT/BNT vaccination. Data are from n = 16 biologically independent sample pairs. c, Reciprocal titers of neutralizing antibodies against Wuhan-Spike, B.1.1.7-Spike (Alpha), P.1-Spike (B.1.1.28.1; Gamma), and B.1.351-Spike (Beta) SARS-CoV-2 variants measured using surrogate virus neutralization test (sVNT). Data are from n = 30 biologically independent sample pairs. For better visualization of identical titer values, data were randomly and proportionally adjusted closely around the precise titer results. Statistics: a-b. Paired t-test (within groups); c. Chi-square test for trend. a-c, Dots represent individual vaccines, lines represent group median. Source data
Extended Data Fig. 4
Extended Data Fig. 4. Antibody panel (a) and gating strategy (b) for SARS-CoV-2-S (Spike)-specific B cell populations in blood.
Pseudocolor plots show representative data from a female donor 71 days after priming with ChAd and 20 days post boost with BNT.
Extended Data Fig. 5
Extended Data Fig. 5. Antibody neutralization measurements against different SARS-CoV-2 variants are positively correlated between the virus neutralization tests (sVNT) and pseudotyped virus neutralization tests (pVNT).
Correlation (solid line) and 95% confidence intervals (dotted lines) between sVNT1:20 and antibody titers resulting in 50% (a) or 90% (b) reduction of luciferase activity in pVNT, indicated as pVNT50 and pVNT90, respectively. Open circles, values from individual donors, outliers are marked with X and were defined as values with absolute residual value > 2 SD of all residual values in each group of samples. Correlation was calculated using single linear regression. Source data
Extended Data Fig. 6
Extended Data Fig. 6. Neutralizing antibodies interfere with binding of SARS-CoV-2-S-RBD variants to human ACE2.
a, Inhibition of interaction of indicated SARS-CoV-2-S-RBD variants with ACE2 by the addition of plasma of a representative vaccinee before (open circles) and after (closed circles) homologous ChAd/ChAd (blue symbols) and heterologous ChAd/BNT (red symbols) booster immunization. Assays were performed in duplicates and are shown as mean percentages of neutralization. Shaded areas represent mean +2 SD of values from pre-COVID-19 plasma. b, Reciprocal titers of neutralizing antibodies against the Wuhan-Spike, B.1.1.7-Spike (Alpha), P.1-Spike (B.1.1.28.1; Gamma), and B.1.351-Spike (Beta) SARS-CoV-2 variants in plasma of each vaccinee before and after the boost immunization. Statistics: Chi-square test for trend. Data are from n = 31 biologically independent sample pairs from the ChAd/ChAd group and n = 54 biologically independent sample pairs from the ChAd/BNT group. For better visualization of identical titer values, data were randomly and proportionally adjusted closely around the precise titer results. Source data
Extended Data Fig. 7
Gating strategy used for detection of cytokine producing CD4+ and CD8+ T cells after ex vivo re-stimulation with DMSO or the pool of Spike-specific peptides for 12–16 hr.
Extended Data Fig. 8
Extended Data Fig. 8. T cell cytokine production after re-stimulation with a mixture of peptides from membrane (M), nucleocapsid (N), and envelope (E) SARS-CoV-2 proteins.
The total number of cytokine secreting cells was calculated as the sum of IFN-γ+TNF-α-, IFN-γ+TNF-α+, and IFN-γ-TNF-α+ cells gated as shown in (a) for CD4+ (b) and CD8+ (c) T cells. Data are from n = 32 biologically independent sample pairs from the ChAd/ChAd group and n = 55 biologically independent sample pairs from the ChAd/BNT group. Paired t-test (within groups) or 2-way ANOVA followed by Sidak’s multiple comparison test (between groups). Source data

Comment in

Similar articles

Cited by

References

    1. Polack FP, et al. Safety and efficacy of the BNT162b2 mRNA Covid-19 vaccine. N. Engl. J. Med. 2020;383:2603–2615. doi: 10.1056/NEJMoa2034577. - DOI - PMC - PubMed
    1. Voysey, M. et al. Safety and efficacy of the ChAdOx1 nCoV-19 vaccine (AZD1222) against SARS-CoV-2: an interim analysis of four randomised controlled trials in Brazil, South Africa, and the UK. Lancet397, 99–111 (2021). - PMC - PubMed
    1. Baden LR, et al. Efficacy and safety of the mRNA-1273 SARS-CoV-2 vaccine. N. Engl. J. Med. 2021;384:403–416. doi: 10.1056/NEJMoa2035389. - DOI - PMC - PubMed
    1. Sadoff, J. et al. Safety and efficacy of single-dose Ad26.COV2.S vaccine against Covid-19. N. Engl. J. Med. 384, 2187–2201 (2021). - PMC - PubMed
    1. Wise J. Covid-19: European countries suspend use of Oxford-AstraZeneca vaccine after reports of blood clots. BMJ. 2021;372:n699. doi: 10.1136/bmj.n699. - DOI - PubMed

Publication types

MeSH terms