. 2021 Aug;596(7870):114-118.
doi: 10.1038/s41586-021-03722-w. Epub 2021 Jul 14.

Adaptive immunity induces mutualism between commensal eukaryotes

Affiliations

Adaptive immunity induces mutualism between commensal eukaryotes

Kyla S Ost et al. Nature. 2021 Aug.

Abstract

Pathogenic fungi reside in the intestinal microbiota but rarely cause disease. Little is known about the interactions between fungi and the immune system that promote commensalism. Here we investigate the role of adaptive immunity in promoting mutual interactions between fungi and host. We find that potentially pathogenic Candida species induce and are targeted by intestinal immunoglobulin A (IgA) responses. Focused studies on Candida albicans reveal that the pathogenic hyphal morphotype, which is specialized for adhesion and invasion, is preferentially targeted and suppressed by intestinal IgA responses. IgA from mice and humans directly targets hyphal-enriched cell-surface adhesins. Although typically required for pathogenesis, C. albicans hyphae are less fit for gut colonization1,2 and we show that immune selection against hyphae improves the competitive fitness of C. albicans. C. albicans exacerbates intestinal colitis3 and we demonstrate that hyphae and an IgA-targeted adhesin exacerbate intestinal damage. Finally, using a clinically relevant vaccine to induce an adhesin-specific immune response protects mice from C. albicans-associated damage during colitis. Together, our findings show that adaptive immunity suppresses harmful fungal effectors, with benefits to both C. albicans and its host. Thus, IgA uniquely uncouples colonization from pathogenesis in commensal fungi to promote homeostasis.


Figures

Extended Data Fig. 1 |
Extended Data Fig. 1 |. Human faecal and serum anti-fungal antibodies.
a, Human faecal antibody binding to cultured fungi and quantified by flow cytometry after staining with fluorescent secondary antibodies (n = 70). Staining intensity normalized to fungi stained with secondary antibodies but without human faecal wash. Box plots show minimum 25% quartile and maximum 75% quartile around the median and whiskers show range. b, IgA binding to cultured fungi from serial dilutions of human faecal wash (n = 30 healthy, n = 23 Crohn’s disease and n = 17 UC). Geometric mean with 95% CI c, d, Human serum antibody binding to cultured fungi. Serum diluted 1:75. (n = 12, n = 4 healthy and n = 8 Crohn’s disease). Mean ± s.d. e, Faecal ASCA IgA levels from undiluted faecal wash (n = 30 healthy, n = 18 Crohn’s disease and n = 14 UC). Median with 95% CI f, Serum ASCA IgA levels from human serum samples diluted 1:100 (n = 4 healthy and n = 8 Crohn’s disease). Median with 95% CI. P values calculated using two-way ANOVA with Tukey’s test (a), one-way ANOVA with Dunn’s test (c) or two-sided Mann–Whitney U-test (f, d).
Extended Data Fig. 2 |
Extended Data Fig. 2 |. IgA targets Candida species but not S. cerevisiae.
a, IgA-bound faecal fungi gating strategy. b, Peyer’s patch GC B cell and TFH cell gating strategy. c, Colon LP IgA plasma cell gating strategy (n = 4 mice per group 30 days after inoculation; representative of two experiments for b, c). d, IgA binding to faecal GFP+ S. cerevisiae and GFP+ C. albicans in monocolonized SW mice. e, Total IgA levels from monocolonized SW mice. f, Flow cytometry quantification of SW IgA binding to cultured S. cerevisiae and C. albicans (n = 4 C. albicans-colonized and n = 5 S. cerevisiae-colonized, one experiment for df). g, h, Serum antibody binding to cultured C. albicans or S. cerevisiae from SW (g) or B6 (h) GF or monocolonized mice. Antibody quantified by flow cytometry from serum diluted 1:25 (SW: GF n = 4, Sc-colonized n = 5, Ca-colonized n = 5; B6: GF n = 3, Sc n = 5, Ca-colonized n = 3). i, Lumen and tissue-associated fungal burden in monocolonized B6 mice 30 days after inoculation (n = 4 mice per group; one experiment; representative of two experiments). j, Whole-intestinal IgA four weeks after inoculation. k, Caecal wash IgA binding to cultured C. glabrata measured by flow cytometry. l, Peyer’s patch TFH cells four weeks after inoculation. m, Peyer’s patch GC B cells (n = 4 mice per group; one experiment for jm). n, IgA binding to cultured C. glabrata, S. cerevisiae and C. albicans from faecal wash from GF, C. albicans- monocolonized or C. glabrata-monocolonized intestinal wash (n = 2 C. albicans, n = 3 C. glabrata and n = 3 S. cerevisiae faecal washes) o, Percentage of IgA binding and binding intensity of faecal C. albicans during colonization of antibiotic-treated wild-type and Tcrb−/− mice (n = 6 Tcrb−/− and n =8 wild-type mice from two experiments). P values calculated using two-way ANOVA (d, o), with Sidak’s test (b, e, f, g, h, n), or two-sided unpaired t-test (j, k, l, m). Mean values ± s.d. for b, d–o.
Extended Data Fig. 3 |
Extended Data Fig. 3 |. An IgA response is not induced by 124 distinct S. cerevisiae strains.
a, IgA binding to the 20–24 strains from each pool was assessed by flow cytometry. Mice were gavaged weekly with the indicated pool for three weeks and caecal wash from mice was used as a source of IgA. C. albicans bound by IgA from C. albicans-monocolonized mice is shown in red. b, Total IgA in caecum contents quantified by ELISA. Mean values ± s.d. c, IgA binding to S. cerevisiae (pre-gated on CFW intermediate) populations from caecal material. (n = 3 mice per group representative of two experiments).
Extended Data Fig. 4 |
Extended Data Fig. 4 |. Fungal burden and GO term enrichment analysis of RNA-seq comparison of C. albicans in monocolonized wild-type and Rag1−/− mice.
a, Fungal burden in wild-type and Rag1−/− mice monocolonized with C. albicans four weeks after inoculation. Mean values ± s.d. b, c, Biological process (b) or molecular function (c) GO term enrichment in genes with q ≤ 0.05 and log2-transformed fold change ≥ 1 or ≤ −1. d, Volcano plot of the ratio of C. albicans transcripts in wild-type and Rag1−/− mice with active transmembrane transporter activity genes labelled in red (n = 5 wild type and 4 Rag1−/− mice for ad; one experiment). e, C. albicans morphology in colon contents from monocolonized wild-type or Rag1−/− mice four weeks after colonization. Mean values ± s.d. (n = 3 mice per group; one experiment). f, IgA binding to C. albicans in the faeces of antibiotic-treated wild-type and μMT−/− mice four weeks after inoculation. Mean values ± s.d. (n = 5 mice per group; one experiment). P values calculated using two-way ANOVA with Sidak’s multiple comparisons test (a, f) or two-sided unpaired t-test (e).
Extended Data Fig. 5 |
Extended Data Fig. 5 |. Filamentation and Ahr1 promote intestinal IgA responses.
a, Morphology of indicated C. albicans strains incubated for 4 h in RPMI with 10% FBS, YPD or YPD + 5 μg ml−1 aTC). TetO-NRG1 constitutively expresses NRG1 when untreated (TetOn), but aTC repressed NRG1 expression (TetOff). b, C. albicans in caecum contents stained with AF488 anti-Candida antibody. c, Intestinal fungal burden (mean values ± s.d.). d, Peyer’s patch TFH cells (ICOS+PD-1+CD4+CD3+ live cells) (mean values ± s.d.). e, Peyer’s patch GC B cells (GL-7+Fas+IgDCD19+ live cells) (mean values ± s.d.). f, Colon LP IgA+ plasma cells (IgA+CD138+CD45+CD3CD19 live cells) (mean values ± s.d.) quantified from mice monocolonized for four weeks (for cf, n = 4 mice per group; one experiment). g, Faecal AHR1 qPCR in aTC-treated mice monocolonized with wild-type or TetO-AHR1 (TetOff-AHR1) (wild type n = 3 and TetOff-ALS1 n = 5; one experiment). Mean values ± s.d. h, Fungal burden of wild-type- and TetOff-AHR1-monocolonized mice. i, IgA from wild-type- or TetOff-AHR1-monocolonized mice, j, k, Peyer’s patch TFH cells (j) and Peyer’s patch GC B cells (k) from mice monocolonized with wild type or TetOff-AHR1. l, qRT–PCR from the small intestinal contents of monocolonized mice (for hl, wild type n = 8 and TetOff-ALS1 n = 10 mice per group from two experiments). m, Intestinal IgA (from C. albicans-monocolonized mice) binding to strains that were cultured untreated or were treated with aTC. n, Human IgA binding to indicated strains cultured without aTC (wild type, ahr1Δ/Δ, ahr1Δ/Δ TetOn-ALS1) or with 5 μg ml−1 aTC (ahr1Δ/Δ TetOff-ALS1). IgA binding quantified by flow cytometry (healthy n = 13 and IBD n = 22; one experiment. Samples chosen had enough C. albicans-reactive IgA to bind at least 10% of cultured wild-type C. albicans). P values calculated using one-way ANOVA with Tukey’s test (cf), two-way ANOVA with Sidak’s test (i), two-sided unpaired t-test (j, k, l), two-sided Mann–Whitney U-test (g) or Friedman test with Dunn’s test (n).
Extended Data Fig. 6 |
Extended Data Fig. 6 |. C. albicans- and C. glabrata-induced IgA targets adhesins or adhesin-like proteins.
a, Anti-HA staining of the control S. cerevisiae expressing the Cwp1 scaffold control and the S. cerevisiae strains expressing HA-tagged C. albicans adhesins. b, Anti-HA and IgA binding to S. cerevisiae strains expressing HA-tagged C. glabrata adhesins after incubation in caecal wash from mice monocolonized with C. glabrata. SC104, SC106, SC97 and SC27 express adhesins not tagged by HA. HA and IgA binding quantified by flow cytometry.
Extended Data Fig. 7 |
Extended Data Fig. 7 |. Antibody induction by S. cerevisiae strains expressing Candida adhesins.
GF SW mice were monocolonized with the indicated strains or left GF. Colonized mice were gavaged three times per week with cultured strains. The control S. cerevisiae expresses the CWP1 cell surface scaffold but not an adhesin. a, Weekly faecal IgA levels normalized by faecal weight. b, c, Intestinal IgA (b) and IgG (c) levels at day 28 normalized by material weight. d, Colon lamina propria IgG1 plasma cells (live IgG1+IgACD138+CD19CD3CD45+ live cells). e, Colon lamina propria IgA plasma cells (live IgA+IgG1CD138+CD19CD3CD45+ live cells) (for ae, GF n = 6, control Sc n = 4, Sc + Als1 n = 5, Sc + Als3 n = 5, Sc + Hwp1 n = 4, Sc + CAGL0B00154g n = 5 mice per group; one experiment). P values calculated using one-way ANOVA with Tukey’s test (d, e) or two-way ANOVA with Tukey’s test (ac). All data are mean ± s.d.
Extended Data Fig. 8 |
Extended Data Fig. 8 |. Immune-enhanced fitness diminishes after 14 days.
Competitive index (CI) of C. albicans conditioned for four weeks in indicated GF recipient mice. B6-conditioned C. albicans was iRFP+ and Rag1−/−- conditioned C. albicans was Neon+. CI normalized to the CI when strains were competed in wild-type and Rag1−/− mice directly from culture (competition mice, n = 3 B6 and n = 4 Rag1−/− mice from one experiment). P values calculated using two-way ANOVA with Sidak’s test. Data are mean ± s.d.
Extended Data Fig. 9 |
Extended Data Fig. 9 |. AHR1 exacerbates DSS colitis.
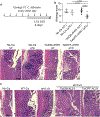
a, Schematic of DSS colitis experiments. b, Histology images and scores for mice treated with no C. albicans or with TetO-AHR1 with and without aTC (no-Ca UT, no-Ca aTC and TetOn-AHR1 UT n = 7 mice per group, TetOff-AHR1 aTC n = 8 mice per group from two independent experiments). Data are mean ± s.d. c, DSS histology images for mice treated with no C. albicans or with wild-type C. albicans, ahr1Δ/Δ C. albicans, TetOn-ALS1 ahr1Δ/Δ C. albicans and TetOff-ALS1 ahr1Δ/Δ C. albicans (aTC-treated). P values calculated using two-way ANOVA with Tukey’s test (b).
Extended Data Fig. 10 |
Extended Data Fig. 10 |. NDV-3A induces an intestinal anti-Als3 antibody response.
a, model of monocolonization and DSS experiment in vaccinated mice. b, c, ELISA quantification of Als3-specific IgA (b) and IgG (c) from the faeces of GF mice one week after boost with alum of NDV-3A vaccine. d, e, Faecal (d) and intestinal (e) lumen CFU of C. albicans in monocolonized alum or NDV-3A vaccinated mice. Intestinal CFU quantified 12 days after colonization. f, Imaging flow cytometry images of IgA+ C. albicans from caecum of NDV-3A vaccinated mice. g, Percentage of hyphae quantified using an AF488 anti-Candida antibody to visualize morphology from indicated intestinal region 12 days after monocolonization. h, HWP1 and HYR1 transcripts quantified by qRT–PCR from colon C. albicans 12 days after monocolonization. (for bh, n = 5 mice per group; one experiment). i, j, ELISA quantification of Als3-specific IgA (i) and IgG (j) in the faeces of conventionally colonized mice used for the DSS experiment. k, C. albicans CFU in colon contents after DSS treatment (for ik, n = 10 mice per group, one experiment). l, Example H&E-stained histology images from the NDV-3A DSS experiment. P values calculated using two-way ANOVA with Sidak’s test (b, c, i, j). All data are mean ± s.d. Silhouettes in a were created using BioRender.
Fig. 1 |
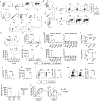
Fig. 1 |. Adaptive immune responses target and suppress C. albicans hyphae in the gut.
a, Human faecal IgA binding to cultured fungi quantified by flow cytometry (n = 30 healthy, n = 23 Crohn’s disease (CD) and n = 17 ulcerative colitis (UC)). AU, arbitrary units. b, IgA binding to faecal fungi (GFP–yeast, iRFP, CFW+) (n = 4 S. cerevisiae (Sc)-colonized and n = 3 C. albicans (Ca)-colonized mice per group). c, IgA per mg of intestinal contents, assessed by enzyme-linked immunosorbent assay (ELISA) in small intestine (SI), caecum and colon from GF or monocolonized mice four weeks after inoculation. d, e, Colon lamina propria IgA+ plasma cells (PCs) (IgA+CD138+CD45+CD3CD19 live cells) (d) and Peyer’s patch GC B cells (GL-7+FAS+IgDCD19+ live cells) (e) from monocolonized mice four weeks after inoculation (n = 4 mice per group). f, Intestinal IgA reactivity to cultured C. albicans or S. cerevisiae quantified by flow cytometry (n = 4 GF, n =4 C. albicans-colonized and n = 4 S. cerevisiae- colonized mice per group). Data in bf are representative of two experiments. g, Volcano plot of the ratio of caecal C. albicans transcripts in monocolonized wild-type (WT) and Rag1−/− mice four weeks after inoculation. SAP4 (Padj = 6.43 × 10−73) excluded from plot. h, GSEA of genes upregulated in hyphae (from a previous study). i, Anti-C. albicans antibody (green) staining of C. albicans in antibiotic-treated wild-type and Rag1−/− mice four weeks after inoculation. Images from caecum (n = 5 mice per group; one experiment). j, Faecal C. albicans in antibiotic-treated wild-type and μMT−/− mice three weeks after inoculation (n = 5 mice per group; one experiment). Scale bars, 50 μm (i, j). k, Imaging flow cytometry images of IgA+ C. albicans from monocolonized mice. IgA+ and IgA populations assessed via object circularity score. Bright-field (BF), calcofluor white (CFW), IgA, and CFW and IgA composite. Data are pooled from three B6 mice monocolonized with C. albicans three weeks after inoculation and are representative of two experiments. P values calculated using two-way ANOVA with Tukey’s test (b) or Sidak’s test (c, f, i), one-way ANOVA with Tukey’s test (d, e), Friedman test with paired Dunn’s multiple comparisons (a), two-sided unpaired t-test (j), Wald’s test with multiple test correction (g) or the ‘fgsea’ R package that corrects for multiple tests (h). Data are mean ± s.d. (cf, i, j).
Fig. 2 |
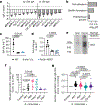
Fig. 2 |. IgA targets C. albicans adhesins.
a, Strains from the Noble (white bars) and Homann (grey bars) collections with an IgA binding z-score of ≤ −2. Intestinal wash from SW and B6 mice that were monocolonized with C. albicans. Strains in bold were identified in both collections (n = 2; one experiment). b, Gene Ontology (GO) biological process terms that were enriched in the strains from a. c, Small intestinal IgA. d, ALS1 quantitative PCR with reverse transcription (qRT–PCR) from the caecum contents of monocolonized mice. Normalized to PMA1 (n = 4 mice per group; one experiment (c, d)). e, Cell-wall fractions probed with intestinal-wash IgA from C. albicans-monocolonized mice. Als3 was identified only in the hyphal fraction using LC–MS/MS (representative of two experiments). f, IgA reactivity of monocolonized B6 (circles) or SW (squares) mice to the control S. cerevisiae, which expresses the CWP1 cell-surface scaffold but not the adhesin, or S. cerevisiae expressing the indicated C. albicans adhesins. Binding intensity was normalized to strains stained without faecal wash (FW) (n = 7 B6 and n = 8 SW mice; two experiments). g, Human faecal IgA reactivity to S. cerevisiae strains expressing the indicated C. albicans adhesins. Cg-Ad, CAGL0B00154g. Staining intensity for each human sample was normalized to the control S. cerevisiae strain expressing no adhesins (n = 70; one experiment). P values calculated using one-way ANOVA with Tukey’s test (c, d, g), or Holm–Sidak’s test (f). Data are mean ± s.d. (c, d, f, g).
Fig. 3 |
Fig. 3 |. Adaptive immunity enhances the competitive fitness of C. albicans.
a, Schematic of intestinal conditioning of C. albicans in wild-type and Rag1−/− GF mice and subsequent competition in naive mice. b, Competitive index (CI) four days after inoculating antibiotic-treated mice with conditioned C. albicans (n = 2 B6 and n = 3 Rag1−/− mice (2 days); n = 3 mice per group (4 weeks); one experiment) c, Competitive index seven days after inoculating GF B6 mice with conditioned wild-type or TetOn-NRG1 (yeast-locked) C. albicans (n = 3 WT-colonized and n = 4 TetOn-NRG1-colonized mice; one experiment). The competitive index was normalized to that when strains were competed in wild-type and Rag1−/− mice directly from culture. d, Competitive index of wild-type versus TetOn-ALS3 or TetOff-ALS3 C. albicans during colonization of antibiotic-treated B6 mice that were untreated (UT) or treated with aTC (n = 4 mice per group; one experiment). P values calculated using two-way ANOVA with Tukey’s test (b), one-way ANOVA with Tukey’s test of area under the curve (d) or two-sided unpaired t-test (c). Data are mean ± s.d. (bd). Silhouettes in a were created using BioRender.
Fig. 4 |
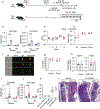
Fig. 4 |. Vaccination against C. albicans adhesin prevents damage during colitis.
a, b, DSS histology images (a) and DSS histology scores (b) for mice treated with no C. albicans (No Ca), wild-type C. albicans (WT), TetOn-NRG1 C. albicans (yeast-locked) or TetOff-NRG1 (aTC-treated) C. albicans (hyphal-locked) (n = 5 mice per group; one experiment). Scale bar, 200 μm. c, DSS histology scores for mice treated with no C. albicans or with wild-type C. albicans, ahr1Δ/Δ C. albicans, TetOn-ALS1 ahr1Δ/Δ C. albicans or TetOff-ALS1 ahr1Δ/Δ (aTC-treated) C. albicans (n = 10 (no Ca, WT and ahr1Δ/Δ), n = 5 (TetOn-ALS1) and n = 4 (TetOff-ALS1) mice per group; two experiments). d, IgA binding to faecal C. albicans in monocolonized alum or NDV-3A-vaccinated mice quantified by flow cytometry. e, Colon-tissue-associated colony-forming units (CFU). f, ALS3 and ALS1 expression quantified by qRT–PCR from the colon contents of C. albicans-monocolonized mice treated as in d (n = 5 mice per group; one experiment (df)). g, DSS histology scores for alum- or NDV3A-vaccinated mice treated with no C. albicans or wild-type C. albicans (n = 10 mice per group; one experiment). P values calculated using two-way ANOVA with Sidak’s test (d), two-sided unpaired t-test (e, f) or one-way ANOVA with Tukey’s test (b, c, g). Data are mean ± s.d. (bg).ex

Comment in

References

    1. Witchley JN et al. Candida albicans morphogenesis programs control the balance between gut commensalism and invasive infection. Cell Host Microbe 25, 432–443 (2019). - PMC - PubMed
    1. Tso GHW et al. Experimental evolution of a fungal pathogen into a gut symbiont. Science 362, 589–595 (2018). - PubMed
    1. Leonardi I. et al. CX3CR1+ mononuclear phagocytes control immunity to intestinal fungi. Science 359, 232–236 (2018). - PMC - PubMed
    1. Zhai B. et al. High-resolution mycobiota analysis reveals dynamic intestinal translocation preceding invasive candidiasis. Nat. Med. 26, 59–64 (2020). - PMC - PubMed
    1. Jain U. et al. Debaryomyces is enriched in Crohn’s disease intestinal tissue and impairs healing in mice. Science 371, 1154–1159 (2021). - PMC - PubMed

Publication types

MeSH terms