. 2021 Jul;595(7867):415-420.
doi: 10.1038/s41586-021-03707-9. Epub 2021 Jul 14.

A metabolomics pipeline for the mechanistic interrogation of the gut microbiome

Affiliations

A metabolomics pipeline for the mechanistic interrogation of the gut microbiome

Shuo Han et al. Nature. 2021 Jul.

Abstract

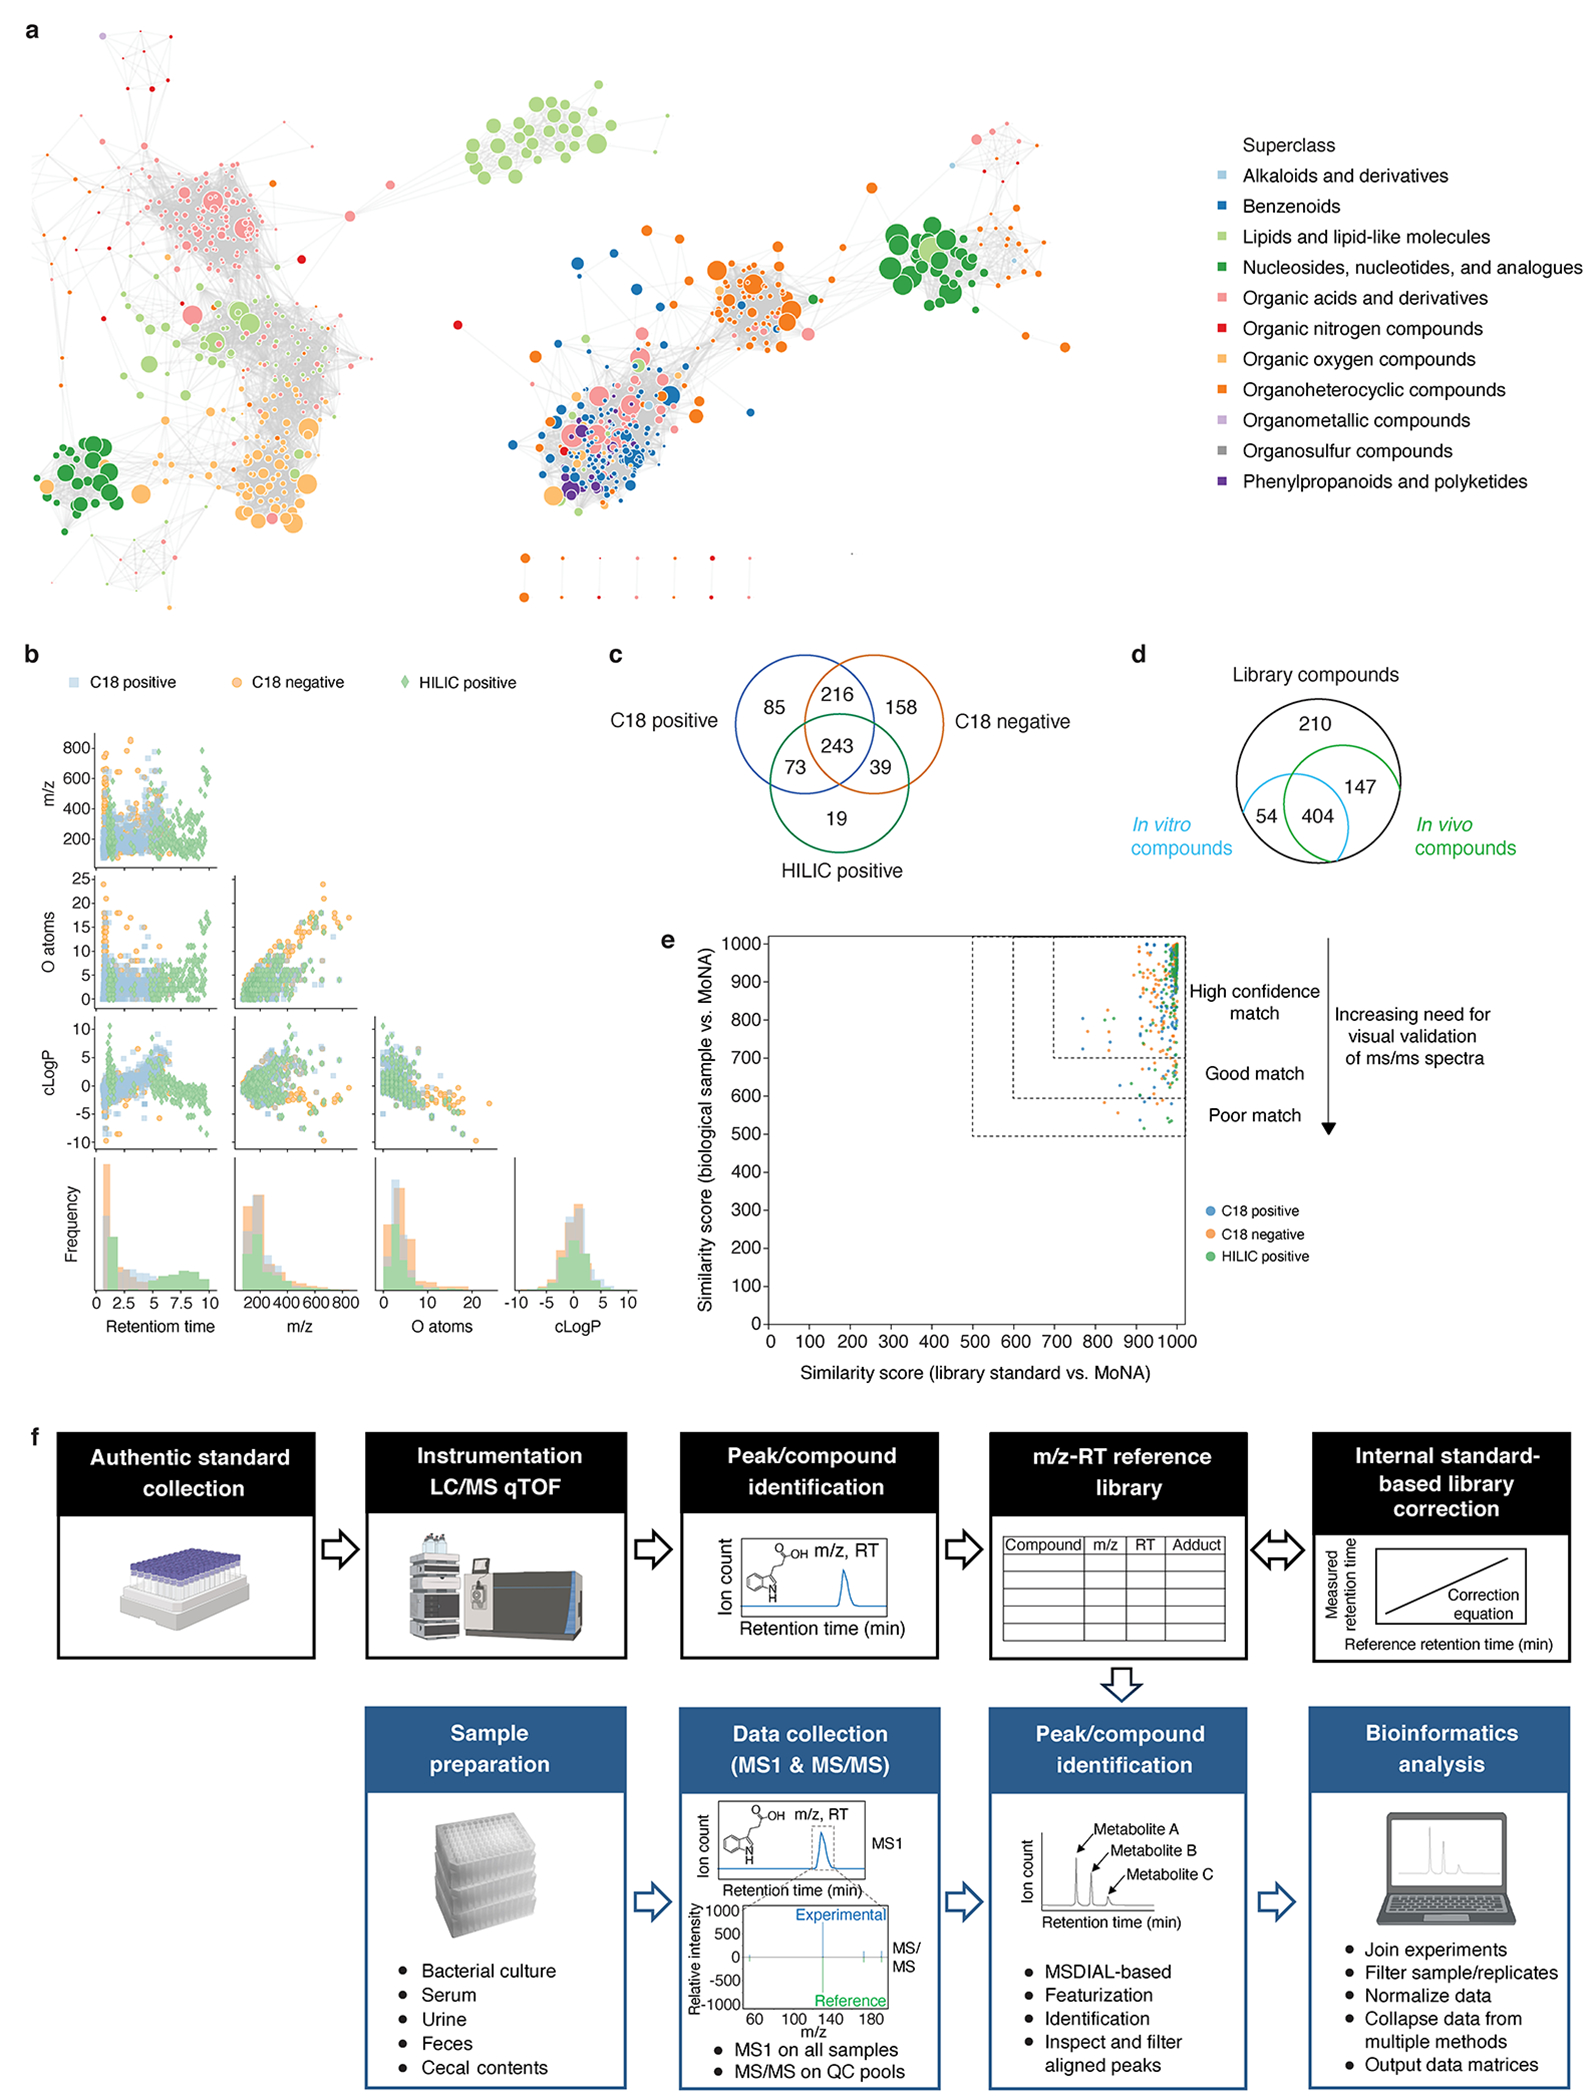
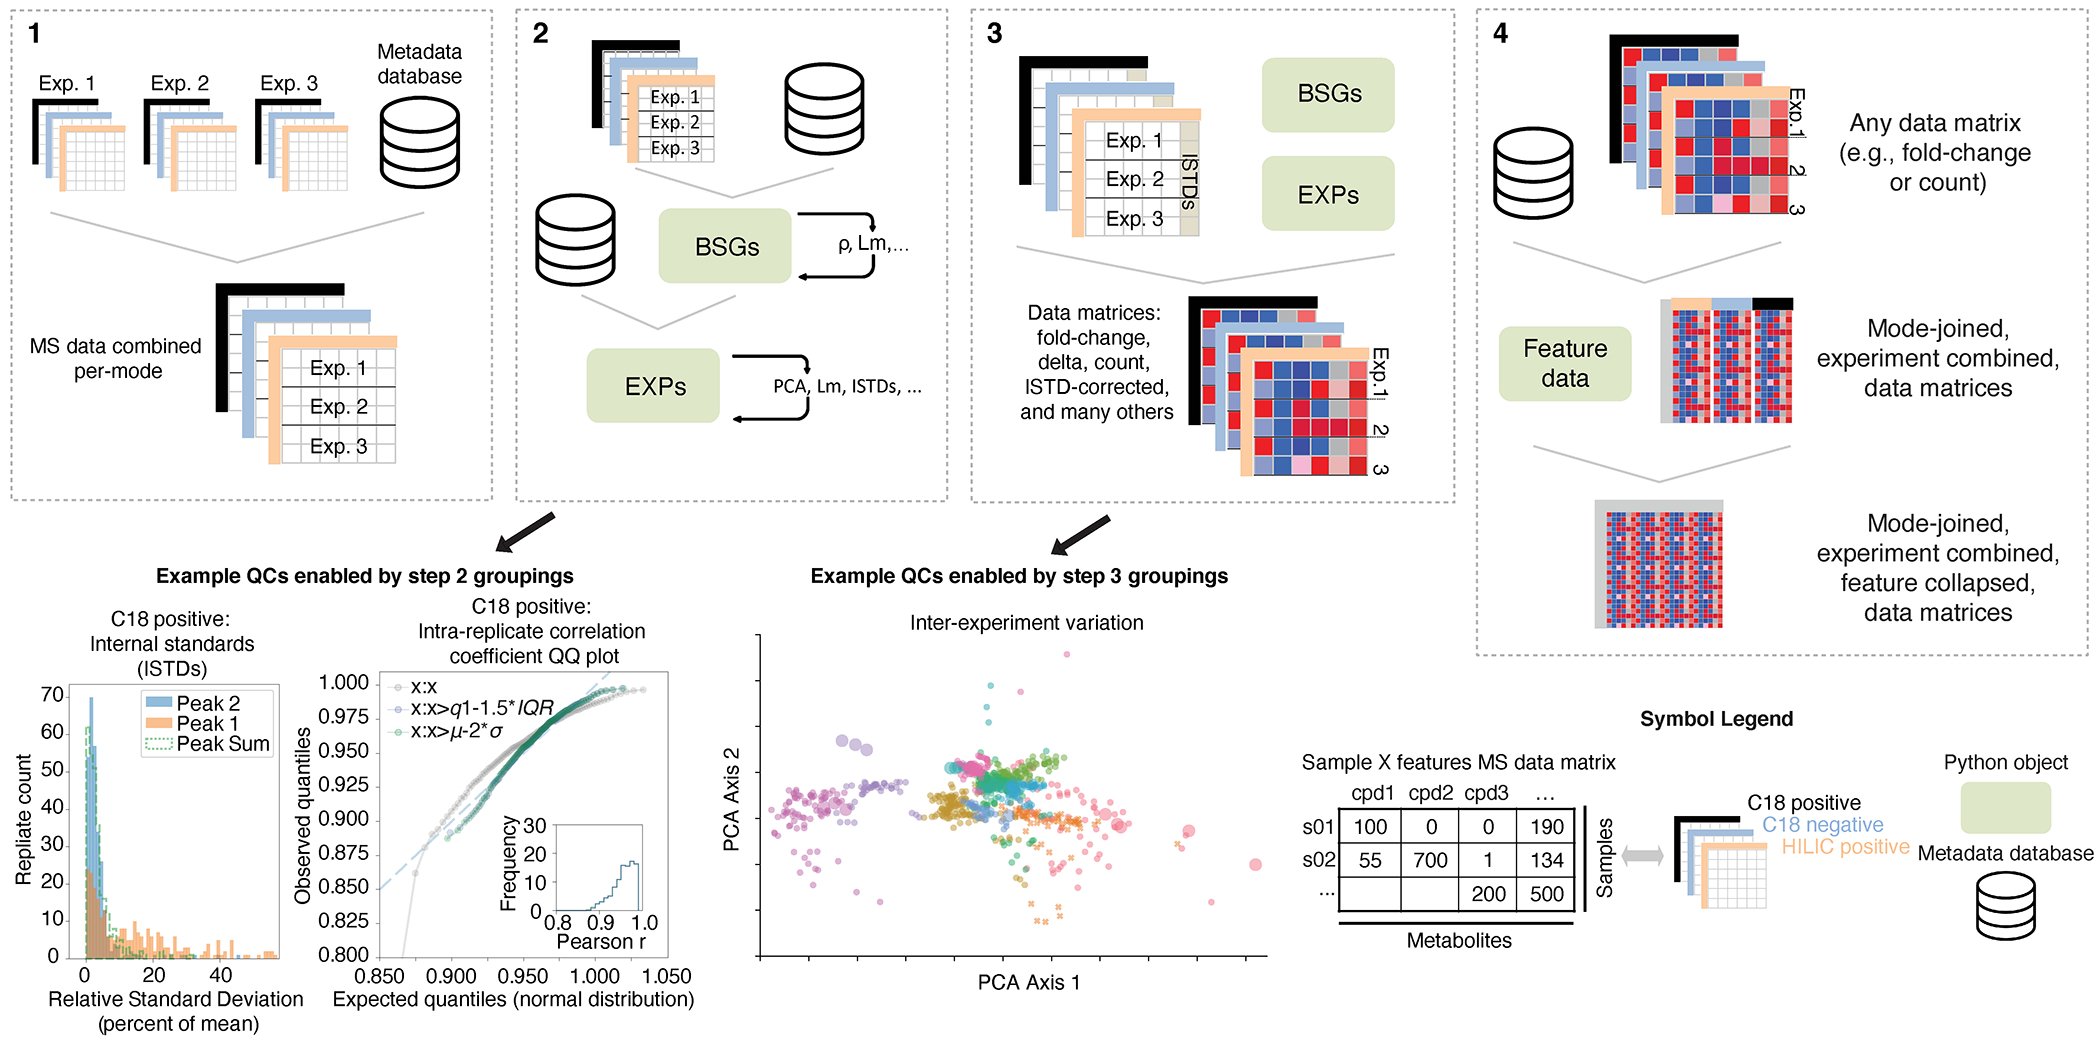
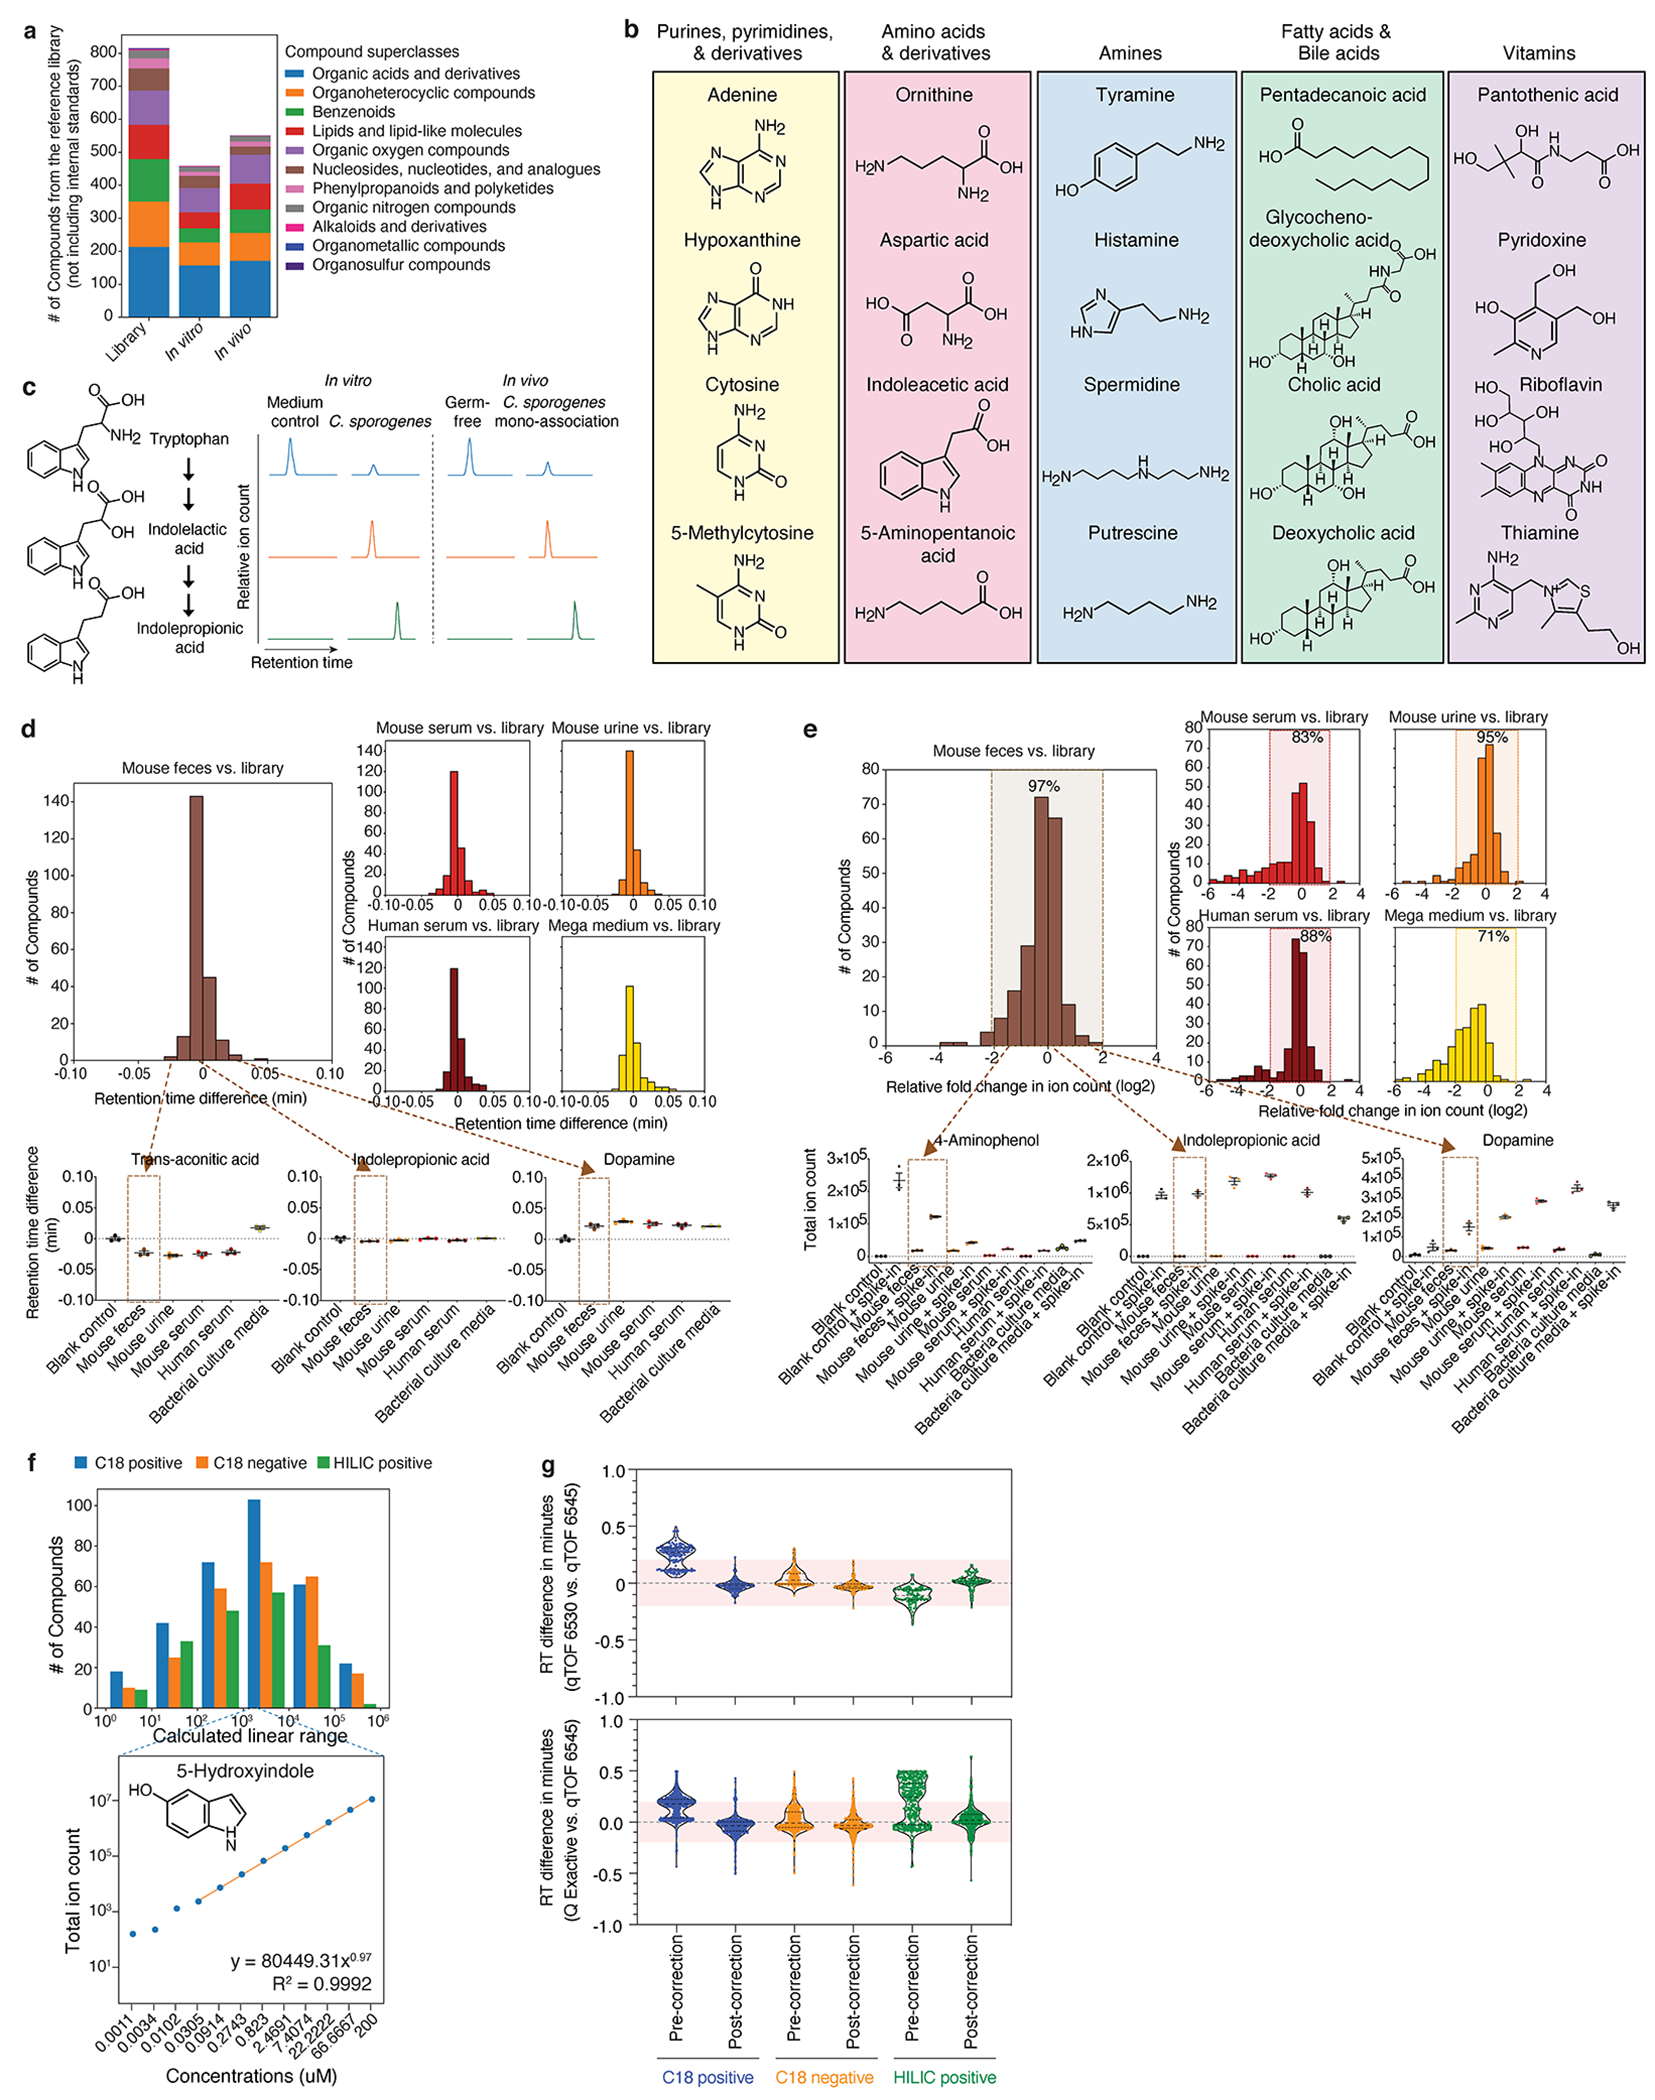
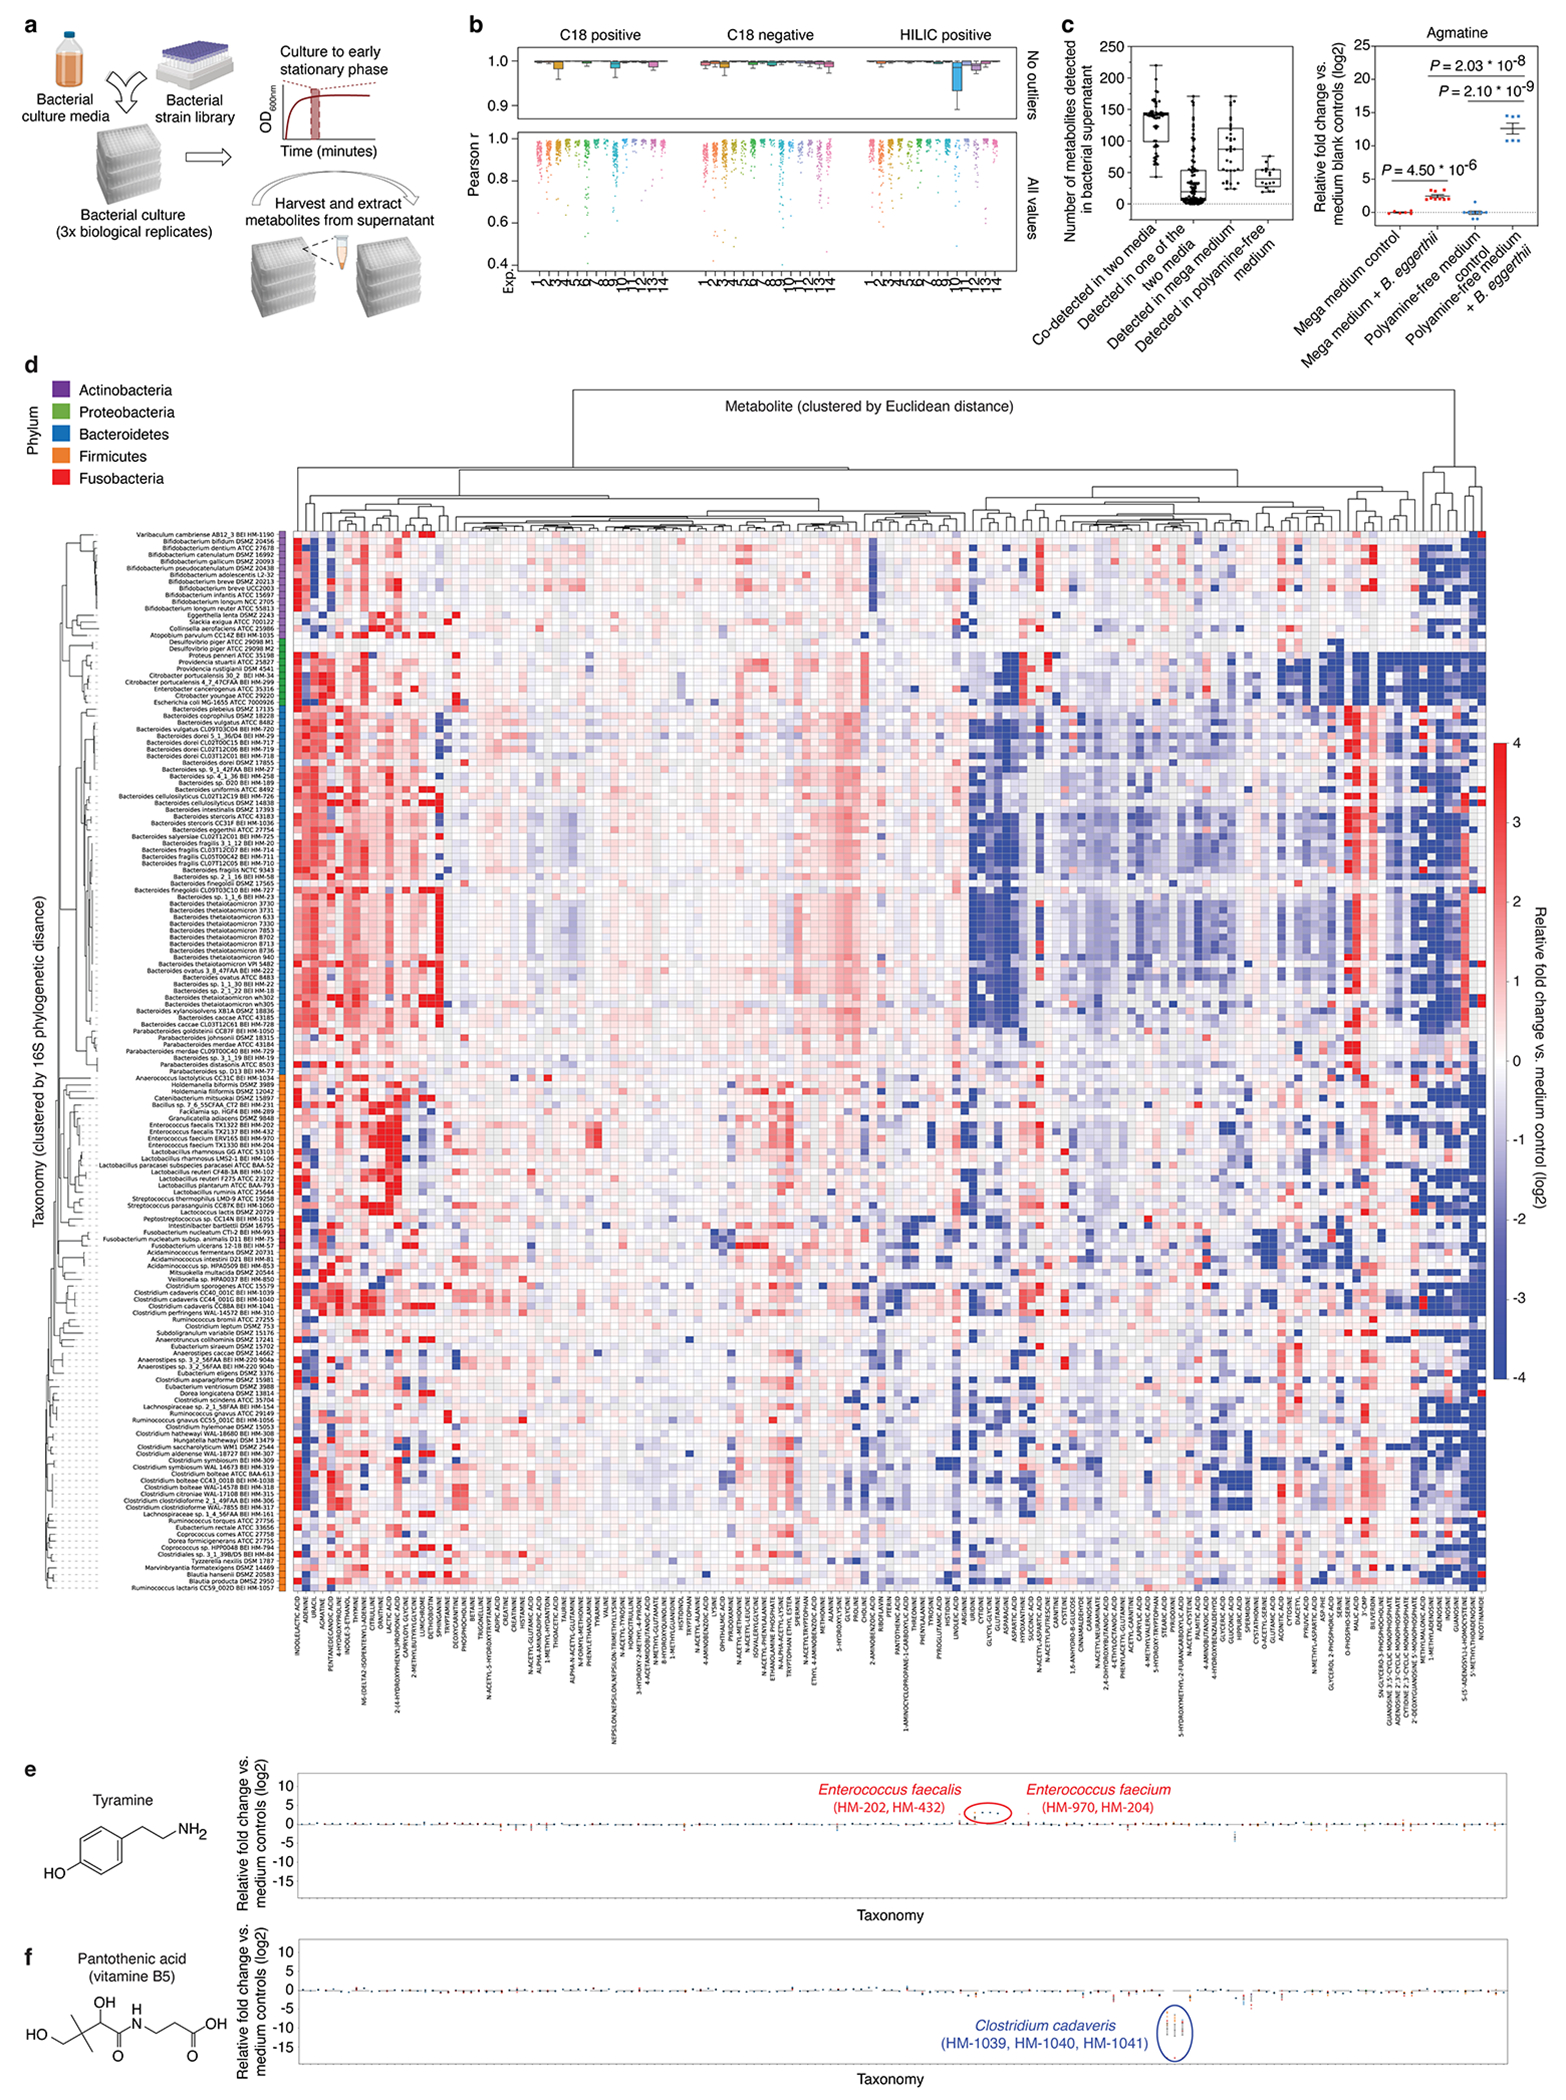
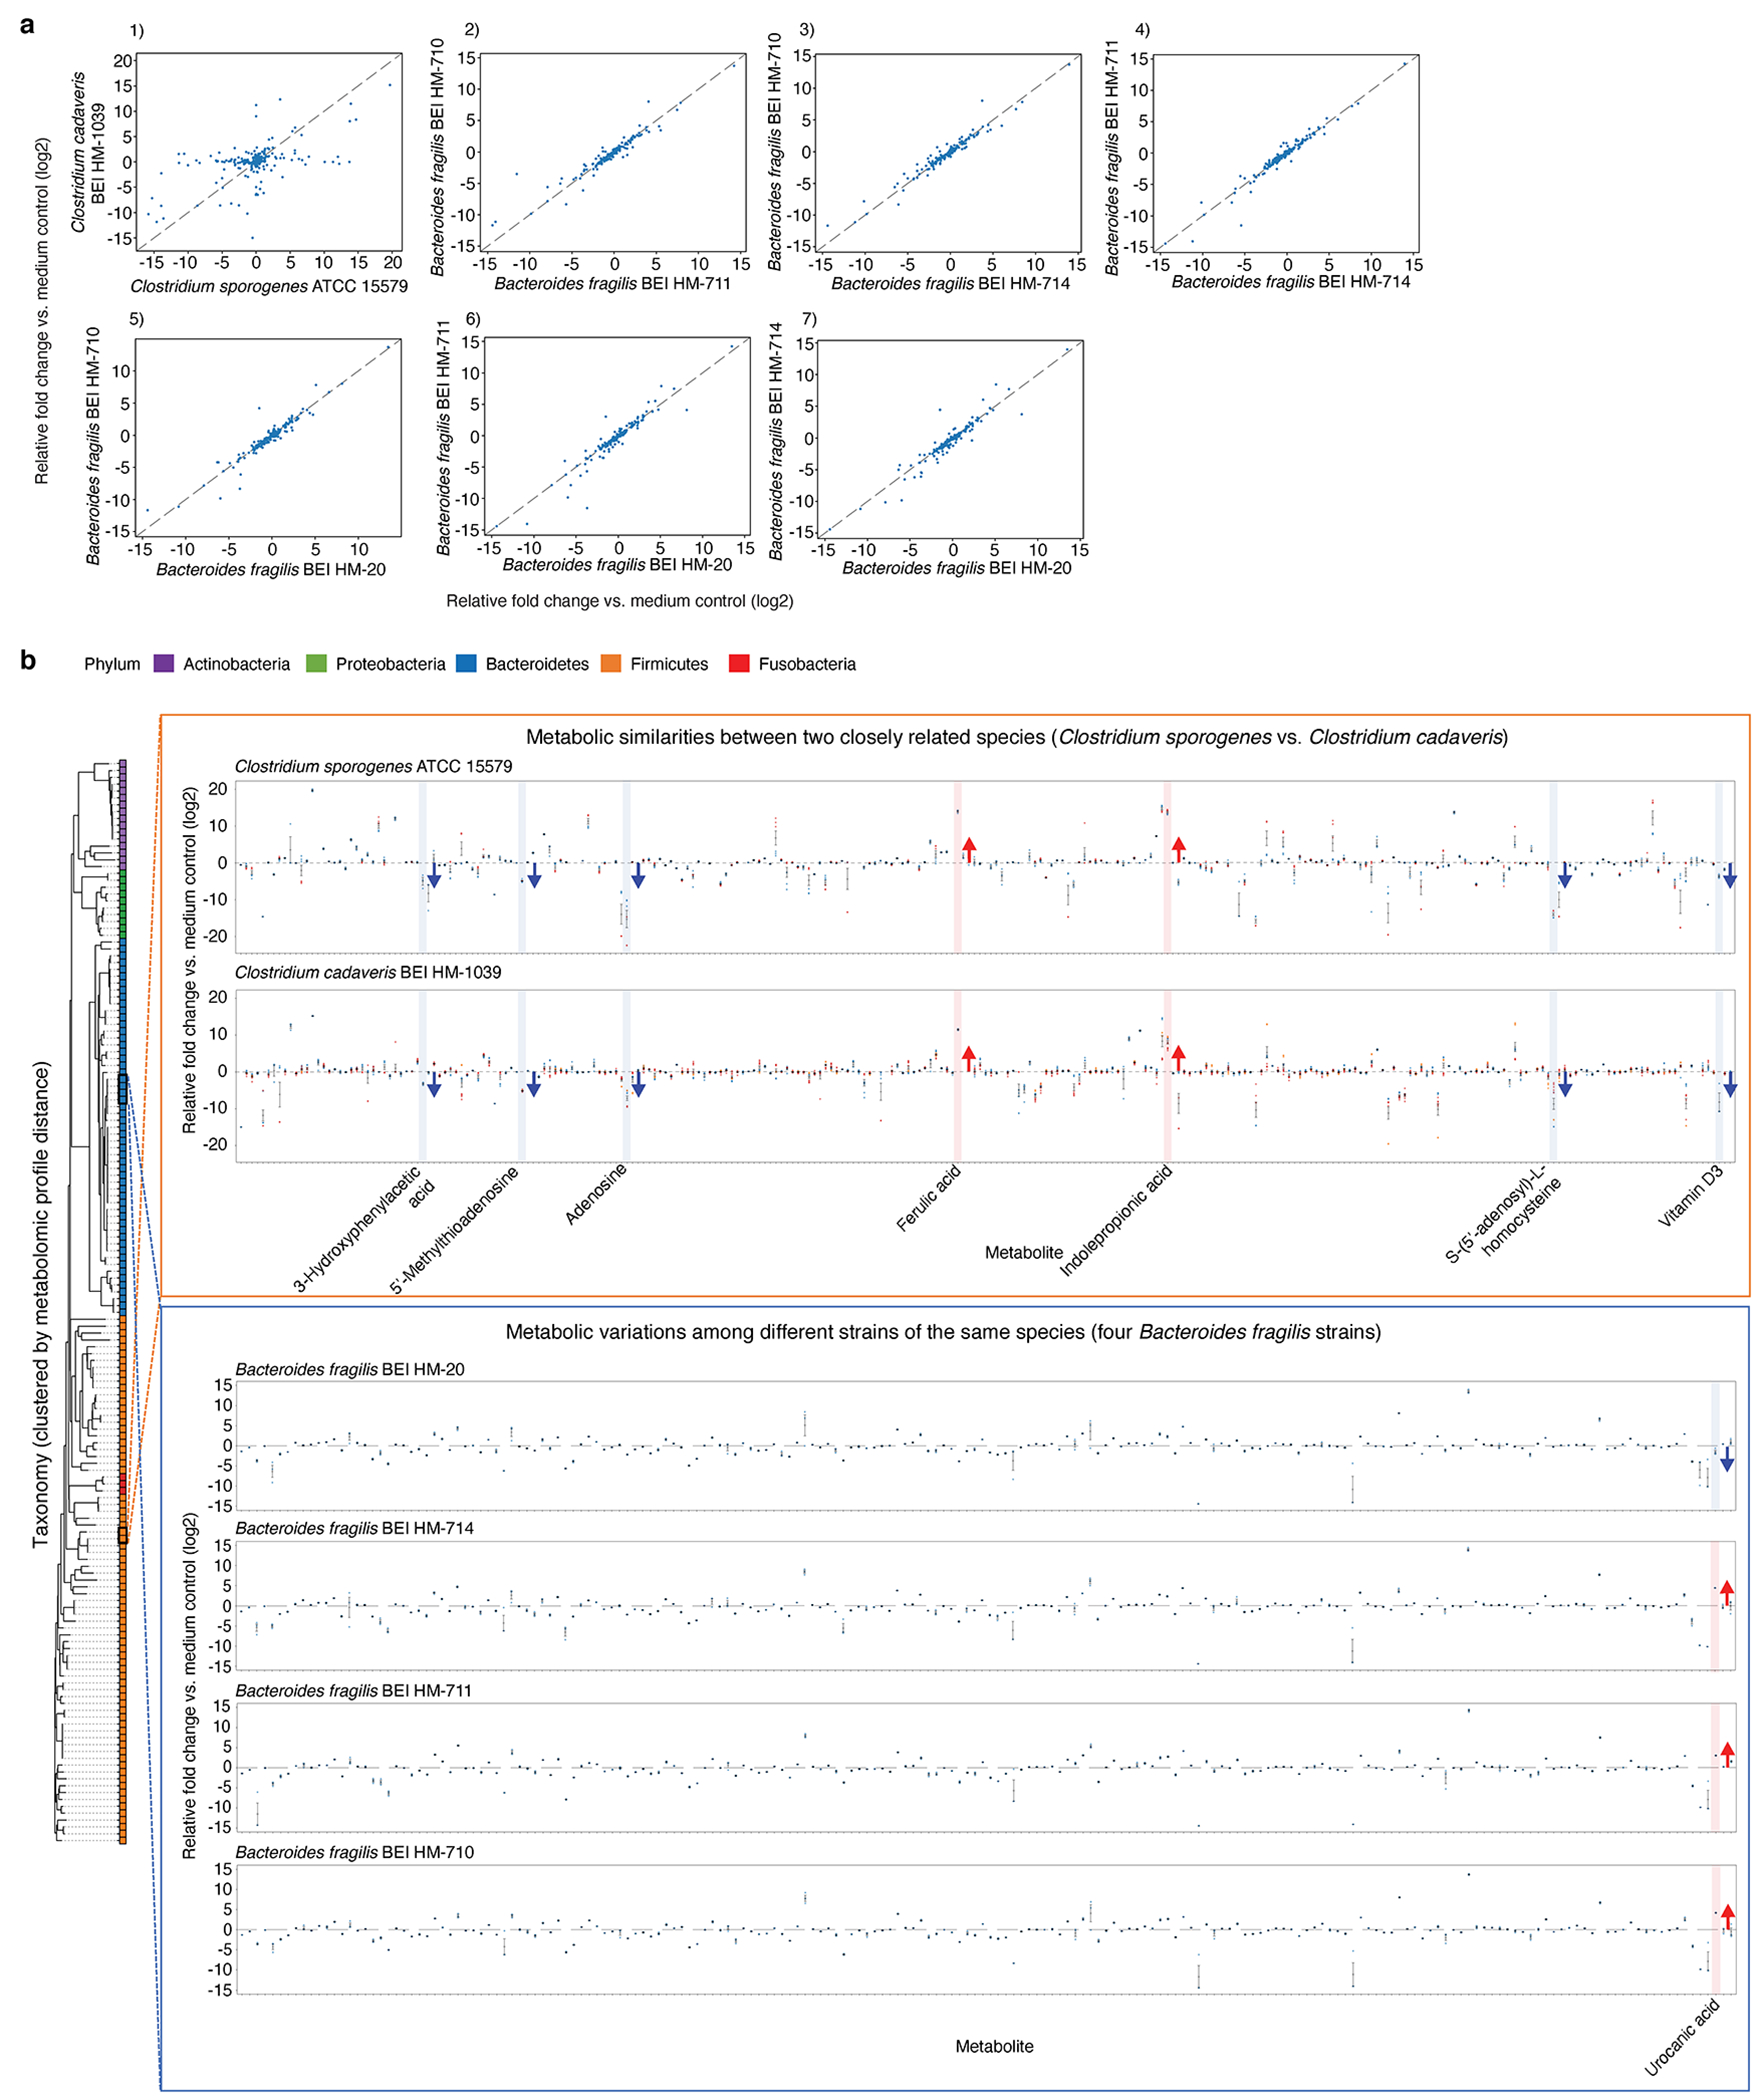
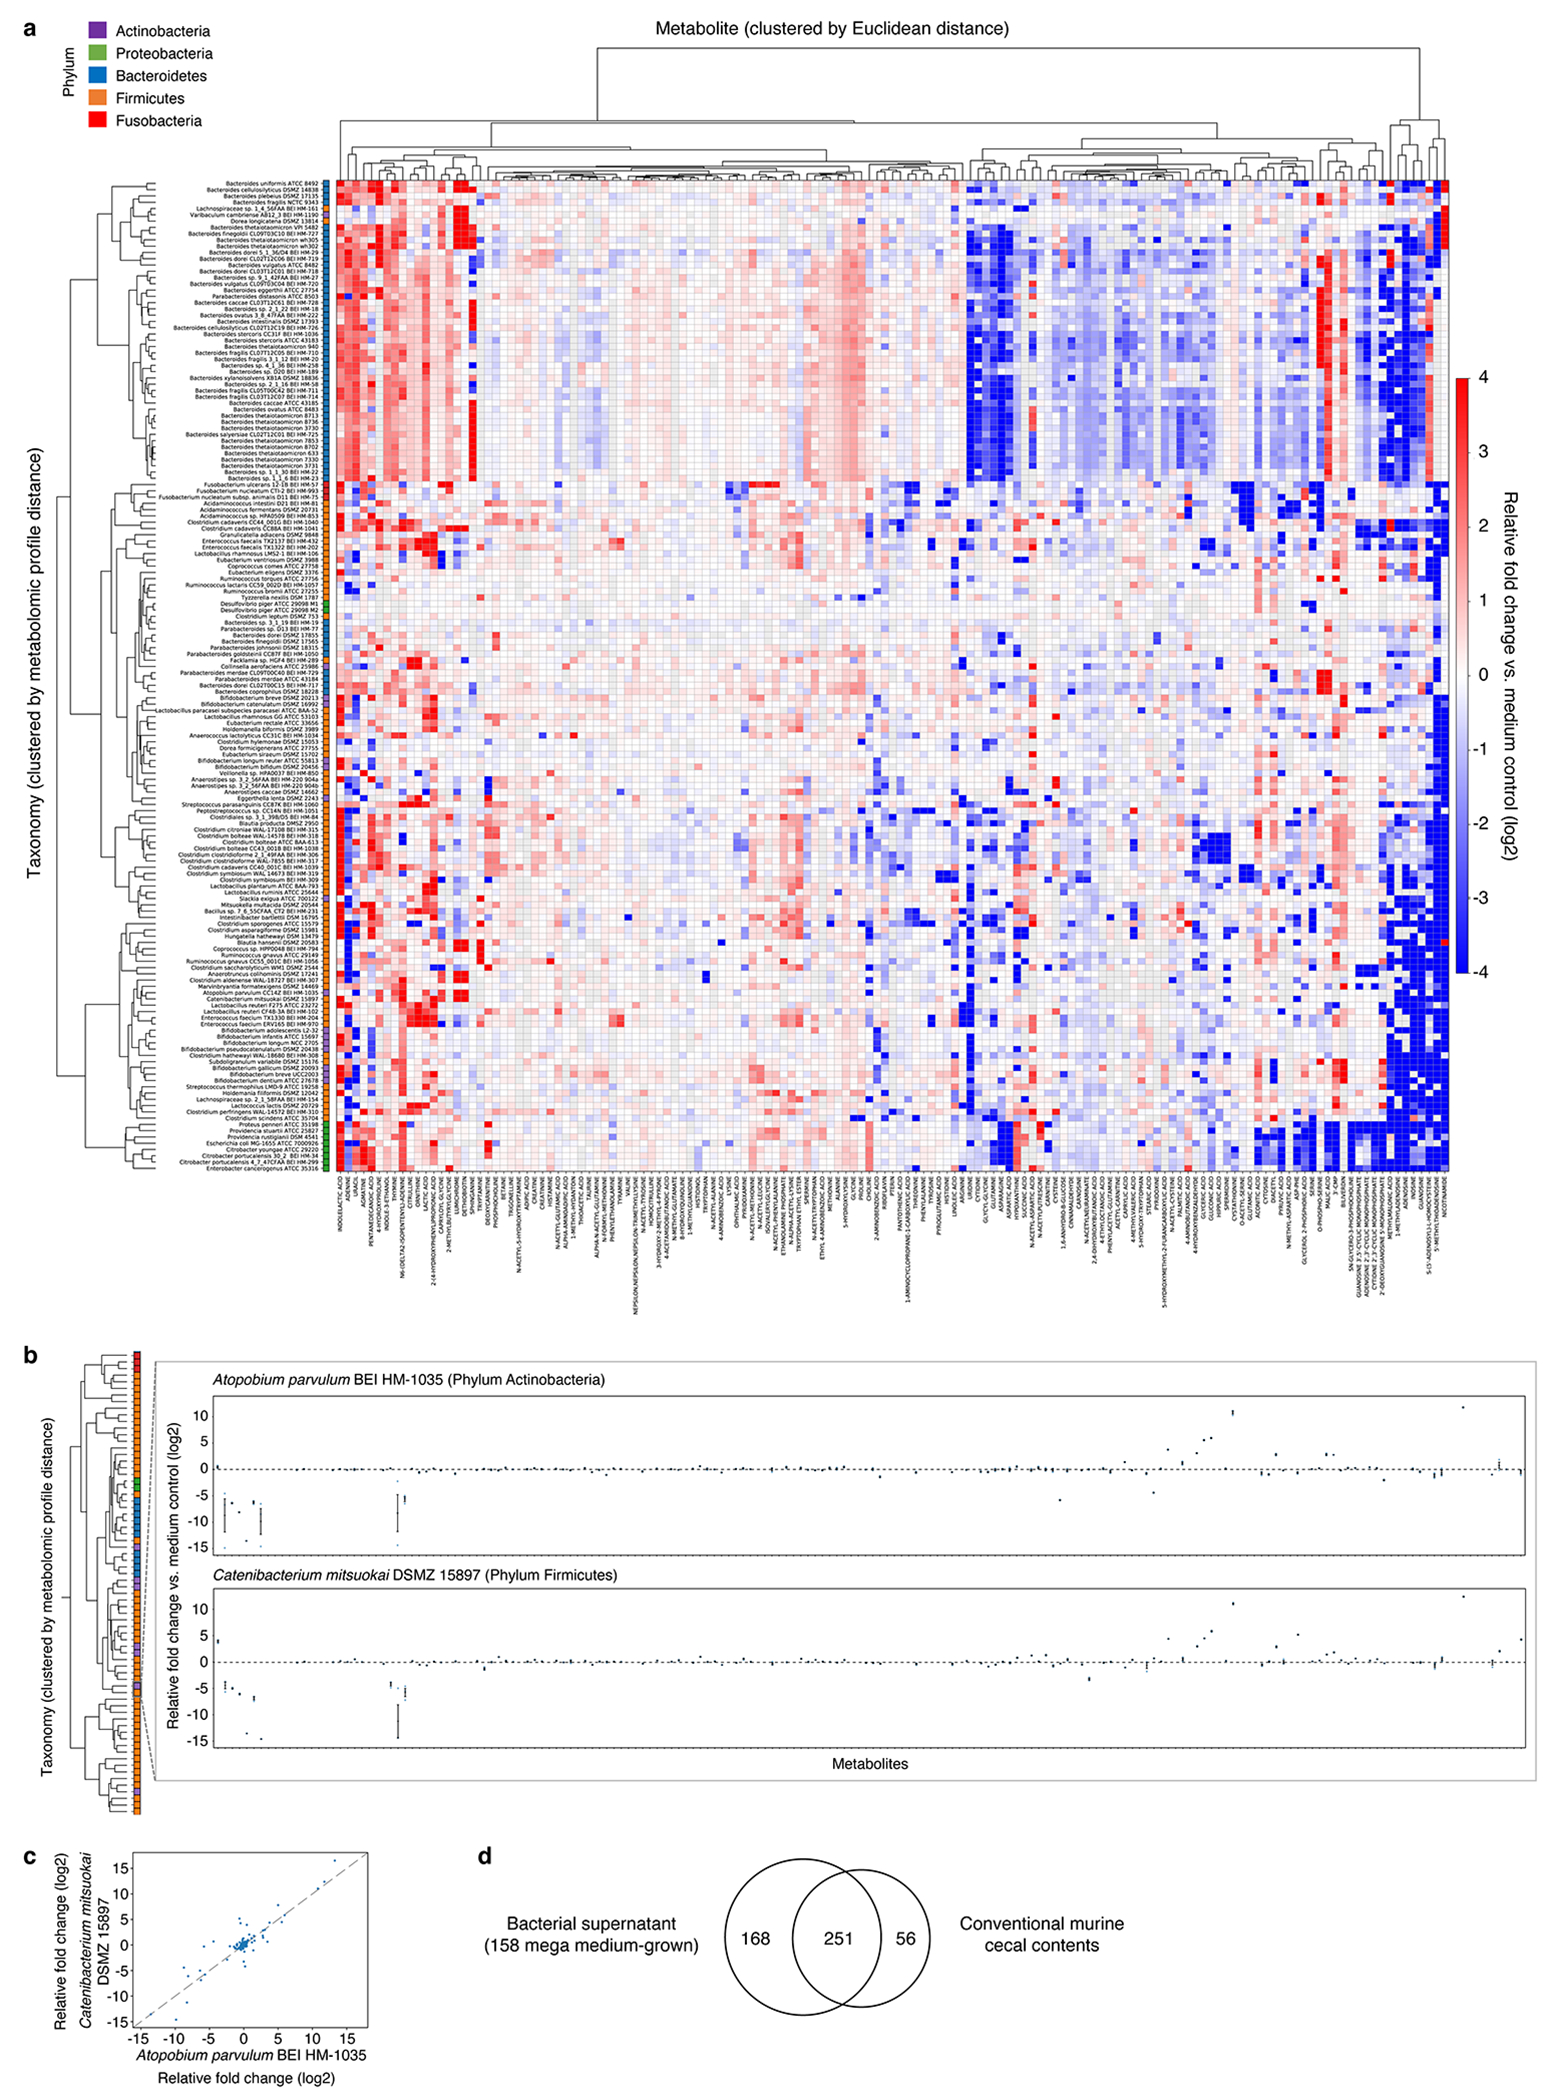
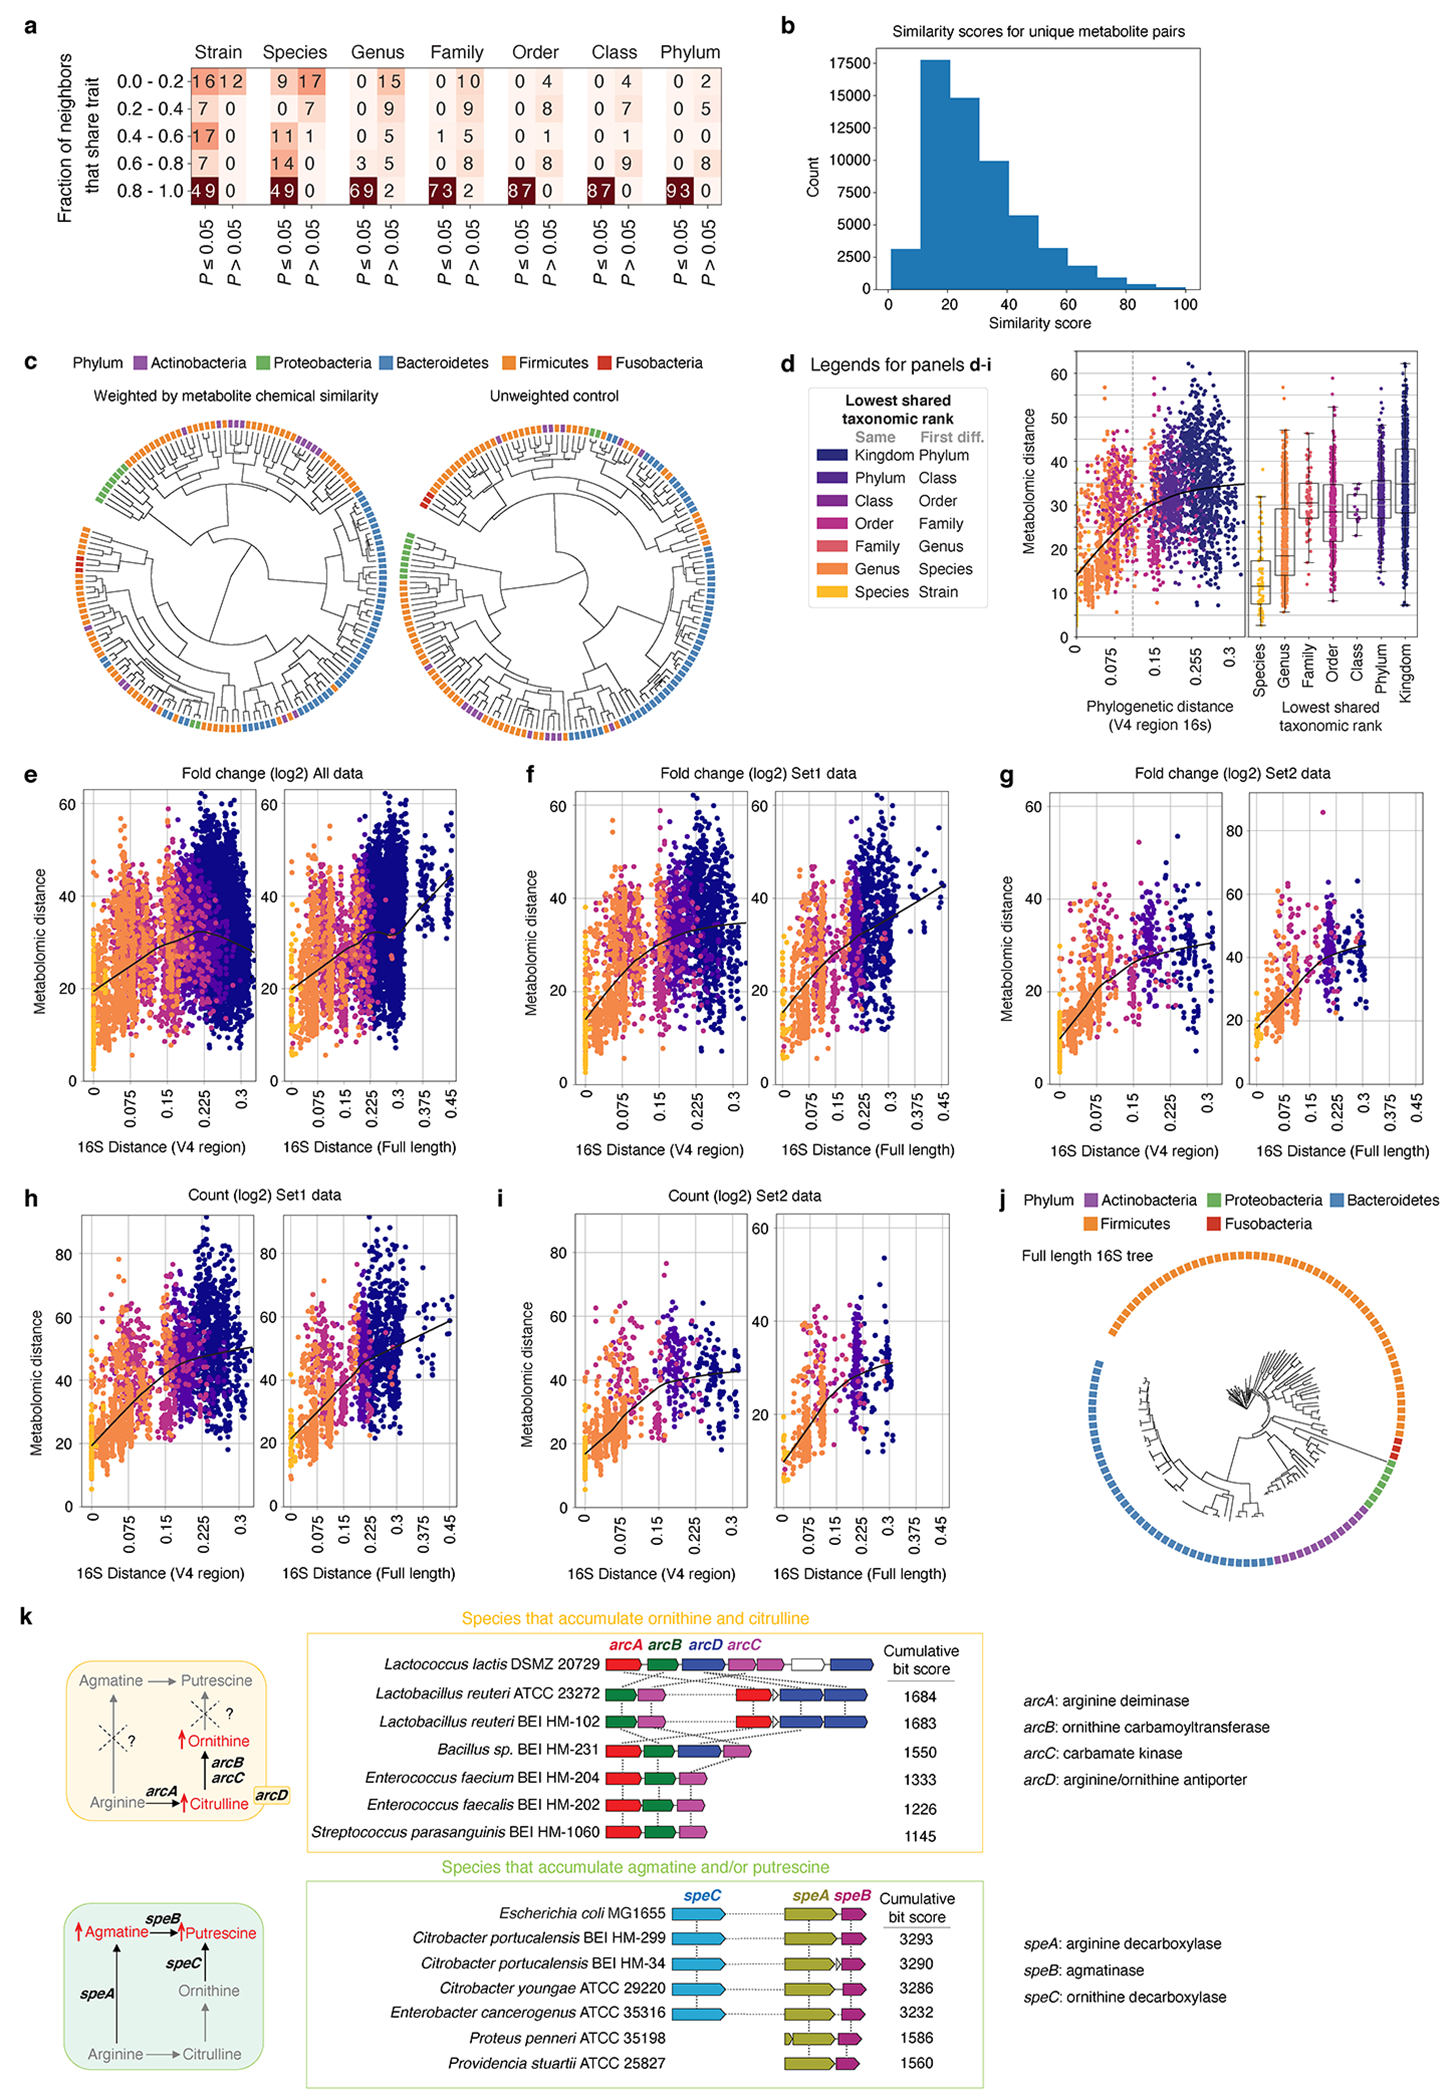
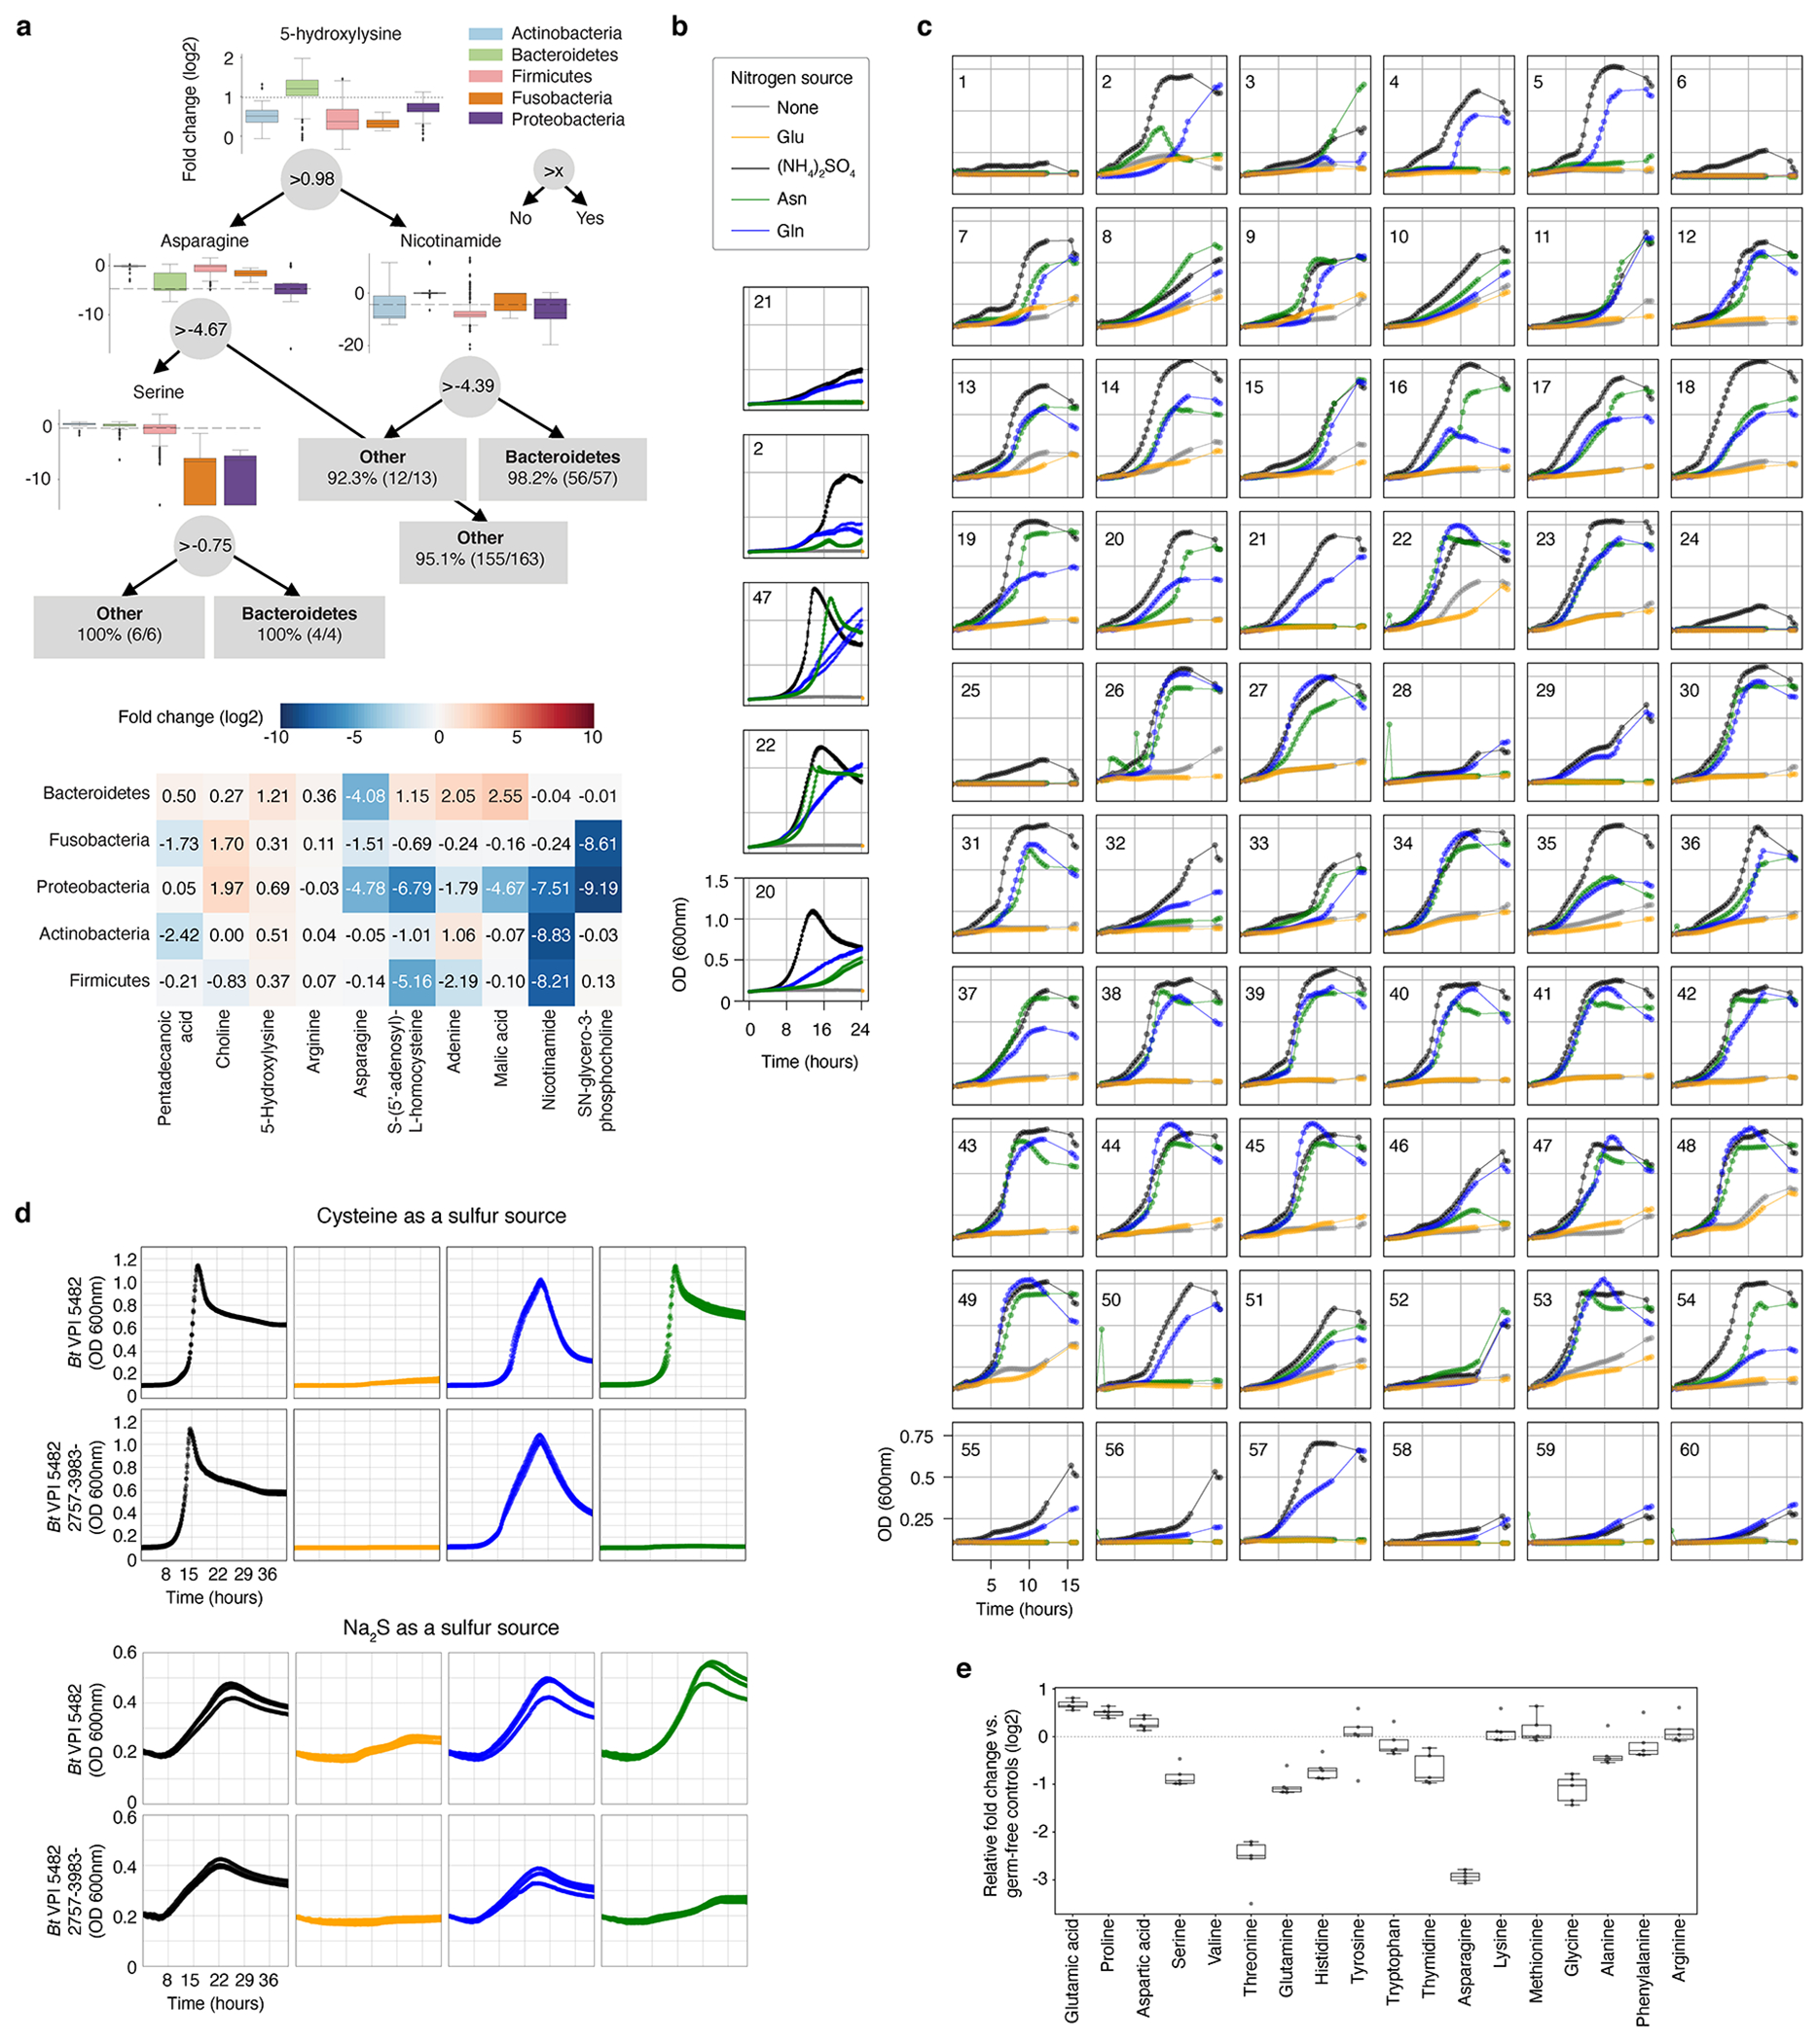
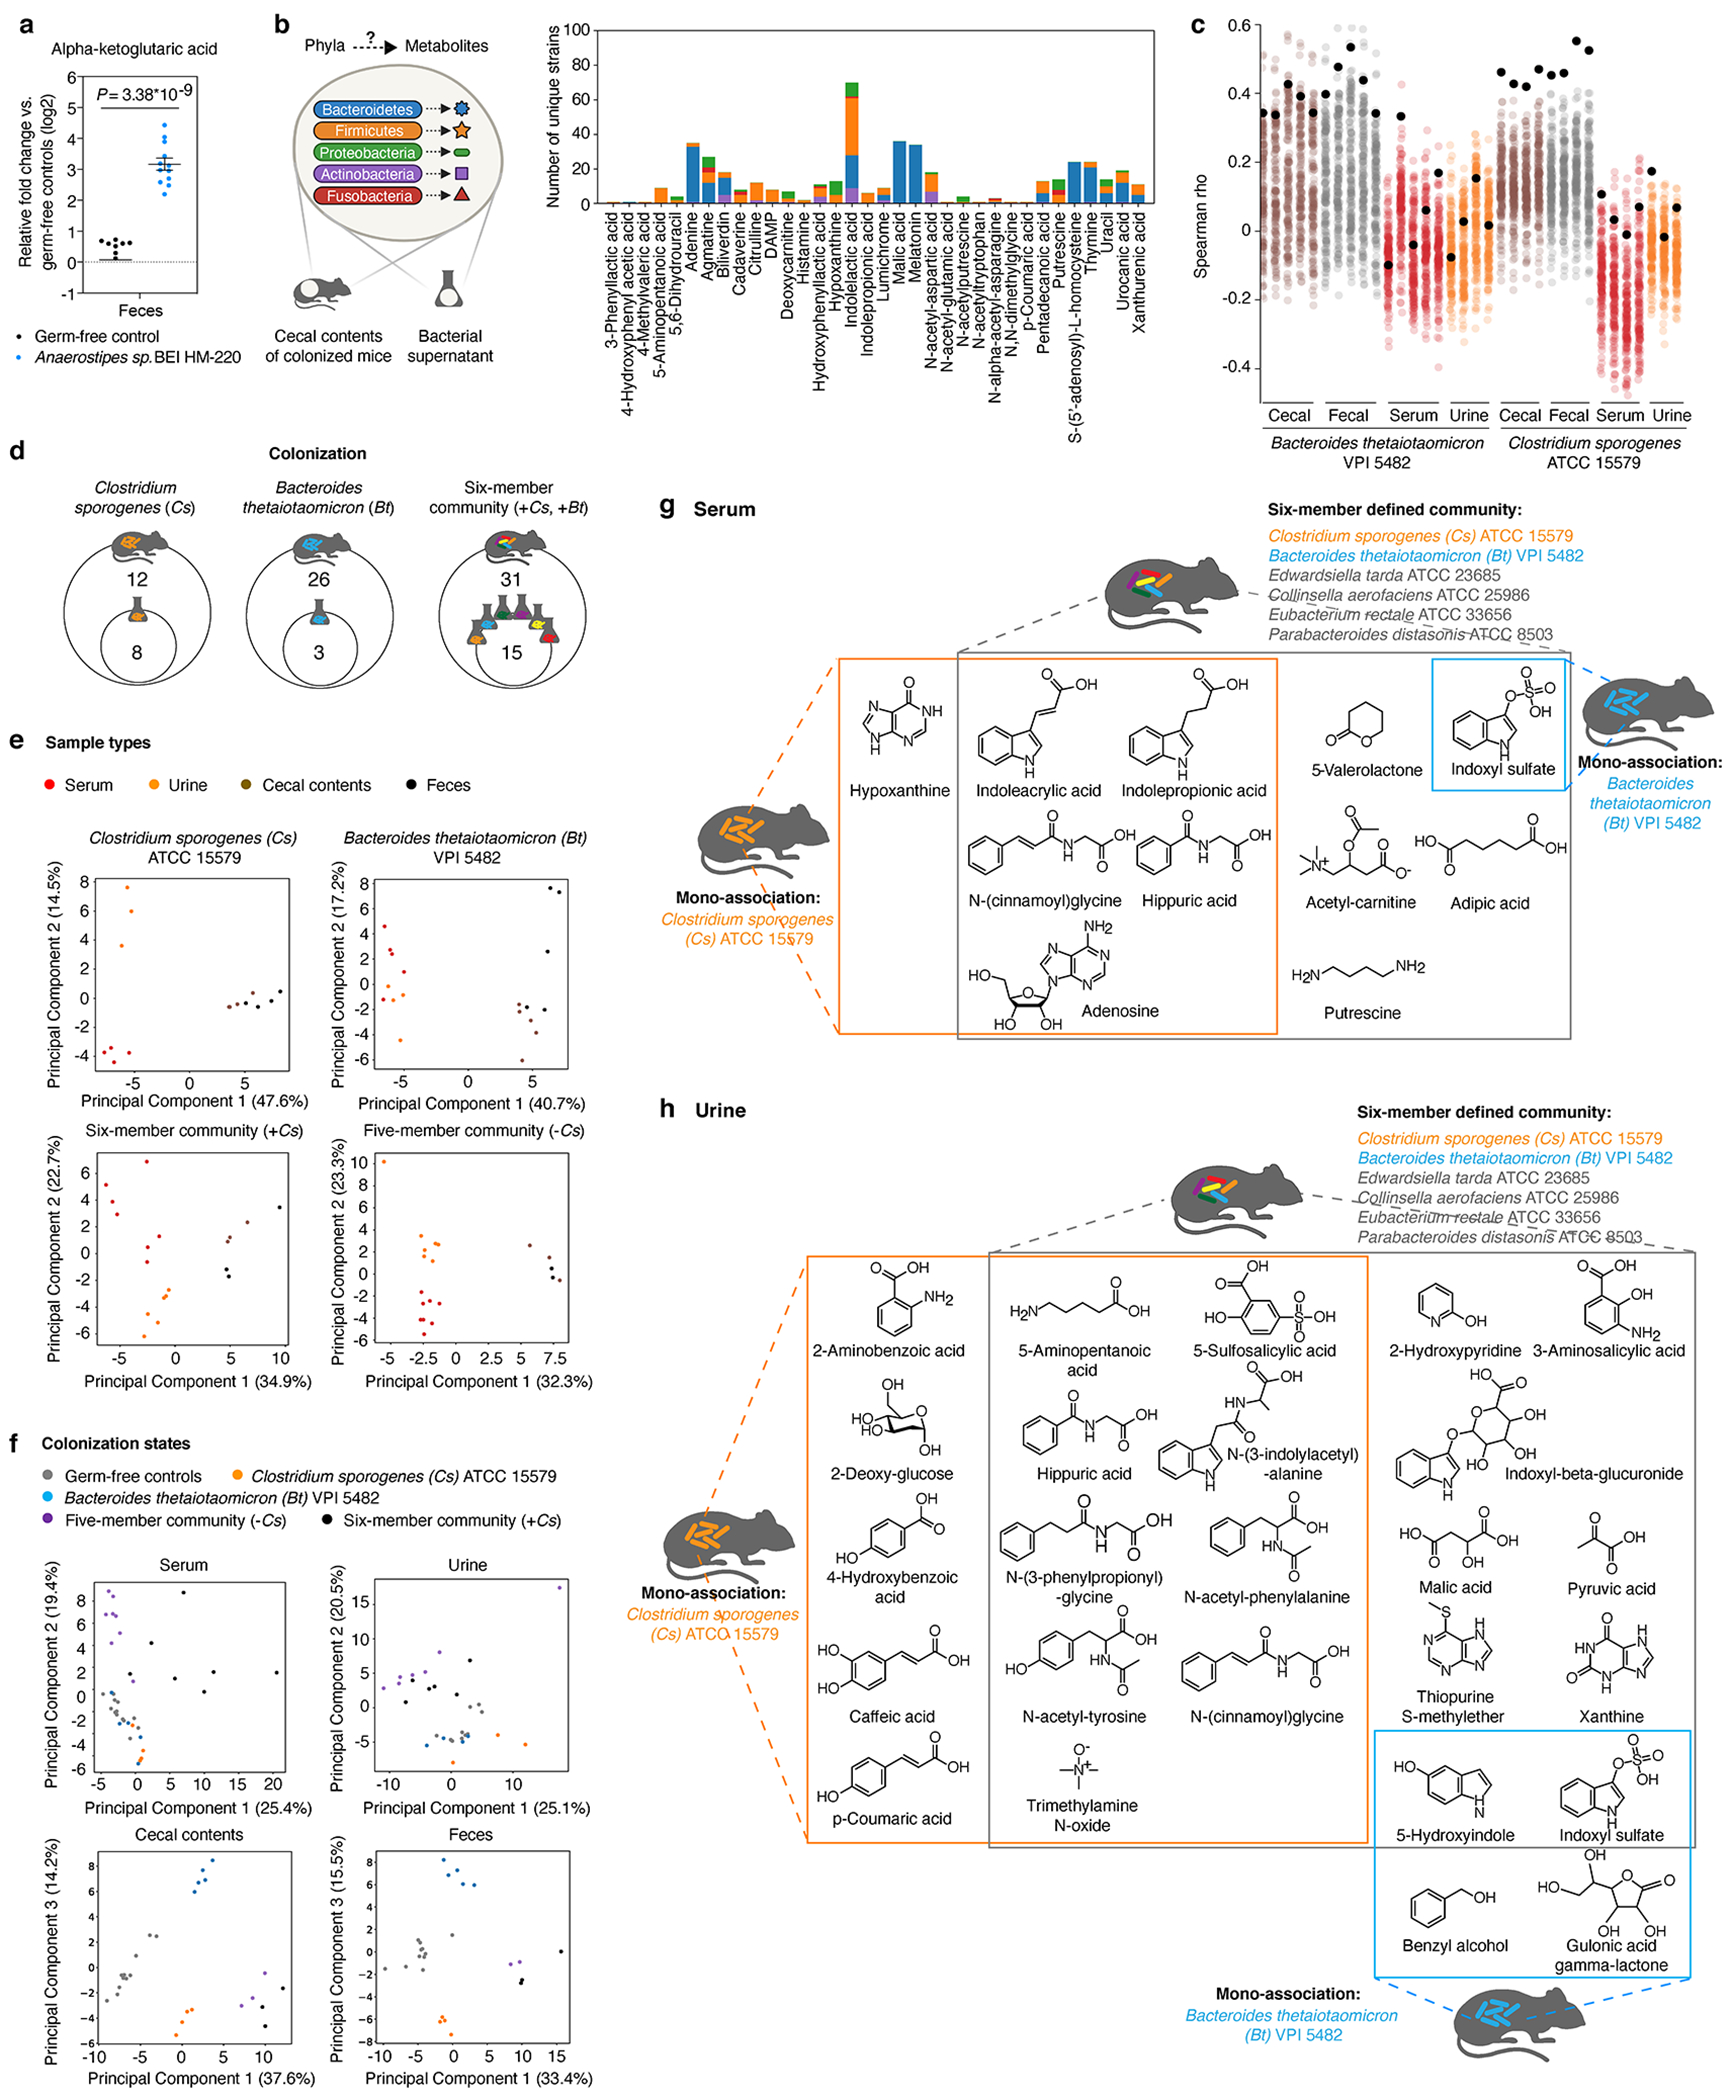
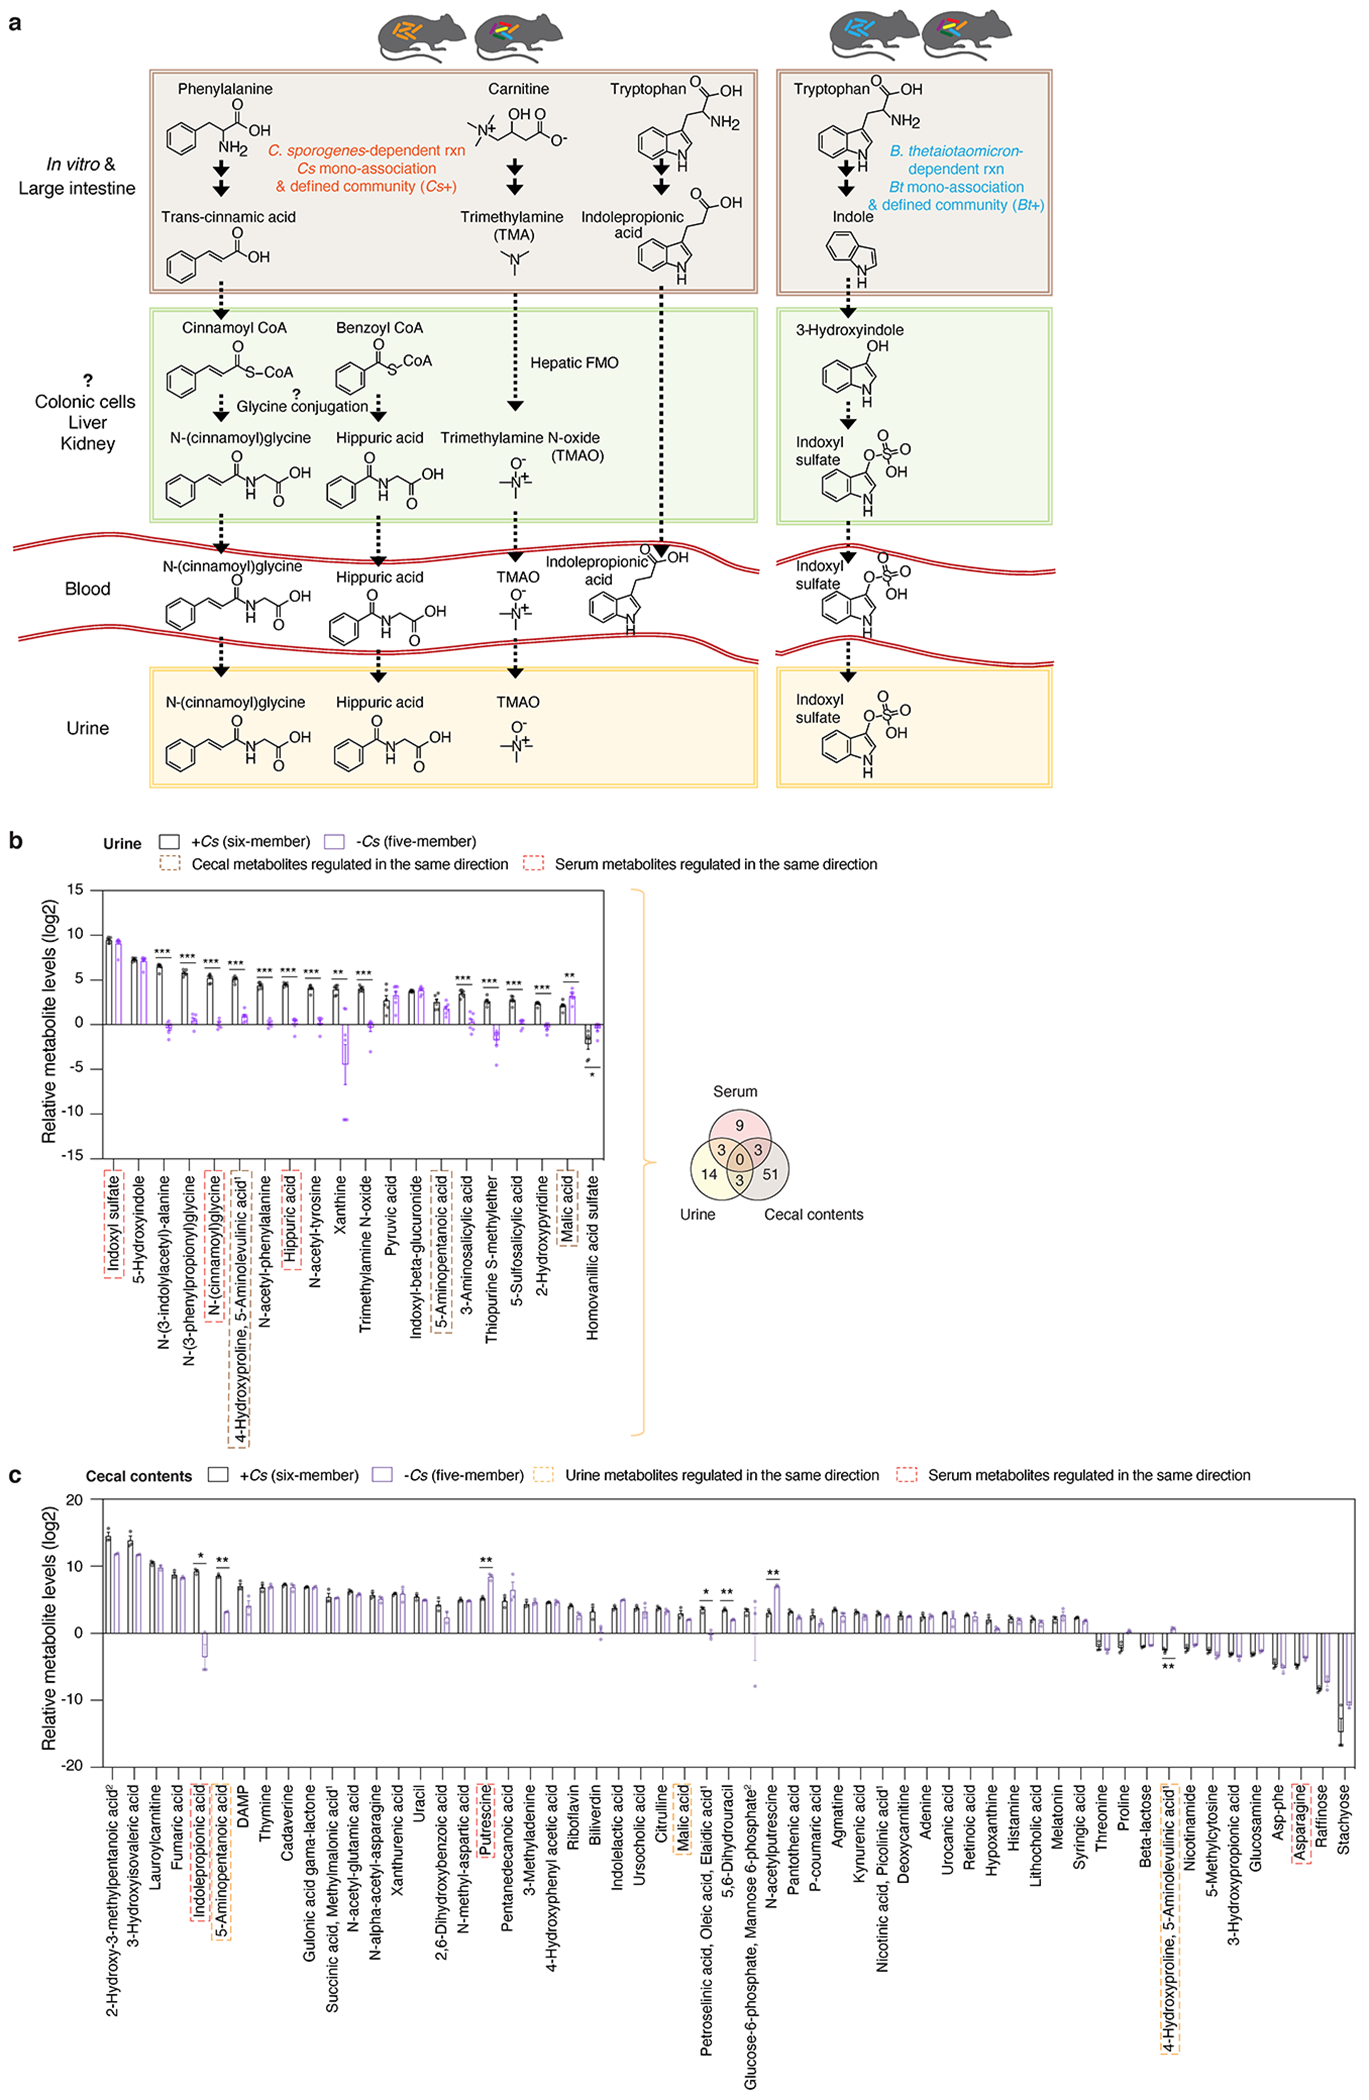
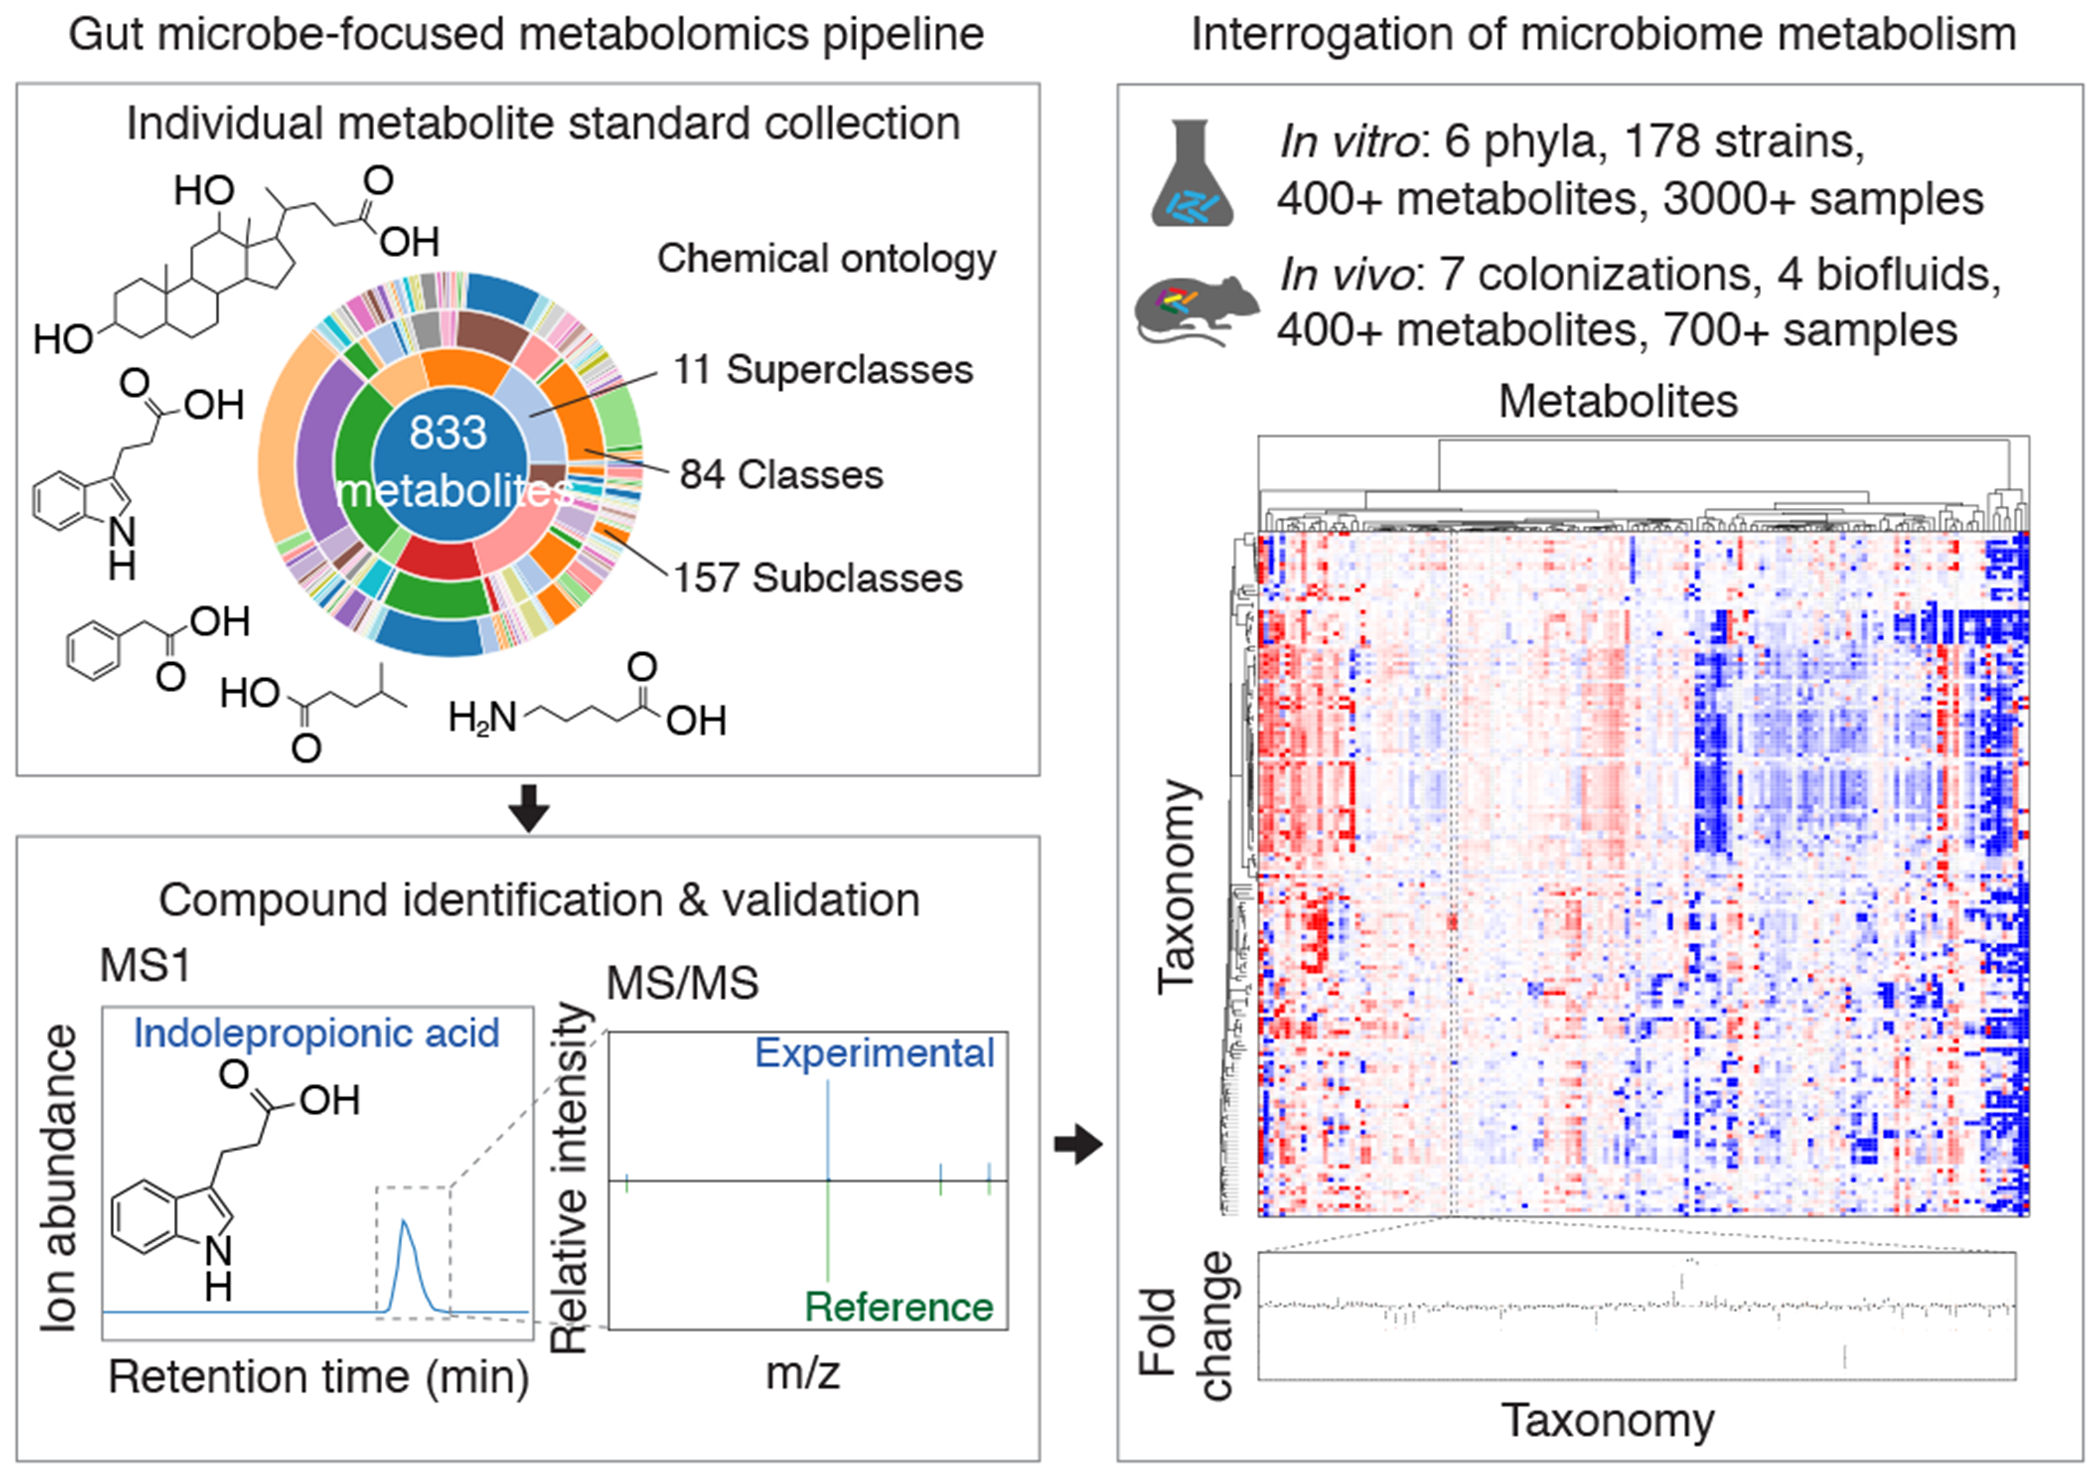
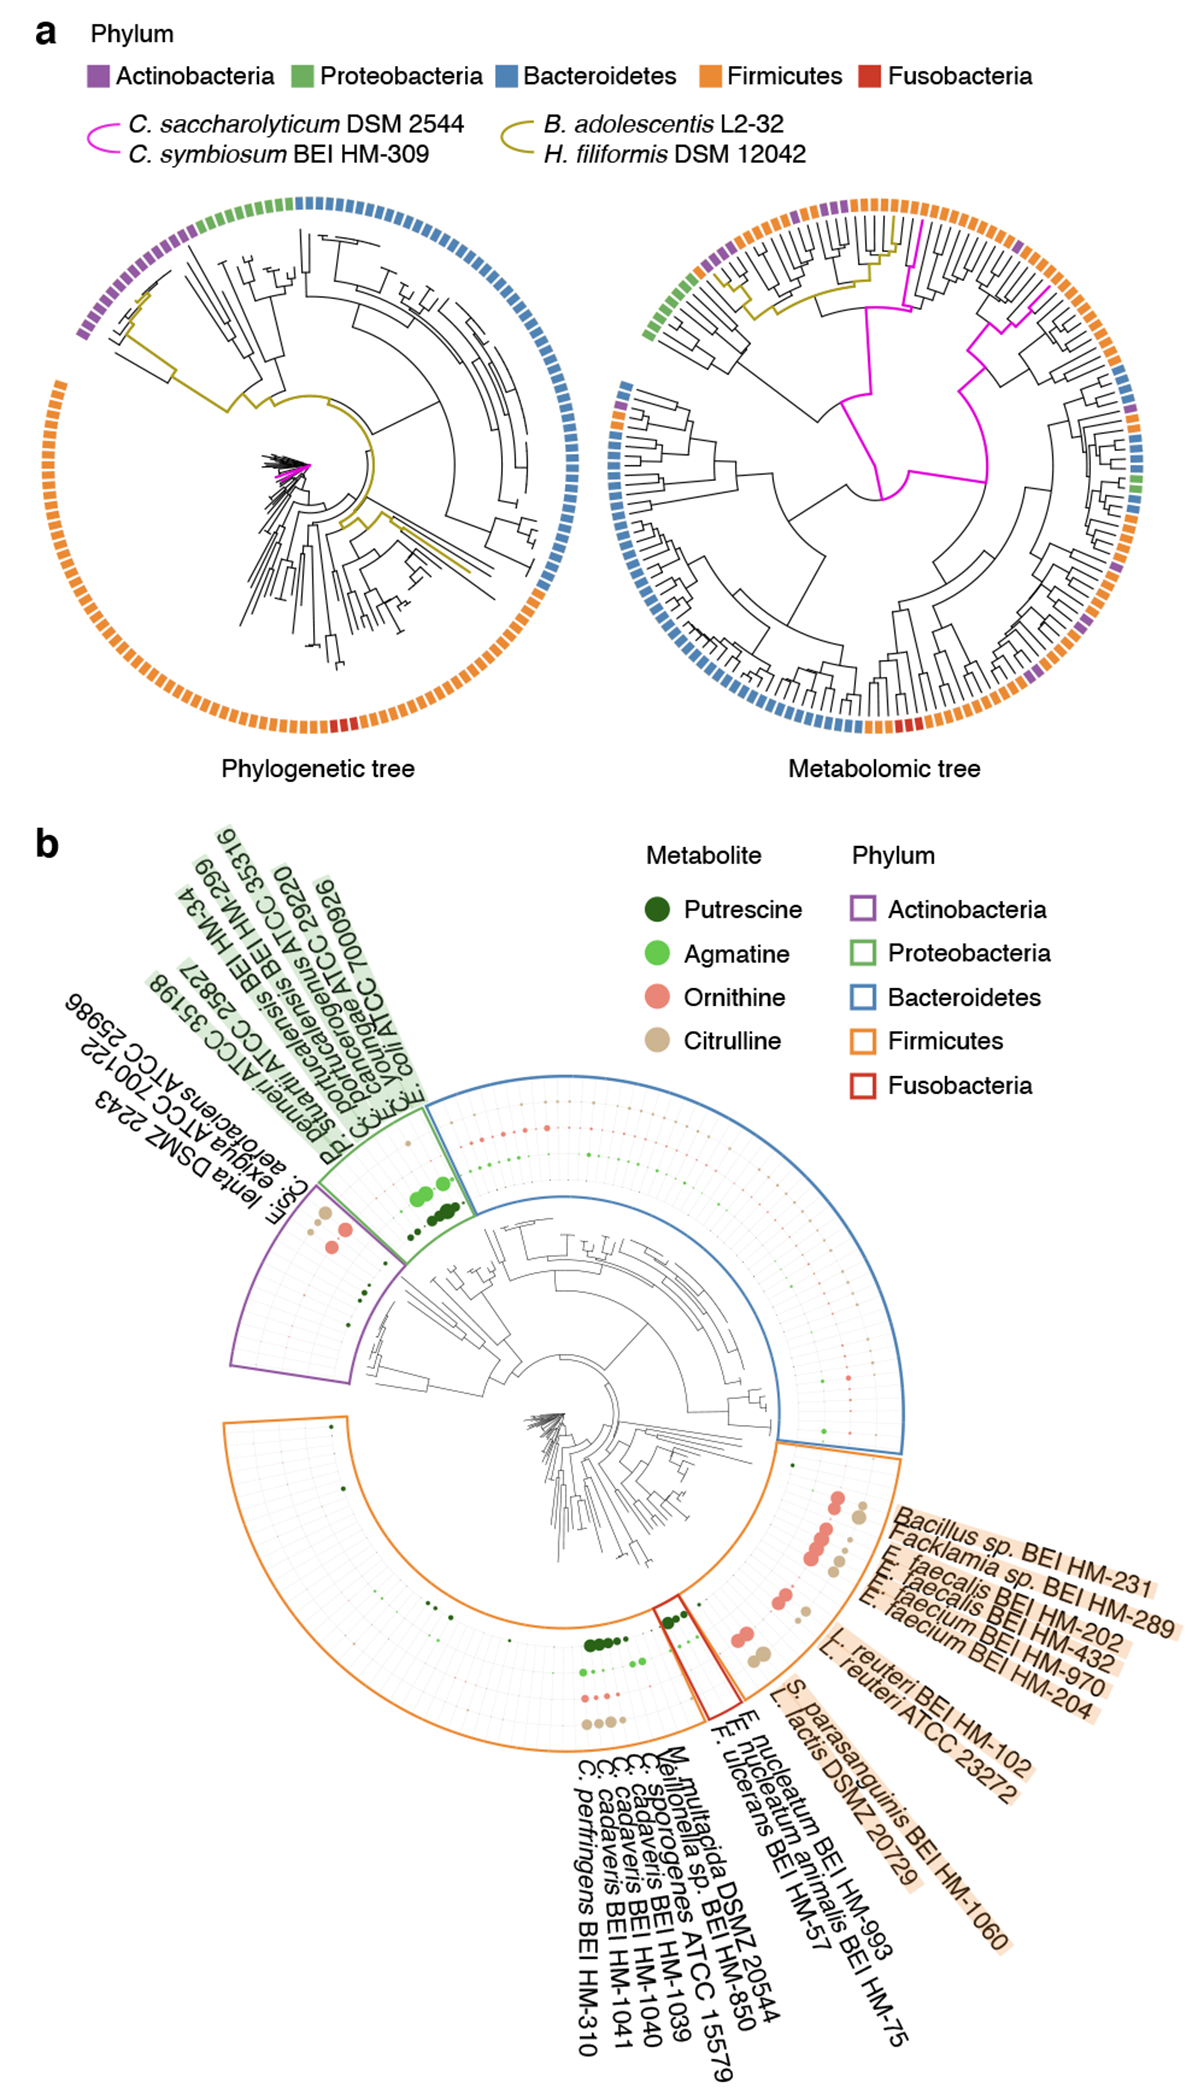
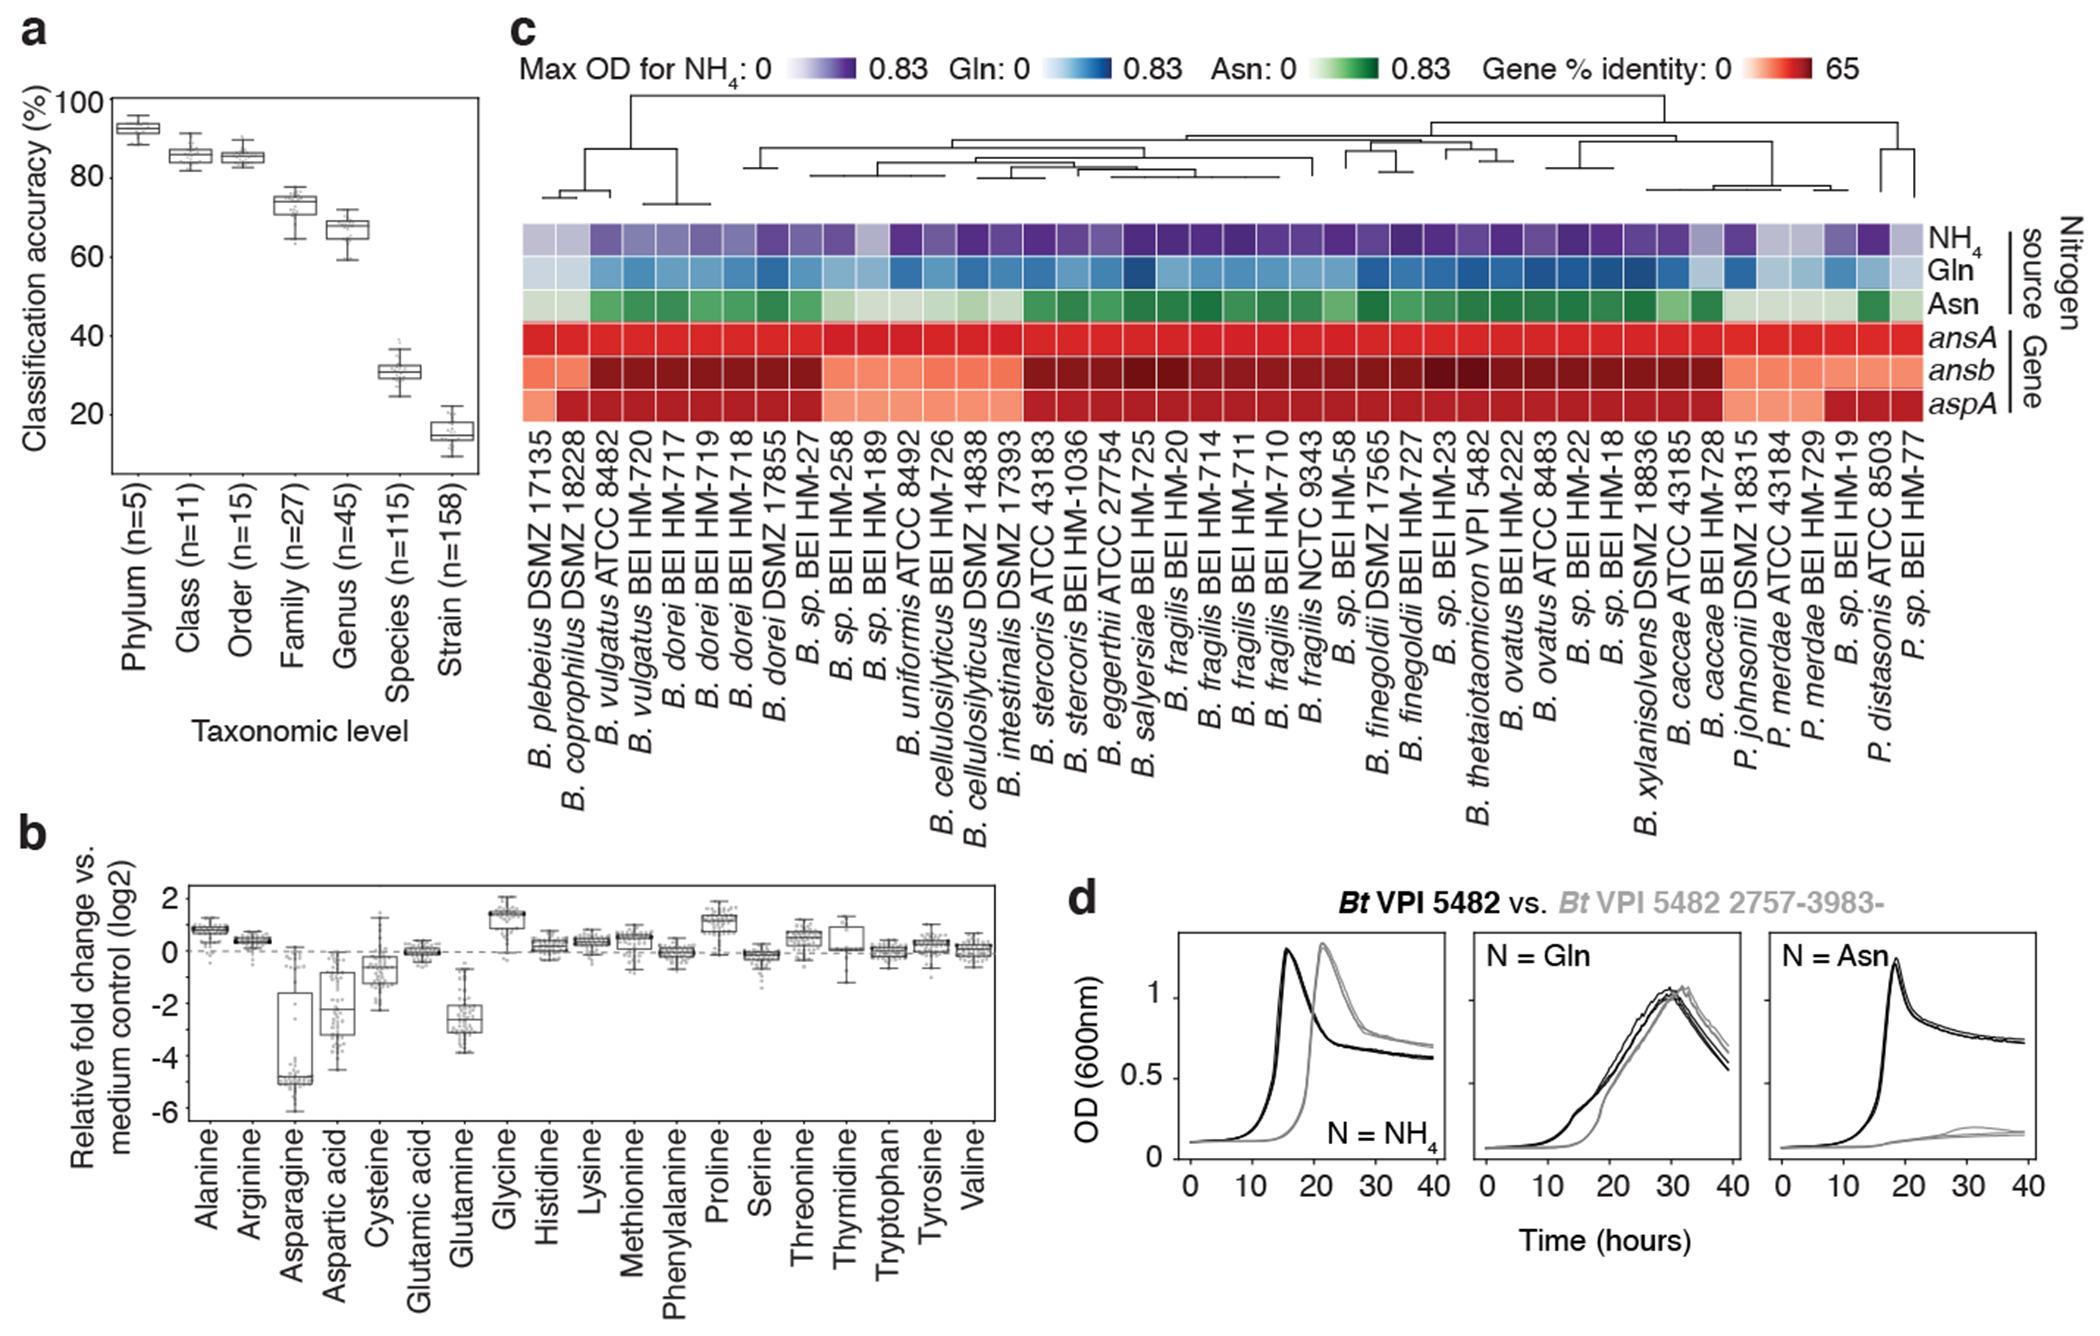
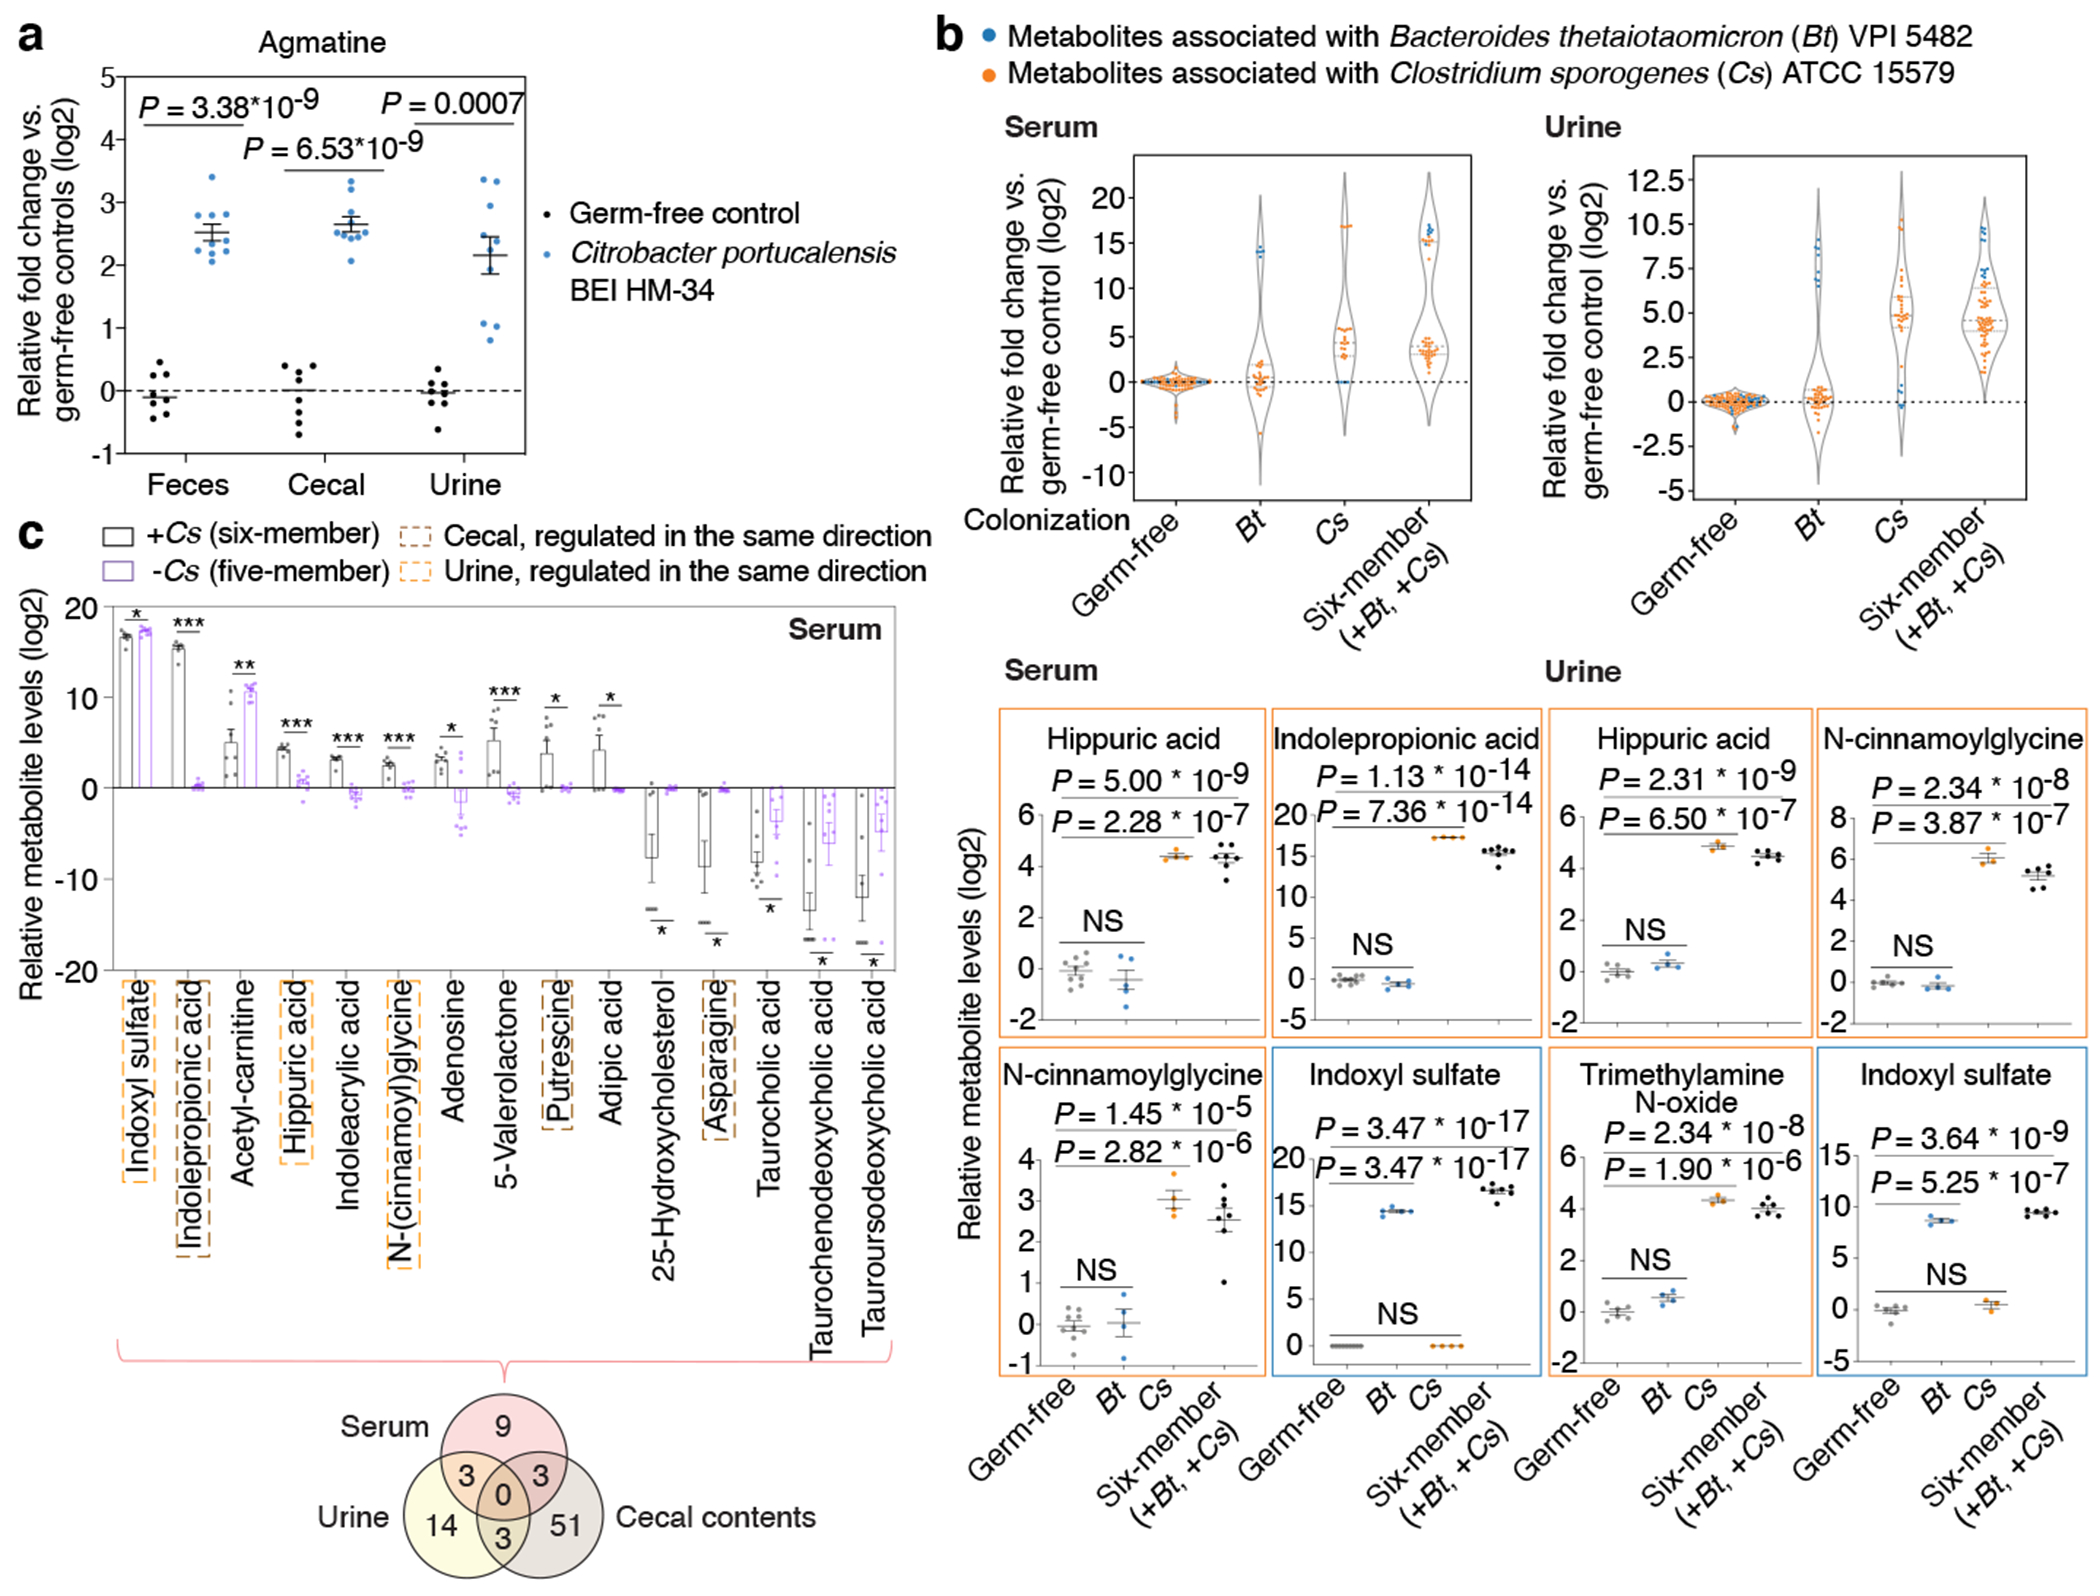
Gut microorganisms modulate host phenotypes and are associated with numerous health effects in humans, ranging from host responses to cancer immunotherapy to metabolic disease and obesity. However, difficulty in accurate and high-throughput functional analysis of human gut microorganisms has hindered efforts to define mechanistic connections between individual microbial strains and host phenotypes. One key way in which the gut microbiome influences host physiology is through the production of small molecules1-3, yet progress in elucidating this chemical interplay has been hindered by limited tools calibrated to detect the products of anaerobic biochemistry in the gut. Here we construct a microbiome-focused, integrated mass-spectrometry pipeline to accelerate the identification of microbiota-dependent metabolites in diverse sample types. We report the metabolic profiles of 178 gut microorganism strains using our library of 833 metabolites. Using this metabolomics resource, we establish deviations in the relationships between phylogeny and metabolism, use machine learning to discover a previously undescribed type of metabolism in Bacteroides, and reveal candidate biochemical pathways using comparative genomics. Microbiota-dependent metabolites can be detected in diverse biological fluids from gnotobiotic and conventionally colonized mice and traced back to the corresponding metabolomic profiles of cultured bacteria. Collectively, our microbiome-focused metabolomics pipeline and interactive metabolomics profile explorer are a powerful tool for characterizing microorganisms and interactions between microorganisms and their host.


Conflict of interest statement

Competing interests The authors declare no competing interests.

Figures

Extended Data Fig. 1,
Extended Data Fig. 1,. Summary statistics on mass spectrometry reference library metabolites, their detection, and validation.
a, Chemical similarity network of the compound library. Network nodes: library compounds colored by their superclasses. Node size: monoisotopic mass. Edges between nodes: substructure similarity values above a z-score threshold of 1 standard deviation from the mean. b, Scatter plots and histograms of chemical properties of 833 library metabolites. c, Venn diagram of library compounds that are detected by each of the three methods. d, Venn diagram of compounds (by PubChem CID) identified in the reference compound library (Supplementary Table 1), in vitro conditions (Supplementary Table 7, “count.ps”), and in vivo conditions (Supplementary Table 8, “istd_corr_ion_count_matrix”). In vitro conditions include all media types, and in vivo conditions include all sample types: urine, serum, feces, and cecal contents, and all colonization states. e, Scatterplot of all pairwise similarity scores (biological sample vs. library) of the same compound searched against the MoNA spectra database. All library standards (median similarity score = 992) and 97.3% of corresponding compounds from biological samples (median similarity score = 923) exhibit similarity scores ≥ 600, and 2.7% of those compounds from biological samples score below 600. Confidence levels are determined based on both similarity scores and visual validation of the MS/MS spectra. f, Schematic of the metabolomics pipeline’s data collection and analysis workflow. Created with Biorender.com
Extended Data Fig. 2,
Extended Data Fig. 2,. Schematic of a custom bioinformatics analysis pipeline that generates a metabolite fold-change matrix.
The pipeline integrates data across multiple experimental runs and minimizes intra-replicate, intra-experiment, and inter-experiment variability. The four steps detailed here are explained in depth in the Supplementary Methods (Custom bioinformatics: in vitro pipeline). Step 1: A database recording sample metadata (organism, media, growth data, etc.) and MS-DIAL output files are integrated into data matrices specific to each analytical method. Step 2: All data are grouped by replicate (Biological Sample Groups; BSGs) and analyzed to remove replicates with low intra-replicate correlation. Replicates are then grouped by experiment (EXPs) to assess inter-experiment variability. Transformations reducing inter-experiment variability are identified and compared. For metabolites that are detected by multiple methods, their ion counts are compared on a per-replicate and per-experiment basis to identify one or more methods that consistently detect these metabolites. Step 3: Using an internal standard-based correction, ion counts for individual samples are adjusted and transformed into different fold-change data matrices. Step 4: Data matrices corresponding to each method are combined into a single data matrix representing all detected metabolites.
Extended Data Fig. 3,
Extended Data Fig. 3,. High-throughput identification and analysis of diverse metabolites in complex biological matrices.
a, Number of unique compounds (by PubChem CID) within distinct chemical superclasses detected in the mz-RT reference library (n = 815, 11 superclasses), in vitro dataset (n = 458, 9 superclasses), or in vivo dataset (n = 551, 9 superclasses), excluding internal standards. Nine of the 11 chemical superclasses in the reference library are represented in metabolites detected in vitro and in vivo. The two remaining library superclasses (Organosulfur and Organometallic compounds) not represented in the experimental data contain one compound each. b, Diverse classes of metabolites identified in the conventional murine cecum. Representative metabolites shown are significantly elevated (≥ 4-fold, corrected P < 0.05) in the conventional mice vs. germ-free controls in one experiment with n = 3 (conventional) and n = 4 (germ-free) mice. P values: two-tailed t-test with Benjamini-Hochberg correction for multiple comparisons. c, Examples of precursor, intermediate, and products from the tryptophan fermentation pathway being identified by our methods both in vitro (Cs culture supernatant) and in vivo (Cs mono-association cecal contents). Extracted ion chromatogram peaks representing relative ion counts for each metabolite are shown. d, e, Histograms of changes in retention time (RT) (d) and total ion count (e) for 132 spike-in metabolites in five complex biological matrices using three analytical methods. All spiked-in metabolites show minimal change in RT, falling within a conservative ± 0.1 minute search window from their RTs as determined in the library control condition (d). The majority of spiked-in metabolites (e.g., 97% in feces) exhibit less than 4-fold change in ion counts relative to those detected at the library control condition (e). Representative examples of RT shifts (d) and changes in total ion counts (e) in individual metabolites in the mouse fecal matrix are shown. Mean ± s.e.m. of one experiment with n = 3 biological replicates. ean. f, Histograms of linear ranges of 377 reference library metabolites measured in serial dilutions. A representative linear range of 5-Hydroxyindole is shown. g, Violin plots (median, quartiles) of differences in RTs measured by three analytical methods between distinct mass spectrometry instruments: qTOF 6454 where the library was built vs. a second instrument qTOF 6530 for a shared panel of 219 reference library metabolites (upper panel) or vs. a second instrument orbitrap Q Exactive for a shared panel of 773 reference library metabolites (lower panel). Mean RT differences (in minutes) between two instruments by each method (C18 positive, C18 negative, and HILIC positive, respectively): qTOF vs. qTOF, upper panel (pre-correction: 0.238, 0.044, −0.110; post-correction: −0.023, −0.020, 0.015); qTOF vs. QE, lower panel (pre-correction: 0.151, 0.027, 0.196; post-correction: −0.040, −0.021, 0.026). Per method, RT correction was performed by polynomial transformation of the library based on inter-instrumental RT shifts of 10-20 robustly detected metabolites. Per method, using the corrected library with a RT tolerance window of 0.2 min, ~99% of the 219 metabolites tested on the second qTOF and ~94% of the 773 metabolites tested on the QE were correctly identified.
Extended Data Fig. 4,
Extended Data Fig. 4,. Conserved and unique metabolomic signatures across bacterial taxa.
a, Schematic of our high-throughput bacterial culture and sample collection workflow. Created with Biorender.com b, Intra-replicate Pearson correlation coefficients (triplicates and greater) stratified by 14 independent bacterial culture experiments and three analytical methods. For each experiment, Pearson correlation r values were calculated for all supernatant and media sample replicate groups: n = 346 (C18 positive), n = 344 (C18 negative), and n = 344 (HILIC positive). Total ion count data were corrected by internal standards and log transformed, standardized and scaled, prior to computing Pearson correlation values. Box: median, 25th, and 75th percentile; whiskers: Tukey’s method. c, Left panel: Number of medium-specific or common metabolites detected in the same bacterial strain grown in two different media (29 strains cultured in two or more of the 12 different media). Each dot represents the total number of metabolites from a single comparison between two media in which a strain has been grown: n = 58 (co-detected in two media), n = 116 (detected in one of the two media), n = 33 (detected in the mega medium), and n = 16 (detected in polyamine-free medium). Box: median, 25th, and 75th percentile; whiskers: minimum and maximum. Right panel: Agmatine production levels by B. eggerthii. Mean ± s.e.m from two to three independent experiments, each with n = 3 biological replicates. P values: two-tailed t-test with Benjamini-Hochberg correction for multiple comparisons. d, Heatmap of metabolomic profiles of 158 mega medium-grown bacterial strains, clustered by 16S phylogenetic distance. Individual metabolites are hierarchically-clustered (Ward’s method) using Euclidean distance between the fold-change (log2 transformed) values across all taxonomies. Metabolites shown are detected in at least 50% of the 158 taxonomies to enable Ward clustering. e, f, Production or consumption patterns of tyramine and pantothenic acid across 158 mega-medium grown strains. Mean ± s.e.m from one to three independent experiments (by dot color), each with n ≥ 3 biological replicates.
Extended Data Fig. 5,
Extended Data Fig. 5,. Metabolic profile variation among related bacteria.
a, Pairwise metabolomic profile comparisons between two closely related strains grown in mega medium: Clostridium sporogenes ATCC 15579 and Clostridium cadaveris HM-1039 (subpanel 1), and among four strains of Bacteroides fragilis (subpanels 2-7): HM-710, HM-711, HM-714, and HM-20. Each dot represents an averaged fold-change value (log2-transformed) from one to three independent experiments, each with n = 3 biological replicates. Pearson correlation r values of pairwise metabolomic profile comparisons, performed on standardized and scaled data: ATCC 15579 vs. HM-1039 (r = 0.063), HM-711 vs HM-710 (r = 0.859), HM-714 vs. HM-710 (r = 0.866), HM-714 vs. HM-711 (r = 0.880), HM-20 vs. HM-710 (r = 0.829), HM-20 vs. HM-711 (r = 0.845), and HM-20 vs. HM-714 (r = 0.807). b, Metabolic similarities and variations among closely related species of C. sporogenes and C. cadaveris, and among different strains of the same species of B. fragilis grown in mega medium. Taxonomies shown are clustered by 16S phylogenetic distance, and are colored by distinct phyla. Mean ± s.e.m. from one to three independent experiments, each with n = 3 biological replicates
Extended Data Fig. 6,
Extended Data Fig. 6,. Relationships between phylogeny, taxonomy, and metabolome.
a, Metabolomic profiles of 158 mega-medium grown bacterial strains. Individual taxonomies are clustered by metabolomic profile distances (fold change, log2 transformed) across all metabolites. Individual metabolites are hierarchically-clustered (Ward’s method) using Euclidean distance between the fold-change (log2 transformed) values across all taxonomies. Metabolites shown are detected in at least 50% of the 158 taxonomies to enable Ward clustering. b, Metabolic similarities between two phylogenetically distant species grown in mega medium. Taxonomies are clustered by metabolomic profile distances (fold change, log2 transformed) across all metabolites. Mean ± s.e.m. of one experiment with n = 3 biological replicates. c, Scatter plot of pairwise metabolomic profile comparison between two phylogenetically distant species. Each dot represents an averaged fold-change value (log2-transformed) of one experiment with n = 3 biological replicates. Pearson correlation of pairwise metabolomic profile comparison between these two species, performed on standardized and scaled fold-change data, r = 0.7090. d, Venn diagram of unique and overlapping compounds (by PubChem CID) identified in culture supernatant of 158 mega-medium grown strains and cecal contents of conventional mice.
Extended Data Fig. 7,
Extended Data Fig. 7,. Multiple data transformations identify non-linear relationship between phylogenetic and metabolomic distance.
a, Heatmap showing comparison of phylogenetic and metabolomic tree topologies. Cells record the number of tips whose neighborhoods share more overlap than expected (P < 0.05; one-sided permutation test). Data are stratified by fractional overlap of neighborhoods and permutation probability (Supplementary Methods: Distance Comparisons). b, Histogram of chemical similarity scores (based on Tanimoto 2D structures) between each unique pair of compounds (by PubChem CID) detected in the in vitro dataset. 359 non-coeluting compounds were used for this pairwise comparison. c, Metabolomic distance tree with each metabolite weighted based on their chemical similarity (left) or unweighted control metabolomic distance tree (right). The weighted and unweighted matrices were calculated using uniquely detected, non-coeluting compounds in the in vitro dataset, where a unique PubChem CID identifier can be assigned to each compound. Two-sided Mantel test for comparison between the weighted and unweighted distance matrices: r2 = 0.863, P = 0.001. d, Left panel: Correlation of phylogenetic and metabolomic distance across pairs of strains colored by lowest shared taxonomic rank with a LOESS fit shown. Right panel: Metabolomic distance between pairs of strains binned by the lowest shared taxonomic rank. Species (n = 111), Genus (n = 1386), Family (n = 159), Order (n = 1222), Class (n = 34), Phylum (n = 1442), and Kingdom (n = 8442). Box: median, 25th, and 75th percentile; whiskers: Tukey’s method. Internal standard (IS)-corrected fold-change data (e-g) and IS-corrected total ion count data (h, i) were log-transformed and used to calculate pairwise metabolomic distances between microbial taxa. These distances were compared to the corresponding pairwise phylogenetic distances generated from a tree built with the V4 region of 16S (left column) or the full-length 16S gene (right column). Data are plotted with a LOESS fit. Set1: microbes grown in at least one experiment simultaneously. Set2: microbes grown in the same experiment only. j, Phylogenetic tree constructed using full 16S sequences of a subset of the mega-medium grown strains. Only strains with available full 16S sequences are shown (Supplementary Table 6). k, Left panel: Schematic of the pathway that synthesizes citrulline and ornithine, or synthesizes agmatine and/or putrescine. Right panel: The top six matches identified by the comparative genomics tool MultiGeneBlast within a 40-kb search window, when searched against a genomic database of our strain collection with sequenced genomes. Horizontal dashed lines between genes represent multiple other genes present within the search window.
Extended Data Fig. 8,
Extended Data Fig. 8,. Asparagine and glutamine can be utilized as sole nitrogen sources by most tested Bacteroidetes.
a, Top panel: An example decision tree from a forest that can differentiate Bacteroidetes vs. bacteria from the other four represented phyla with > 97% accuracy. For each decision node, phylum-level elevation and reduction based on metabolite levels are shown (relative fold change to bacterial media controls, log2 transformed). Actinobacteria (n = 20), Bacteroidetes (n = 57), Firmicutes (n = 83), Fusobacteria (n = 3), and Proteobacteria (n = 10). Dashed line: metabolite threshold. Box: median, 25th, and 75th percentile; whiskers: Tukey’s method. Bottom panel: The 10 most important features differentiating the five tested phyla. Data are shown as median metabolite log2 fold-change for each phylum; metabolites and phyla are ordered by Ward linkage distance. b, Representative growth curves from two independent experiments, each with n = 3 biological replicates for a subset of Bacteroides spp. using modified Salyer’s Minimal Medium (SMM) with indicated nitrogen source. Legend colors for sole nitrogen source are maintained for panels b-d. c, Representative growth curves of one experiment with n = 5 biological replicates for 60 Bacteroidetes using modified SMM with indicated nitrogen sources. d, Growth curves of wild-type and mutant Bt grown in defined minimal media with either cysteine (top) (one experiment, n = 3 biological replicates) or sodium sulfide (Na2S, bottom) as sole reduced sulfur sources (one experiment, n = 3 biological replicates). e, Amino acid production and consumption levels in gnotobiotic mice mono-associated with Bacteroides thetaiotaomicron (Bt) (one experiment, n = 5 mice). Box: median, 25th, and 75th percentile; whiskers: Tukey’s method). Numeric labels in b and c correspond to the following: 1: B. acidifaciens DSMZ 15896, 2: B. caccae ATCC 43185, 3: B. caccae BEI HM-728, 4: B. cellulosilyticus BEI HM-726, 5: B. cellulosilyticus DSMZ 14838, 6: B. coprophilus DSMZ 18228, 7: B. dorei BEI HM-29, 8: B. dorei BEI HM-717, 9: B. dorei BEI HM-718, 10: B. dorei BEI HM-719, 11: B. dorei DSMZ 17855, 12: B. eggerthii ATCC 27754, 13: B. eggerthii DSMZ 20697, 14: B. finegoldii BEI HM-727, 15: B. finegoldii DSMZ 17565, 16: B. fragilis BEI HM-20, 17: B. fragilis BEI HM-710, 18: B. fragilis BEI HM-711, 19: B. fragilis BEI HM-714, 20: B. fragilis NCTC 9343, 21: B. intestinalis DSMZ 17393, 22: B. ovatus ATCC 8483, 23: B. ovatus BEI HM-222, 24: B. pectinophilus ATCC 43243, 25: B. plebeius DSMZ 17135, 26: B. salyersiae BEI HM-725, 27: B. sp. BEI HM-18, 28: B. sp. BEI HM-189, 29: B. sp. BEI HM-19, 30: B. sp. BEI HM-22, 31: B. sp. BEI HM-23, 32: B. sp. BEI HM-258, 33: B. sp. BEI HM-27, 34: B. sp. BEI HM-28, 35: B. sp. BEI HM-58, 36: B. stercoris ATCC 43183, 37: B. stercoris BEI HM-1036, 38: B. thetaiotaomicron 3730, 39: B. thetaiotaomicron 3731, 40: B. thetaiotaomicron 633, 41: B. thetaiotaomicron 7330, 42: B. thetaiotaomicron 7853, 43: B. thetaiotaomicron 8702, 44: B. thetaiotaomicron 8713, 45: B. thetaiotaomicron 8736, 46: B. thetaiotaomicron 940, 47: B. thetaiotaomicron VPI 5482, 48: B. thetaiotaomicron wh302, 49: B. thetaiotaomicron wh305, 50: B. uniformis ATCC 8492, 51: B. vulgatus ATCC 8482, 52: B. vulgatus BEI HM-720, 53: B. xylanisolvens DSMZ 18836, 54: P. distasonis ATCC 8503, 55: P. distasonis BEI HM-169, 56: P. johnsonii BEI HM-731, 57: P. johnsonii DSMZ 18315, 58: P. merdae ATCC 43184, 59: P. merdae BEI HM-729, 60: P. merdae BEI HM-730.
Extended Data Fig. 9,
Extended Data Fig. 9,. Metabolic contribution by individual gut microbes in a multi-species community.
a, Alpha-ketoglutaric acid levels in feces of mice mono-colonized with Anaerostipes sp. BEI HM-220. Mean ± s.e.m. of two independent experiments, each with n = 4 mice (germ-free) or n = 5 or 7 mice (Anaerostipes mono-colonized). b, Left panel: MDMs were associated with specific bacterial phyla leveraging both in vivo and in vitro metabolomic data. Right panel: Number of mega-medium grown bacterial strains by phylum that produce MDMs identified in the cecal contents of mice colonized with Bacteroides thetaiotaomicron (Bt, n = 5), or Clostridium sporogenes (Cs, n = 3), or a six-member community (n = 3). Number of strains that produce at least one of these metabolites in vitro by phylum: Bacteroidetes: n = 52, Firmicutes: n = 60, Proteobacteria: n = 8, Actinobacteria: n = 16, and Fusobacteria: n = 3. Each metabolite shown was significantly produced both in vitro and in vivo (≥ 4-fold, corrected P < 0.05). Uniquely detected (non-coeluting) metabolites are shown (Supplementary Table 9) .c, Spearman correlation between metabolomic profiles (standardized and scaled, log2-transformed, fold-change data) of individual Bt- or Cs-mono-associated host biofluids (cecal contents, feces, serum, or urine) and individual bacterial culture (158 mega-medium grown). Colored dots: Spearman’s rho values calculated by comparing metabolomic profiles of individual bacterial culture vs. individual biofluid of either Bt- or Cs-mono-associated mice. Black dots: Spearman’s rho calculated using metabolomic profiles of Bt or Cs, the same strains used for mono-association in mice. d, Venn diagram of overlapping metabolites that are significantly produced (≥ 4-fold, corrected P < 0.05) in culture and in the cecum of colonized mice. e, Principal component analysis (PCA) separates metabolomic profiles of identified metabolites by sample type in each colonization state. P values on metabolomic profile comparisons between different sample types of the same colonization state were determined using PERMANOVA: six-member community (P = 0.073), and all other colonization states (P = 0.001). f, PCA separates metabolomic profiles of identified metabolites by colonization states. P values on metabolomic profile comparisons between different colonization states of the same sample type were determined using PERMANOVA: P = 0.001 for all four sample types. g, h, Example chemical structures of significantly produced metabolites (≥ 4-fold, corrected P < 0.05) in serum (g) or urine (h) by each colonization state corresponding to Fig. 4b. P values in a, b, d, g, h: two-tailed t-test with Benjamini-Hochberg correction for multiple comparisons.
Extended Data Fig. 10,
Extended Data Fig. 10,. Metabolic contribution of multi-species communities in gnotobiotic mice.
a, Proposed host-microbial co-metabolism pathways that could lead to the synthesis of specific host-microbial co-metabolites in the urine and serum of mice colonized with the six-member community. b, c, Metabolite levels in urine (b) and cecal contents (c) of mice colonized with the six-member community (+Cs) or the five-member community (−Cs). Metabolites shown represent a panel of significantly elevated or reduced metabolites (≥ 4-fold, corrected P < 0.05) in the six-member community. Superscript “1”: co-eluting metabolites as annotated in the mass spectrometry reference library (Supplementary Table 1). Superscript “2”: co-eluting isomeric metabolites with truncated names in the figure (“2-Hydroxy-3-methylpentanoic acid, 2-Hydroxy-4-methylpentanoic acid”, and “Alpha-galactose 1-phosphate, Alpha-glucose 1-phosphate, Glucose-6-phosphate, Mannose 6-phosphate”). Mean ± s.e.m. of one experiment with n = 6 (urine, six-member community), n = 7 (urine, five-member community), and n = 3 (cecal, both six-member and five-member communities). b, c, P values: two-tailed t-test with Benjamini-Hochberg correction for multiple comparisons. * P < 0.05, ** P < 0.01, *** P < 0.001. Venn diagram (b) of significantly elevated and reduced metabolites in individual host biofluids (cecal contents, serum, and urine) using the same threshold in b.
Fig. 1,
Fig. 1,. A microbiome-focused metabolomics pipeline enables mechanistic interrogation of microbiome metabolism.
Schematic of our metabolomics workflow, consisting of MS reference library construction and validation, producing in vitro and in vivo metabolomic profiles across diverse sample types. Our entire dataset is publicly accessible via a web-based, interactive Metabolomics Data Explorer.
Fig. 2,
Fig. 2,. Relationships between phylogeny, taxonomy, and metabolome.
a, Comparison of tree topology constructed based on phylogenetic (left) and metabolomic profile (fold-change data, right) distance matrices of 158 mega-medium grown strains spanning five phyla (one to three independent experiments, each with n ≥ 3 biological replicates). b, Metabolite accumulation patterns across all 158 mega-medium grown strains, clustered based on phylogenetic distance. Dot size: mean production levels of one to three independent experiments, each with n ≥ 3 biological replicates. For each metabolite, the largest dot represents the highest production level for that metabolite.
Fig. 3,
Fig. 3,. Discovery of nitrogen assimilation strategies in Bacteroides and novel gene-phenotype relationships.
a, Classification accuracy of Random Forest (RF) models at each taxonomic level, based on metabolomic profiles of 158 mega-medium grown bacterial strains from one to three independent experiments, each with n ≥ 3 biological replicates. Phylum (n = 5), Class (n = 11), Order (n = 15), Family (n = 27), Genus (n = 45), Species (n = 115), and Strain (n = 158). b, Amino acid production or consumption levels by Bacteroidetes strains from one to three independent experiments, each with n ≥ 3 biological replicates. Only uniquely detected (non-coeluting) amino acids are shown. a, b, Boxes: median, 25th, and 75th percentile; whiskers: Tukey’s method. c, Phylogenetic tree of Bacteroidetes strains, growth curve max optical density (OD600nm), and percentage of protein sequence identity for E. coli asparagine-consuming, ammonium-liberating enzymes. Nitrogen sources: ammonia (NH4), Glutamine (Gln), Asparagine (Asn). d, Representative growth curves of wild-type and mutant Bt (2757-3983-) in modified Salyer’s Minimal Medium from one experiment with n = 3 biological replicates. Nitrogen sources as in c: NH4, Gln, Asn.
Fig. 4,
Fig. 4,. Metabolic contribution by individual gut microbes in a multi-species community.
a, Quantification of agmatine levels. Mean ± s.e.m. of two independent experiments, each with n = 4 (germ-free) or n = 5 (Citrobacter mono-colonized) individual mice. b, Significantly produced metabolites associated with Clostridium sporogenes (Cs) or Bacteroides thetaiotaomicron (Bt) in serum (left panel) or urine (right panel). Violin plot: median and quartiles. Mean ± s.e.m. of one experiment with n = 4 (Cs, serum), n = 3 (Cs, urine), n = 5 (Bt, serum), n = 4 (Bt, urine), n = 7 (six-member, serum), n = 6 (six-member, urine), and n =9 germ-free mice pooled from both mono-association (n = 4) and community (n = 5) experiments. c, Serum metabolite levels in mice colonized with the six-member community (+Cs) or the five-member community (−Cs). Metabolites shown represent a panel of significantly elevated or reduced metabolites (≥ 4-fold, corrected P < 0.05) in the six-member community. Mean ± s.e.m. of one experiment with n = 7 (six-member community) and n = 8 (five-member community) mice. Venn diagram: significantly elevated or reduced metabolites in different host biofluids based on the same threshold defined above. a-c, P values: two-tailed t-test with Benjamini-Hochberg correction for multiple comparisons. * P < 0.05, ** P < 0.01, *** P < 0.001.

Comment in

References

    1. Koppel N, Rekdal VM & Balskus EP Chemical transformation of xenobiotics by the human gut microbiota. Science 356, 1246–1257 (2017). - PMC - PubMed
    1. Koh A, De Vadder F, Kovatcheva-Datchary P & Bäckhed F From dietary fiber to host physiology: Short-chain fatty acids as key bacterial metabolites. Cell 165, 1332–1345 (2016). - PubMed
    1. Donia MS & Fischbach MA Small molecules from the human microbiota. Science 349, (2015). - PMC - PubMed
    1. Rooks MG & Garrett WS Gut microbiota, metabolites and host immunity. Nat. Rev. Immunol 16, 341–352 (2016). - PMC - PubMed
    1. Cani PD Microbiota and metabolites in metabolic diseases. Nat. Rev. Endocrinol 15, 69–70 (2019). - PubMed

Publication types

LinkOut - more resources