. 2021 Jun 28:12:698124.
doi: 10.3389/fgene.2021.698124. eCollection 2021.

Visualization and Analysis of Gene Expression in Stanford Type A Aortic Dissection Tissue Section by Spatial Transcriptomics

Affiliations

Visualization and Analysis of Gene Expression in Stanford Type A Aortic Dissection Tissue Section by Spatial Transcriptomics

Yan-Hong Li et al. Front Genet. .

Abstract

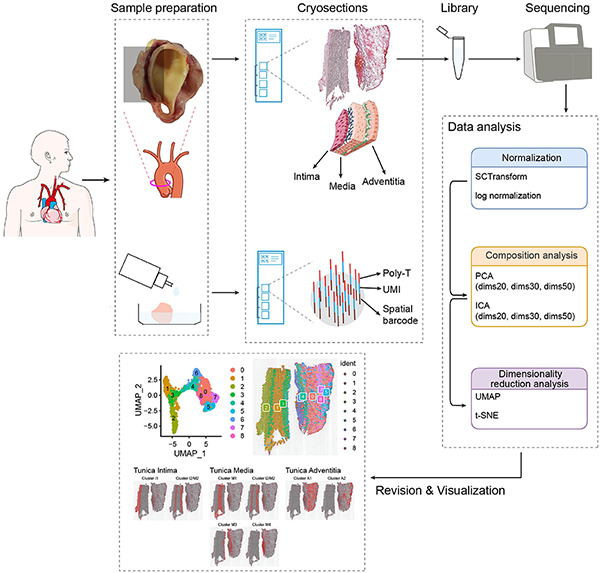
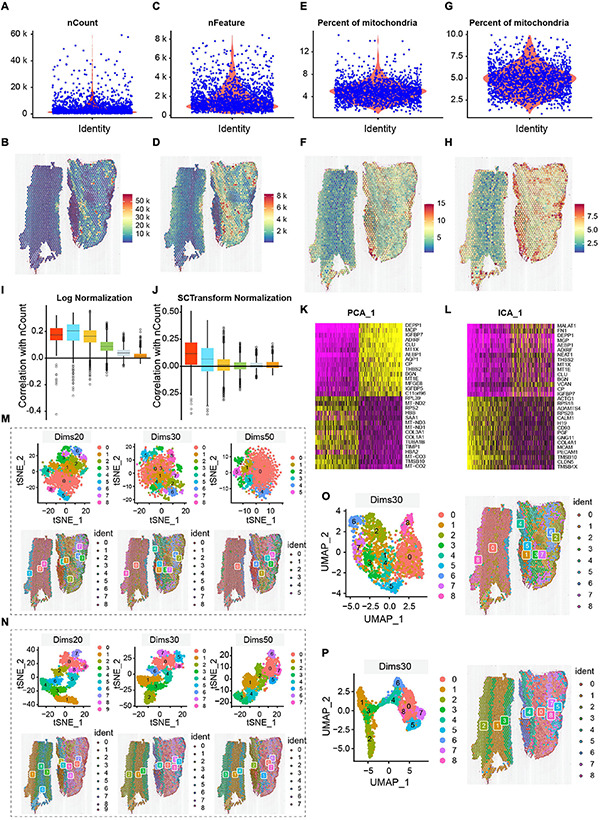
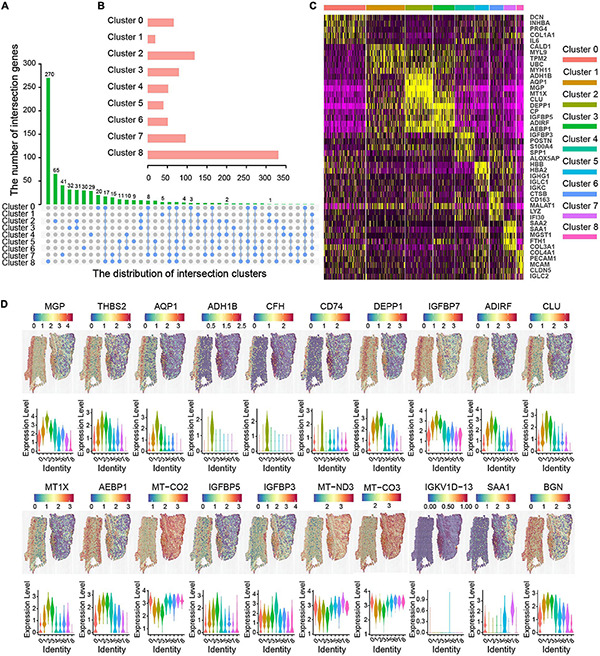
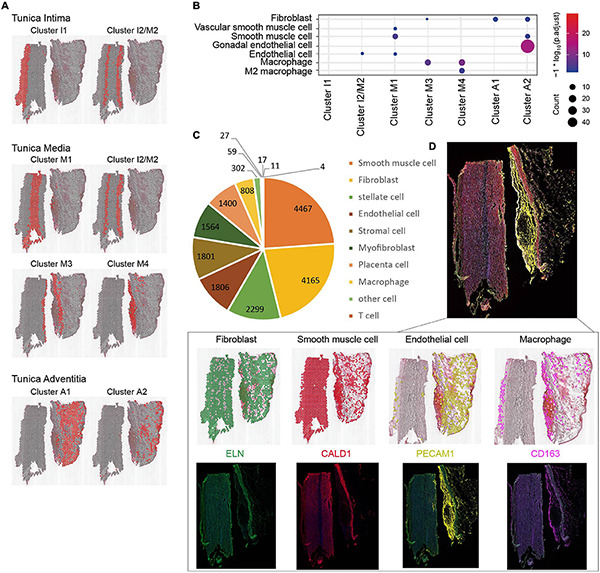
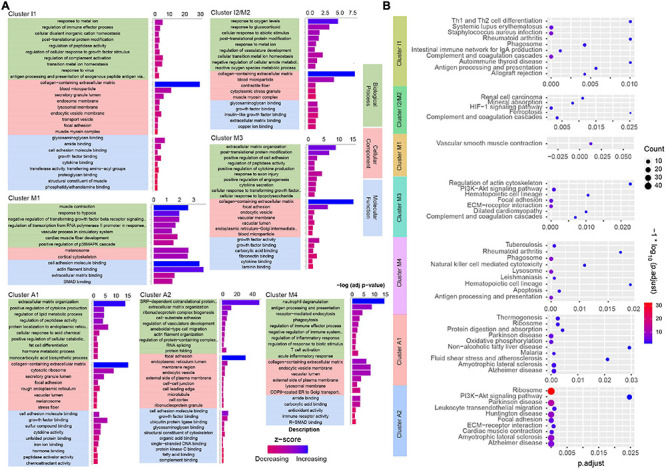
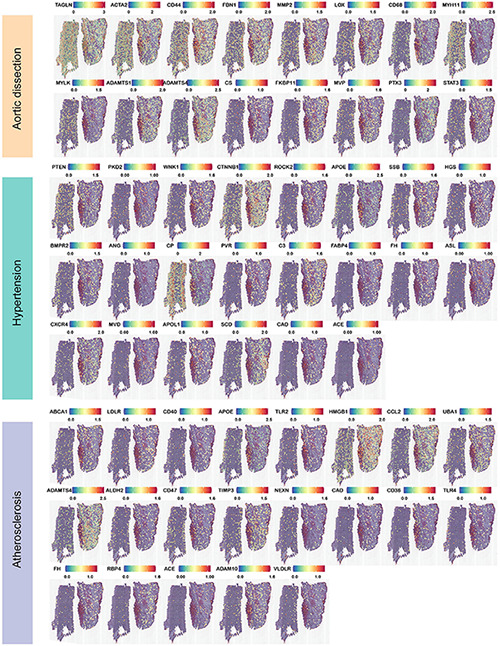
Background: Spatial transcriptomics enables gene expression events to be pinpointed to a specific location in biological tissues. We developed a molecular approach for low-cell and high-fiber Stanford type A aortic dissection and preliminarily explored and visualized the heterogeneity of ascending aortic types and mapping cell-type-specific gene expression to specific anatomical domains. Methods: We collected aortic samples from 15 patients with Stanford type A aortic dissection and a case of ascending aorta was randomly selected followed by 10x Genomics and spatial transcriptomics sequencing. In data processing of normalization, component analysis and dimensionality reduction analysis, different algorithms were compared to establish the pipeline suitable for human aortic tissue. Results: We identified 19,879 genes based on the count level of gene expression at different locations and they were divided into seven groups based on gene expression trends. Major cell that the population may contain are indicated, and we can find different main distribution of different cell types, among which the tearing sites were mainly macrophages and stem cells. The gene expression of these different locations and the cell types they may contain are correlated and discussed in terms of their involvement in immunity, regulation of oxygen homeostasis, regulation of cell structure and basic function. Conclusion: This approach provides a spatially resolved transcriptome- and tissue-wide perspective of the adult human aorta and will allow the application of human fibrous aortic tissues without any effect on genes in different layers with low RNA expression levels. Our findings will pave the way toward both a better understanding of Stanford type A aortic dissection pathogenesis and heterogeneity and the implementation of more effective personalized therapeutic approaches.

Keywords: Stanford type A aortic dissection; aortic; bioinformatics; gene expression; spatial transcriptomics.


Conflict of interest statement

The authors declare that the research was conducted in the absence of any commercial or financial relationships that could be construed as a potential conflict of interest.

Figures

FIGURE 1
FIGURE 1
Study design for ST in aortic dissection. Tissue of aortic dissection from the patient was dissociated and embedded in OCT; a fresh thin tissue section was obtained from cryosection, which was attached and fixed to each spot on the microarray slide; the library was sequenced and further processed to map the expressed genes to the spatial locations at which they were expressed; establishment of data analysis methods and visualization of cell populations.
FIGURE 2
FIGURE 2
Quality control and ST data analysis. (A,B) The number of nCount_RNA is range of 10,000–20,000, with the maximum not exceeding 60,000, and spatial UMIs distribution is concentrated in the aortic of tunica media and external. (C,D) The number of genes is mostly between 1,000 and 7,500. Combined with the distribution of UMIs data, the region with a high number of genes also had a high number of UMIs. (E,F) The percentage of mitochondria is low, between 1 and 12%. Correspondingly, the distribution of spatial UMIs in the tunica media and external is also rare. (G,H) Cells with >10% mitochondrial reads are filtered, and display distribution of spatial UMIs. The colors from blue to red represented increasing number of expression. (I,J) Comparison of normalization methods (log and SCTransform normalization), the SCTransform normalization is superior to Log Normalization. (K,L) Comparison of compositional analysis (PCA and ICA). (M–P) Comparison of dimensionality reduction and clustering methods, among them, (M,O) are under the ICA condition, the distribution of t-SNE (dims 20, 30, 50) and UMAP (dims 30); (N,P) are under the PCA condition, the distribution of t-SNE (dims 20, 30, 50) and UMAP (dims 30). Overall, PCA dims 30 combined with UMAP dimensionality reduction cluster analysis is an appropriate method. The Clusters are labeled using different colors.
FIGURE 3
FIGURE 3
Molecular characteristics related to spatial location in ascending aortic dissection tissue. (A) Correlation clusters of overlapping DEGs. The column length represents the number of overlapping genes. (B) The bar chart represents the number of genes in each cluster. (C) The heat map displays the top five (by average log [fold change]) genes in each cluster. The X-axis represents the distribution of intersection clusters; Y-axis represents the number of intersection genes. (D) The top 20 genes of location and expression level were in each layer. Violin plots of gene expression levels show different clusters with different colors.
FIGURE 4
FIGURE 4
Cell types identification of aortic dissection tissue. (A) The spatial location distribution of cell types in each cluster. Red region represents each cluster. (B) Major cell types by CellMarker database. (C) The major cell types and its number calculated by HCL database. (D) Verify the accuracy of cell types by multi-color immunofluorescence.
FIGURE 5
FIGURE 5
Analysis of GO and KEGG enrichment of clusters in ascending aortic dissection tissue. (A) Analysis of genes enriched by GO terms (biological processes, cellular component, molecular function) (p. adjust) in each cluster. The function is reflected by z-score and up color-coded from red to blue. (B) KEGG analysis for hallmark genes of enriched pathways in each cluster. The gradient color represents the P-value; the size of the black spots represents the gene number.
FIGURE 6
FIGURE 6
Expression of highly expressed genes in dissection-related pathogenic factors in aortic dissection. Aortic dissection has reported the expression of highly expressed genes (hypertension, atherosclerosis) in dissection tissues of pathogenic factors. ST profiles of hypertension and atherosclerosis are listed.

References

    1. Akutsu K. (2019). Etiology of aortic dissection. Gen. Thorac. Cardiovasc. Surg. 67 271–276. 10.1007/s11748-019-01066-x - DOI - PubMed
    1. Asp M., Giacomello S., Larsson L., Wu C., Furth D., Qian X., et al. (2019). A spatiotemporal organ-wide gene expression and cell atlas of the developing human heart. Cell 179 1647–1660. 10.1016/j.cell.2019.11.025 - DOI - PubMed
    1. Asp M., Salmen F. (2017). Spatial detection of fetal marker genes expressed at low level in adult human heart tissue. Sci. Rep. 7:12941. 10.1038/s41598-017-13462-5 - DOI - PMC - PubMed
    1. Baron C. S., Kester L., Klaus A., Boisset J. C., Thambyrajah R., Yvernogeau L., et al. (2018). Single-cell transcriptomics reveal the dynamic of haematopoietic stem cell production in the aorta. Nat. Commun. 9:2517. 10.1038/s41467-018-04893-3 - DOI - PMC - PubMed
    1. Becht E., McInnes L., Healy J., Dutertre C. A., Kwok I. W. H., Ng L. G., et al. (2018). Dimensionality reduction for visualizing single-cell data using UMAP. Nat. Biotechnol. 10.1038/nbt.4314 - DOI - PubMed

LinkOut - more resources