. 2021 Jul;10(9):e12118.
doi: 10.1002/jev2.12118. Epub 2021 Jul 7.

Epigenetic reprogramming enhances the therapeutic efficacy of osteoblast-derived extracellular vesicles to promote human bone marrow stem cell osteogenic differentiation

Affiliations

Epigenetic reprogramming enhances the therapeutic efficacy of osteoblast-derived extracellular vesicles to promote human bone marrow stem cell osteogenic differentiation

Kenny Man et al. J Extracell Vesicles. 2021 Jul.

Abstract

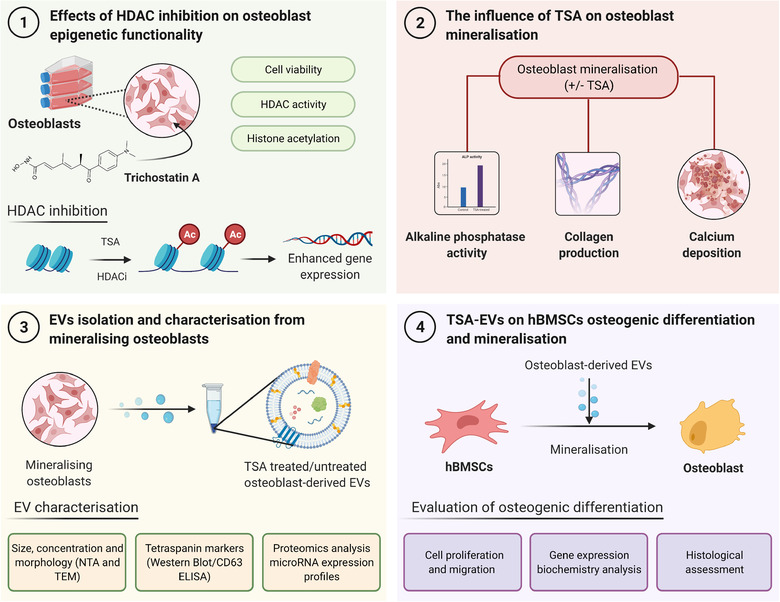
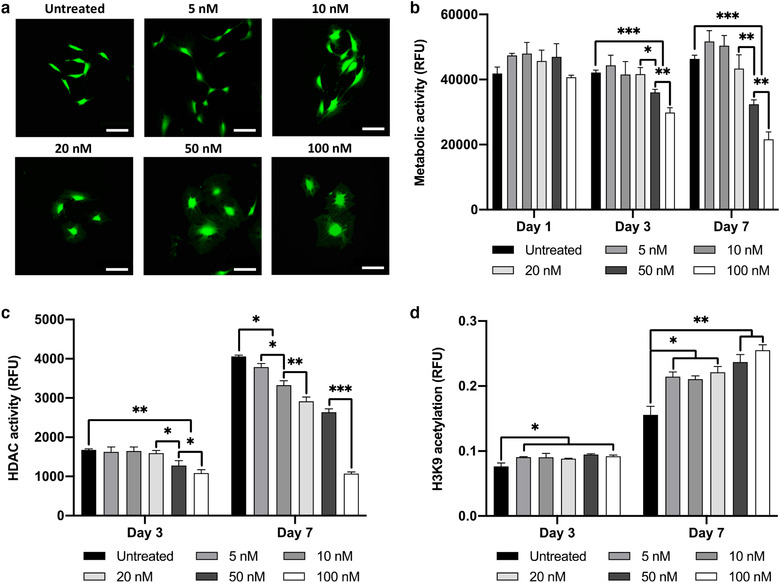
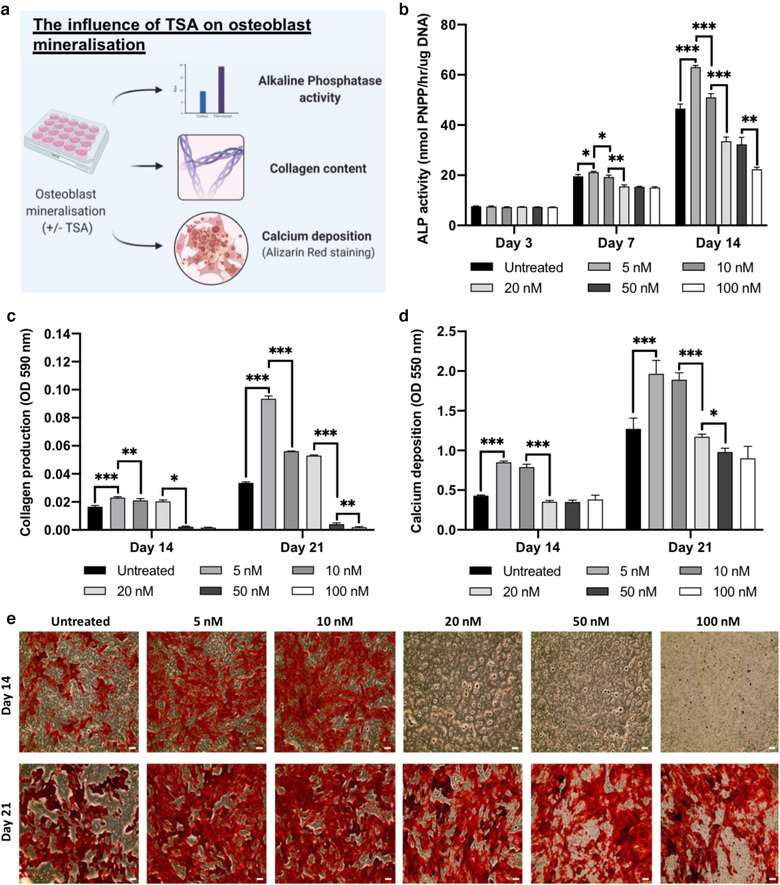
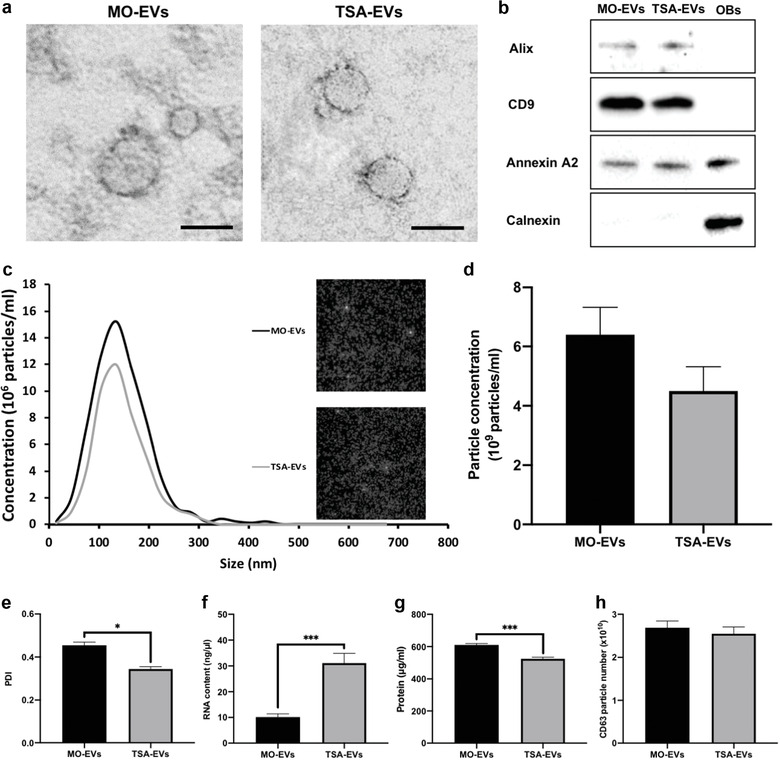
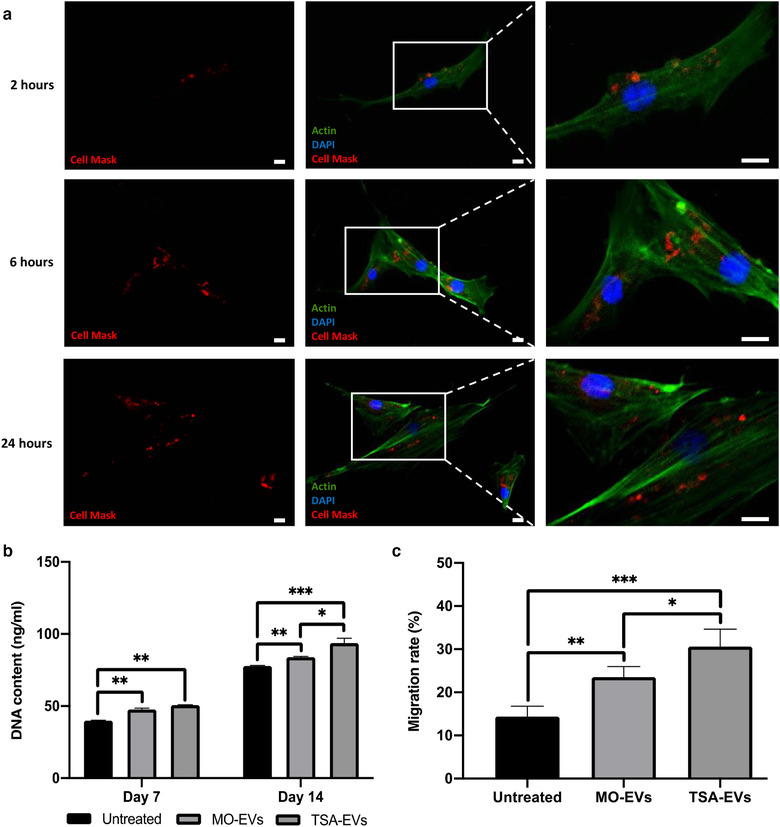
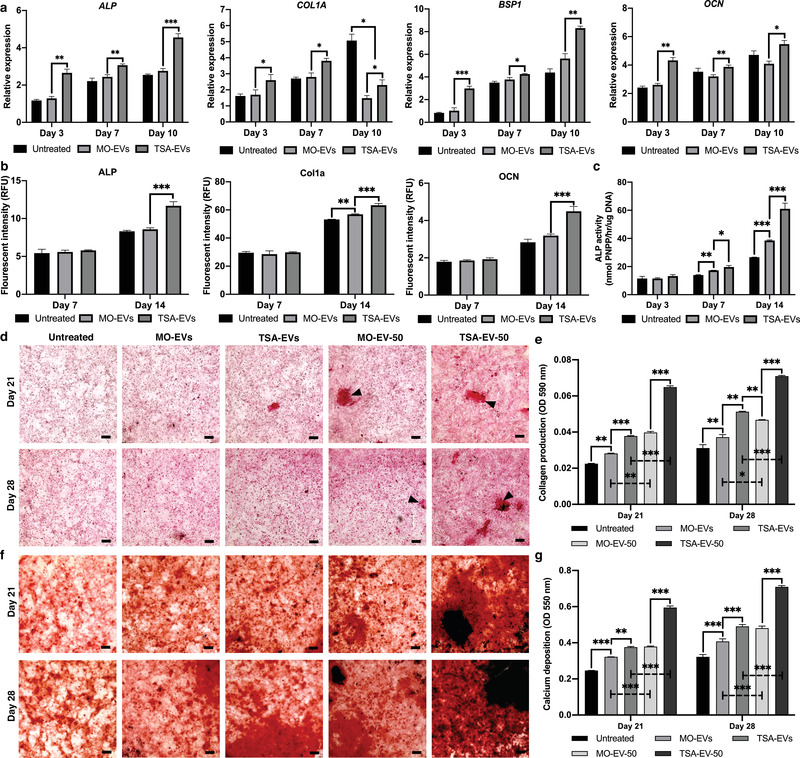
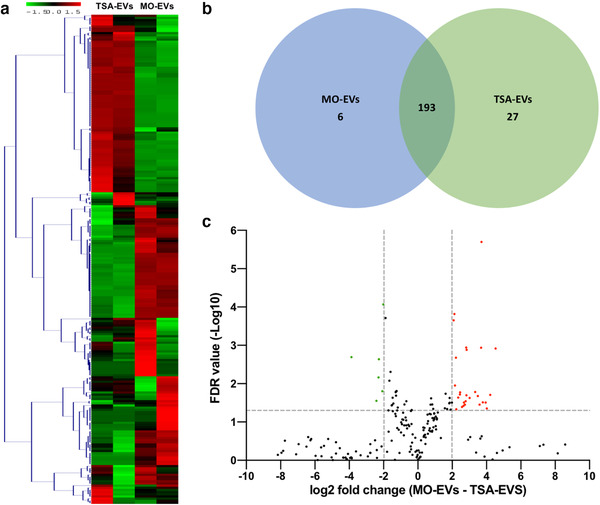
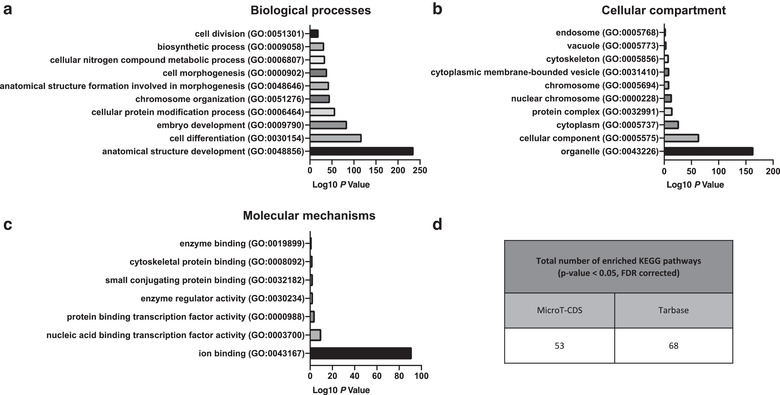
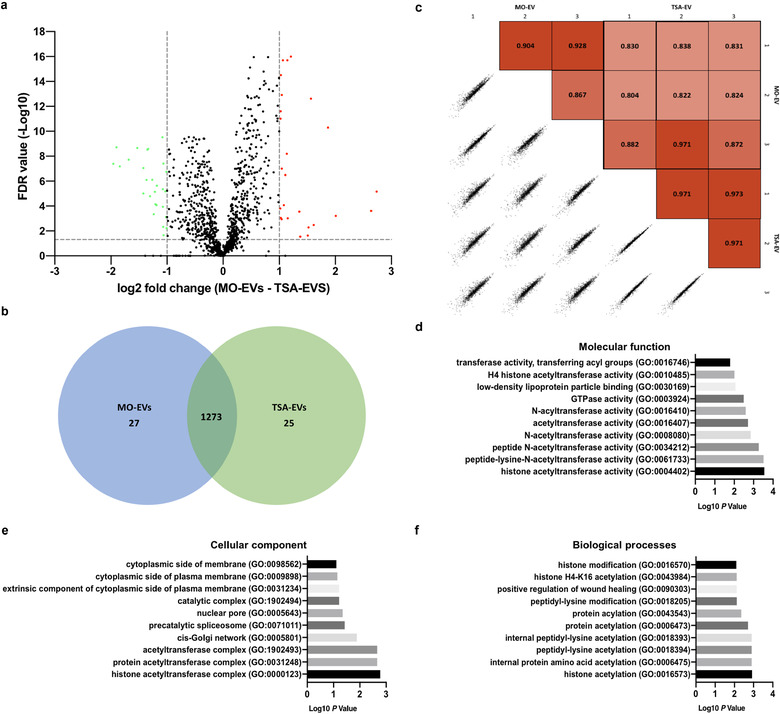
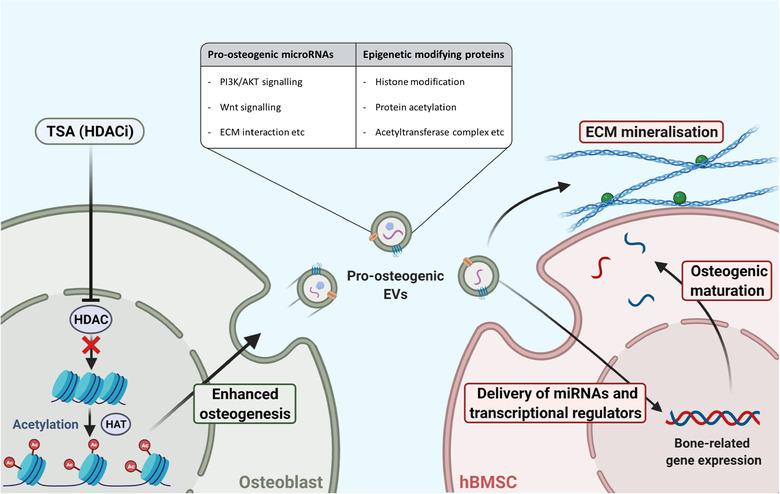
Extracellular vesicles (EVs) are emerging in tissue engineering as promising acellular tools, circumventing many of the limitations associated with cell-based therapies. Epigenetic regulation through histone deacetylase (HDAC) inhibition has been shown to increase differentiation capacity. Therefore, this study aimed to investigate the potential of augmenting osteoblast epigenetic functionality using the HDAC inhibitor Trichostatin A (TSA) to enhance the therapeutic efficacy of osteoblast-derived EVs for bone regeneration. TSA was found to substantially alter osteoblast epigenetic function through reduced HDAC activity and increased histone acetylation. Treatment with TSA also significantly enhanced osteoblast alkaline phosphatase activity (1.35-fold), collagen production (2.8-fold) and calcium deposition (1.55-fold) during osteogenic culture (P ≤ 0.001). EVs derived from TSA-treated osteoblasts (TSA-EVs) exhibited reduced particle size (1-05-fold) (P > 0.05), concentration (1.4-fold) (P > 0.05) and protein content (1.16-fold) (P ≤ 0.001) when compared to untreated EVs. TSA-EVs significantly enhanced the proliferation (1.13-fold) and migration (1.3-fold) of human bone marrow stem cells (hBMSCs) when compared to untreated EVs (P ≤ 0.05). Moreover, TSA-EVs upregulated hBMSCs osteoblast-related gene and protein expression (ALP, Col1a, BSP1 and OCN) when compared to cells cultured with untreated EVs. Importantly, TSA-EVs elicited a time-dose dependent increase in hBMSCs extracellular matrix mineralisation. MicroRNA profiling revealed a set of differentially expressed microRNAs from TSA-EVs, which were osteogenic-related. Target prediction demonstrated these microRNAs were involved in regulating pathways such as 'endocytosis' and 'Wnt signalling pathway'. Moreover, proteomics analysis identified the enrichment of proteins involved in transcriptional regulation within TSA-EVs. Taken together, our findings suggest that altering osteoblasts' epigenome accelerates their mineralisation and promotes the osteoinductive potency of secreted EVs partly due to the delivery of pro-osteogenic microRNAs and transcriptional regulating proteins. As such, for the first time we demonstrate the potential to harness epigenetic regulation as a novel engineering approach to enhance EVs therapeutic efficacy for bone repair.

Keywords: bone; epigenetics; extracellular vesicles; histone deacetylase; microRNAs; tissue engineering; trichostatin A.


Conflict of interest statement

The authors declare no conflicts of interest.

Figures

FIGURE 1
FIGURE 1
Experimental outline investigating the effects of altering osteoblast epigenetic functionality on the therapeutic potency of their EVs for bone regeneration. 1) The influence of TSA on osteoblast epigenetic functionality was assessed. 2) The effects of TSA on osteoblast mineralisation was evaluated by quantifying ALP activity, collagen production and calcium deposition. 3) EVs were isolated from TSA‐treated and untreated mineralising osteoblast over a 2‐week period, and the nanoparticles were characterised by their size, morphology, protein and microRNA expression. 4) Investigating the effects of TSA‐EV treatment on hBMSCs osteogenic differentiation. Figure created with BioRender.com
FIGURE 2
FIGURE 2
The effect of TSA on osteoblasts viability and epigenetic functionality. TSA caused a time‐dose dependant effect on osteoblast a) morphology (day 3) and b) metabolic activity. Treatment with TSA altered osteoblast c) HDAC activity and d) H3K9 histone acetylation in a time‐dose dependent manner. Data are expressed as mean ± SD (n = 3). *P ≤ 0.05, **P ≤ 0.01 and ***P ≤ 0.001. Scale bar = 100 µm
FIGURE 3
FIGURE 3
TSA treatment promoted osteoblast mineralisation. a) Schematic representation regarding the assessment of TSA on osteoblast mineralisation. Treatment with TSA elicited a time‐dose dependent effect on osteoblast b) ALP activity, c) extracellular matrix collagen production and d, e) calcium deposition. Data are expressed as mean ± SD (n = 3). *P ≤ 0.05, **P ≤ 0.01 and ***P ≤ 0.001. Scale bar = 200 µm
FIGURE 4
FIGURE 4
Characterisation of EVs isolated from TSA treated and untreated mineralising osteoblasts. a) TEM image of EVs isolated from TSA‐treated and untreated osteoblasts. Scale bar = 50 nm. b) Western blot analysis confirming the presence of EV markers (Alix, CD9, and Annexin A2) and absence of Calnexin (OBs ‐ osteoblast cell lysate control). c) Particle size distribution of isolated EV samples from NTA. Insert shows snapshot of particles during analysis. d) EV particle size and concentration. e) Polydispersity index of EVs. f) EVs RNA quantification. g) EVs protein content. h) CD63+ particles number. Data are expressed as mean ± SD (n = 3). *P ≤ 0.05 and ***P ≤ 0.001
FIGURE 5
FIGURE 5
The influence of TSA‐EVs on hBMSCs general behaviour. a) Immunofluorescent images of Cell Mask labelled osteoblast‐derived EVs uptake by hBMSCs were taken at indicated times. Scale bar = 20 µm. The effects of TSA‐EVs on hBMSCs b) proliferation and c) migration. Data are expressed as mean ± SD (n = 3). *P ≤ 0.05, **P ≤ 0.01 and ***P ≤ 0.001
FIGURE 6
FIGURE 6
TSA‐EVs promoted hBMSCs osteogenic differentiation and mineralisation. a) Gene expression levels of ALP, COL1A, BSP1 and OCN were measured in TSA‐EV, MO‐EV treated and untreated hBMSCs during osteogenic culture. b) The intracellular protein levels of ALP, Col1a and OCN in EV treated hBMSCs analysed by ICW. c) The effects of TSA‐EVs on hBMSCs ALP activity during osteogenic culture. d) Picrosirius red staining for collagen production of EV‐treated hBMSCs. Black arrows highlight collagen rich mineral nodule‐like structures. e) Quantitative analysis of picrosirius red collagen staining. f) Alizarin red staining for calcium deposition on EV‐treated hBMSCs. Black staining indicates mineral nodule formation. g) Quantitative analysis of alizarin red staining. Scale bars = 200 µm. (MO‐EV, TSA EV; 10 µg/ml) (MO‐EV‐50, TSA‐EV‐50; 50 µg/ml). Data are expressed as mean ± SD (n = 3). *P ≤ 0.05, **P ≤ 0.01 and ***P ≤ 0.001
FIGURE 7
FIGURE 7
Differential expression of microRNAs derived from TSA‐EVs and MO‐EVs. a) Hierarchical clustering analysis of microRNAs that were differentially expressed between TSA‐EVs and MO‐EVs. b) Venn diagram comparing microRNAs differentially expressed from TSA‐EVs and MO‐EVs. A total of 193 shared microRNAs; 27 microRNAs upregulated in TSA‐EVs and 6 microRNAs upregulated in MO‐EVs. c) Volcano plot displaying Log2 values for the microRNAs fold‐change against Log10 FDR. MicroRNAs with a Log2 fold difference below 2 and a statistical value of > 0.05 were not considered to be statistically significant (vertical and horizontal lines respectively). The red points in the plot represents the significantly upregulated TSA‐EV microRNAs, the green points represent significantly upregulated MO‐EVs microRNAs
FIGURE 8
FIGURE 8
Gene ontology analysis of microRNAs found to be significantly upregulated in TSA‐EVs. Top ten GO prediction scores covering the domains of a) biological processes, b) cellular compartments and c) molecular mechanisms of microRNAs significantly upregulated in TSA‐EVs. d) Total number of experimentally validated and predicted interactions enrich KEGG pathways from MicroT‐CDS and Tarbase databases
FIGURE 9
FIGURE 9
Analysis of differentially expressed proteins derived from TSA‐EVs and MO‐EVs. a) Volcano plot displaying Log2 values for the proteins fold‐change against Log10 FDR. Proteins with a Log2 fold difference below 1 and a statistical value of > 0.05 were not considered to be statistically significant (vertical and horizontal lines respectively). The red points in the plot represents the significantly upregulated TSA‐EV proteins, the green points represent significantly upregulated MO‐EVs proteins. b) Venn diagram comparing proteins differentially expressed from TSA‐EVs and MO‐EVs. A total of 1273 shared proteins; 25 proteins upregulated in TSA‐EVs and 27 proteins upregulated in MO‐EVs. c) Pearson correlations between technical replicates, biological replicates and sample groups were determined. GO analysis of proteins found to be significantly upregulated in TSA‐EVs. Top ten GO prediction scores covering the domains of d) molecular function, e) cellular components and f) biological processes of proteins significantly upregulated in TSA‐EVs
FIGURE 10
FIGURE 10
Schematic representation of the mechanism TSA augments osteoblast epigenetic functionality and mineralisation, enhancing the therapeutic potency of their secreted EVs to stimulate hBMSCs osteogenic differentiation. Figure created with BioRender.com

References

    1. Aasland, R. (1995). The phd finger: Implications for chromatin‐mediated transcriptional regulation. Trends in Biochemical Sciences, 20(2), 56–59. - PubMed
    1. Amini, A. R. , Laurencin, C. T. , & Nukavarapu, S. P. (2012). Bone tissue engineering: Recent advances and challenges. Critical Reviews in Biomedical Engineering, 40(5), 363–408. - PMC - PubMed
    1. Barbaric, I. , Perry, M. J. , Dear, T. N. , Rodrigues Da Costa, A. , Salopek, D. , Marusic, A. , Hough, T. , Wells, S. , Hunter, A. J. , Cheeseman, M. , & Brown, S. D. M. (2008). An enu‐induced mutation in the ankrd11 gene results in an osteopenia‐like phenotype in the mouse mutant yoda. Physiological Genomics, 32(3), 311–321. - PubMed
    1. Baroli, B. (2009). From natural bone grafts to tissue engineering therapeutics: Brainstorming on pharmaceutical formulative requirements and challenges. Journal of Pharmaceutical Sciences, 98(4), 1317–1375. - PubMed
    1. Bhushan, R. , Grunhagen, J. , Becker, J. , Robinson, P. N. , Ott, C. E. , & Knaus, P. (2013). Mir‐181a promotes osteoblastic differentiation through repression of tgf‐beta signaling molecules. International Journal of Biochemistry & Cell Biology, 45(3), 696–705. - PubMed

Publication types