. 2021 May;1(5):454-472.
doi: 10.1038/s43587-021-00063-1. Epub 2021 May 13.

KDM4 Orchestrates Epigenomic Remodeling of Senescent Cells and Potentiates the Senescence-Associated Secretory Phenotype

Affiliations

KDM4 Orchestrates Epigenomic Remodeling of Senescent Cells and Potentiates the Senescence-Associated Secretory Phenotype

Boyi Zhang et al. Nat Aging. 2021 May.

Retraction in

Abstract

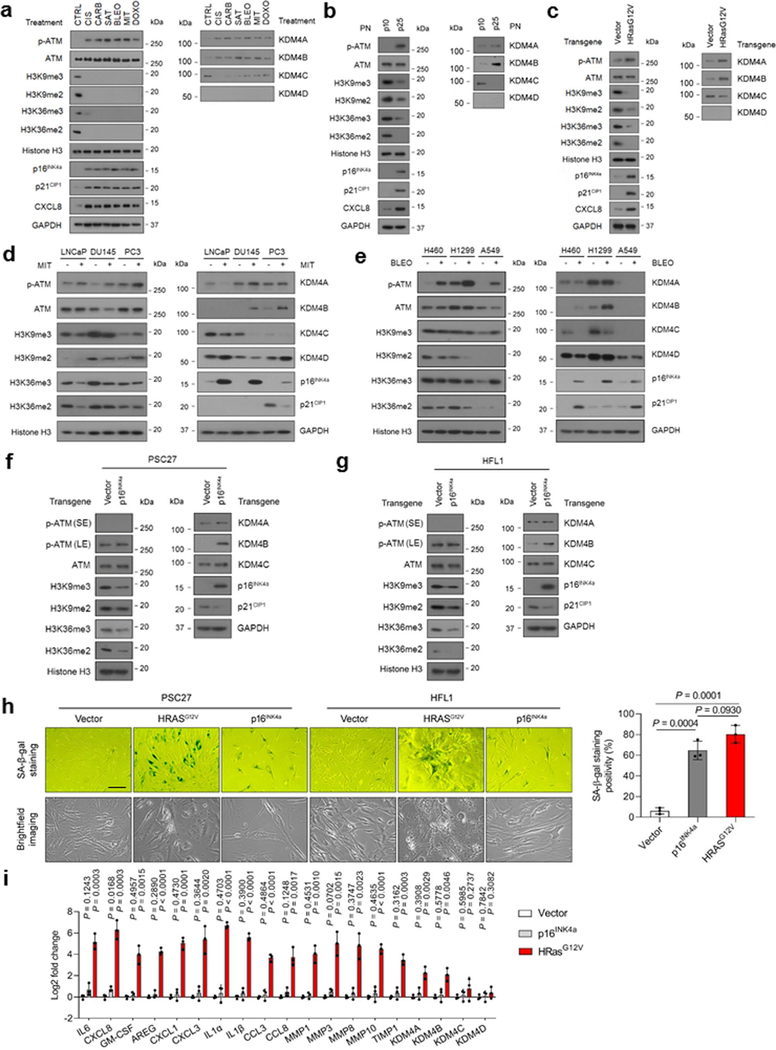
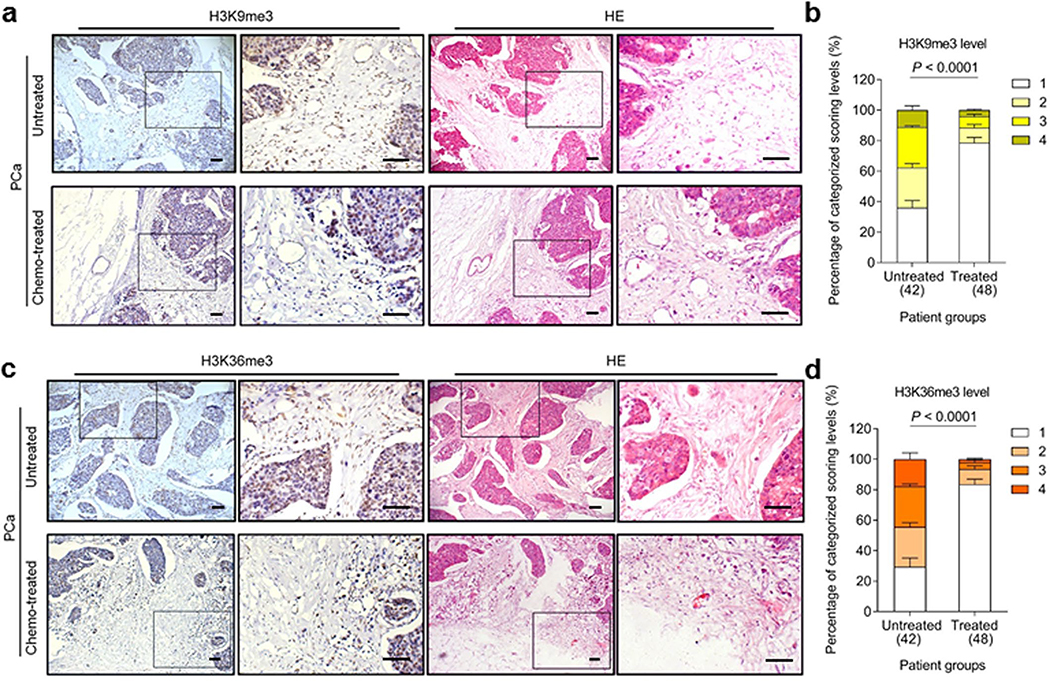
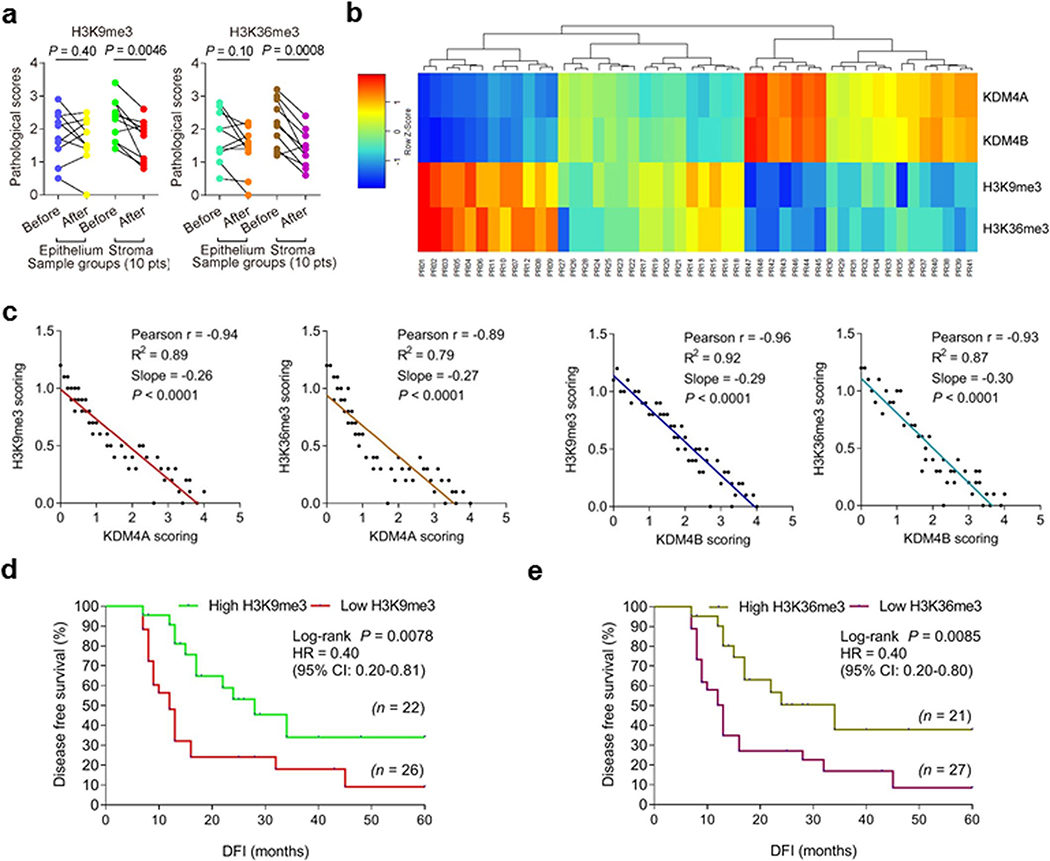
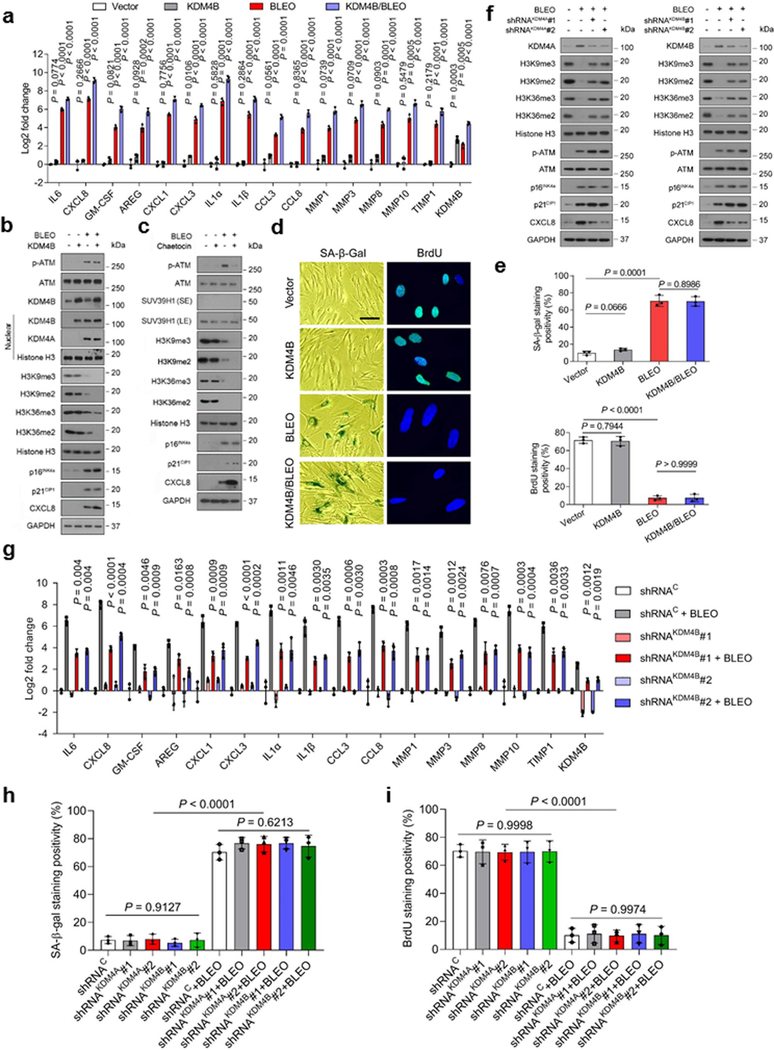
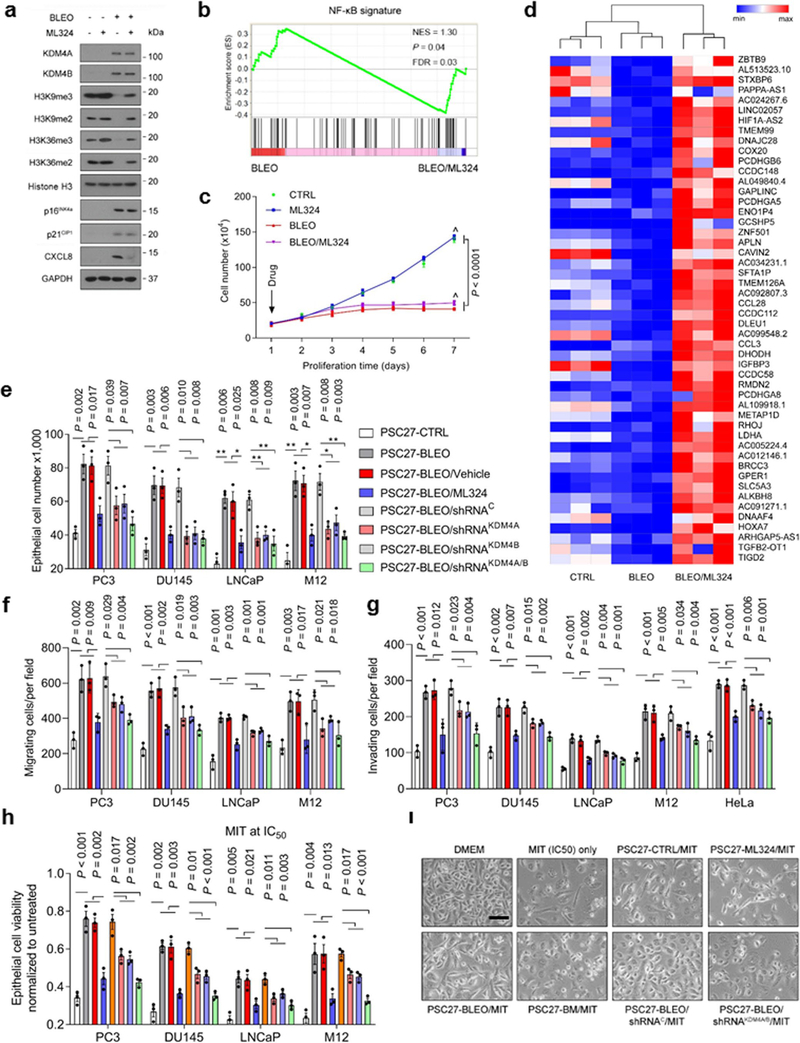
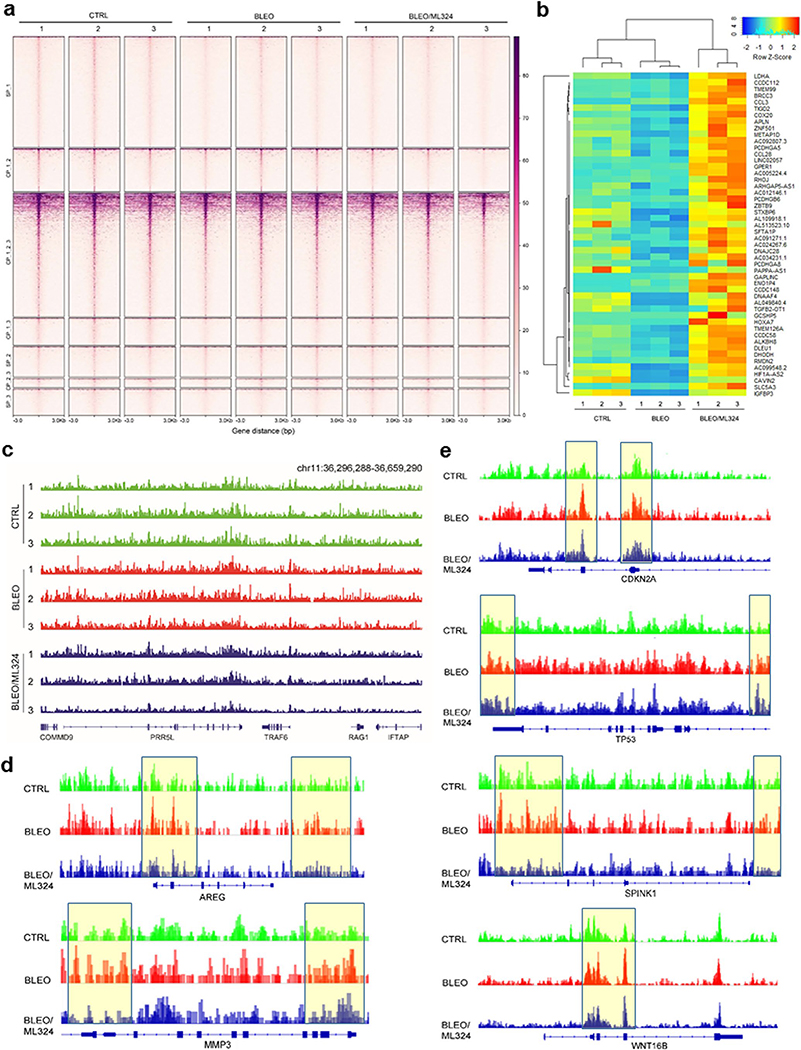
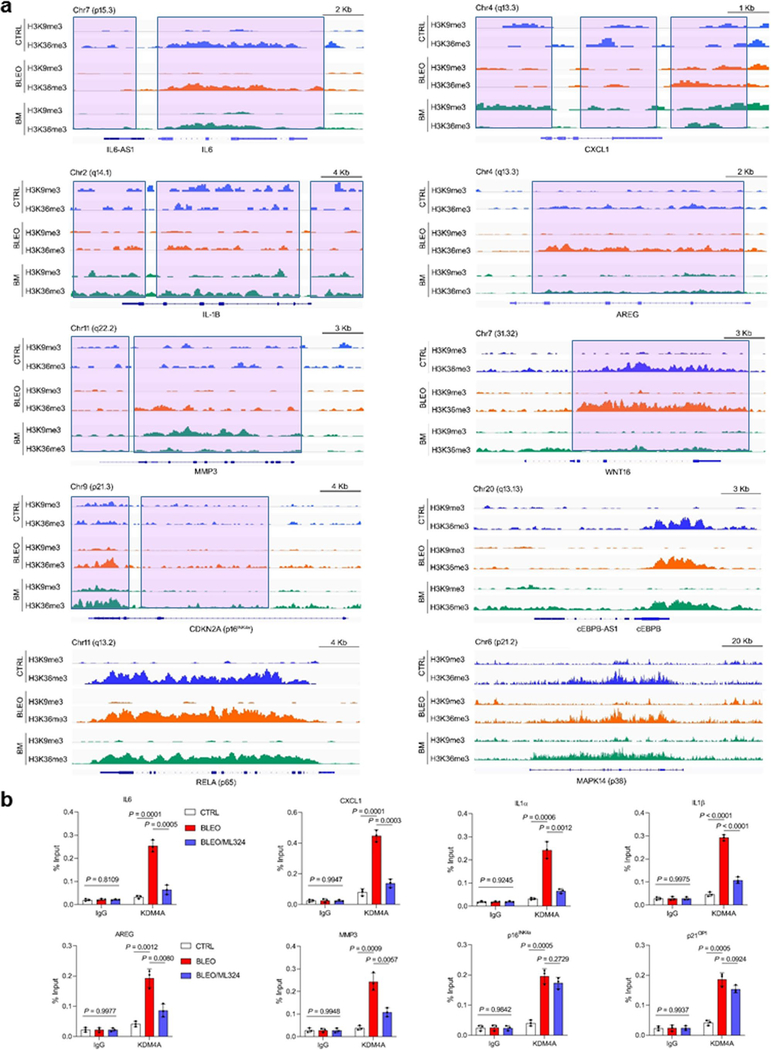
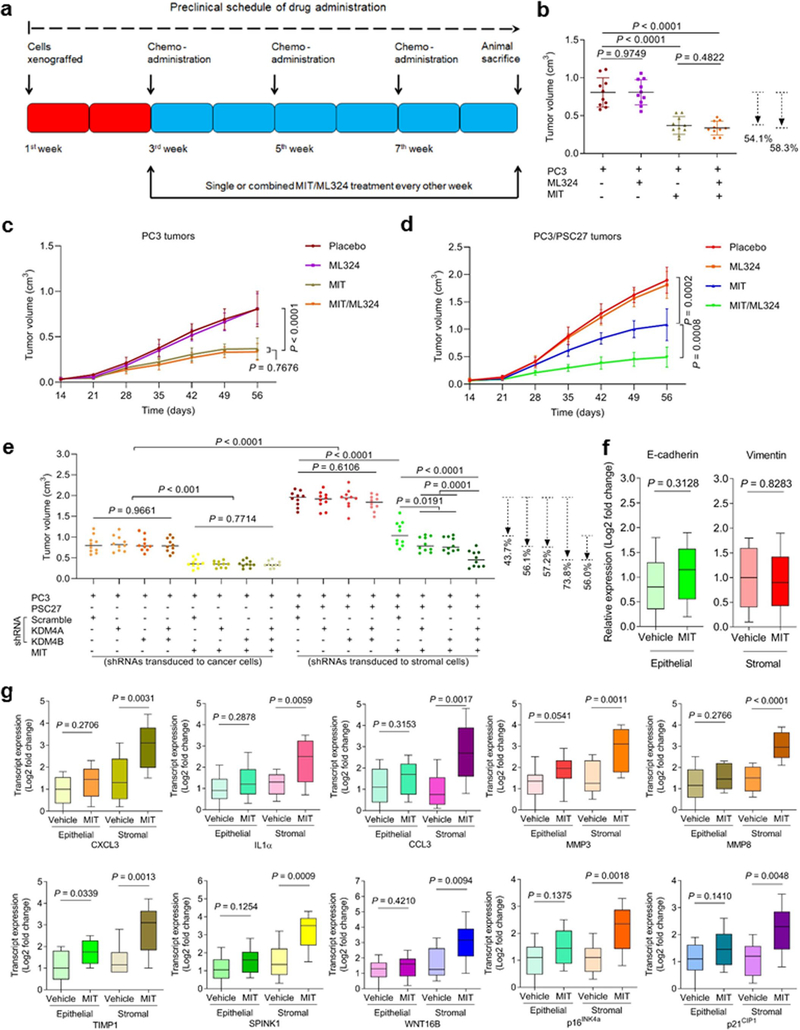
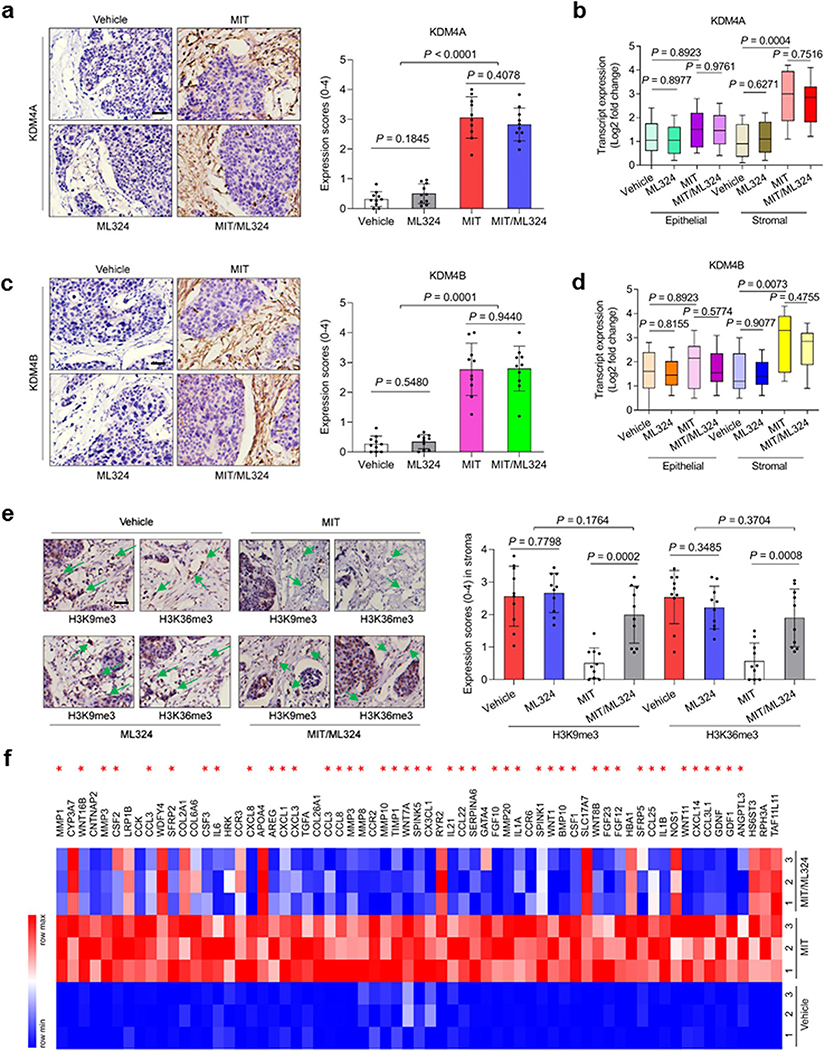
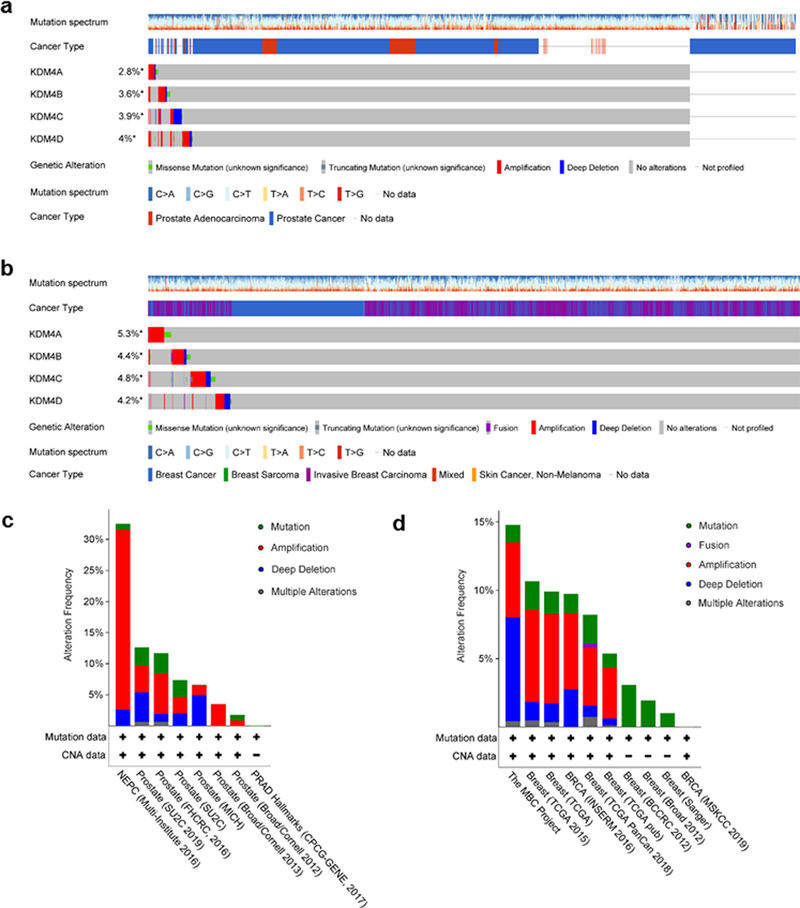
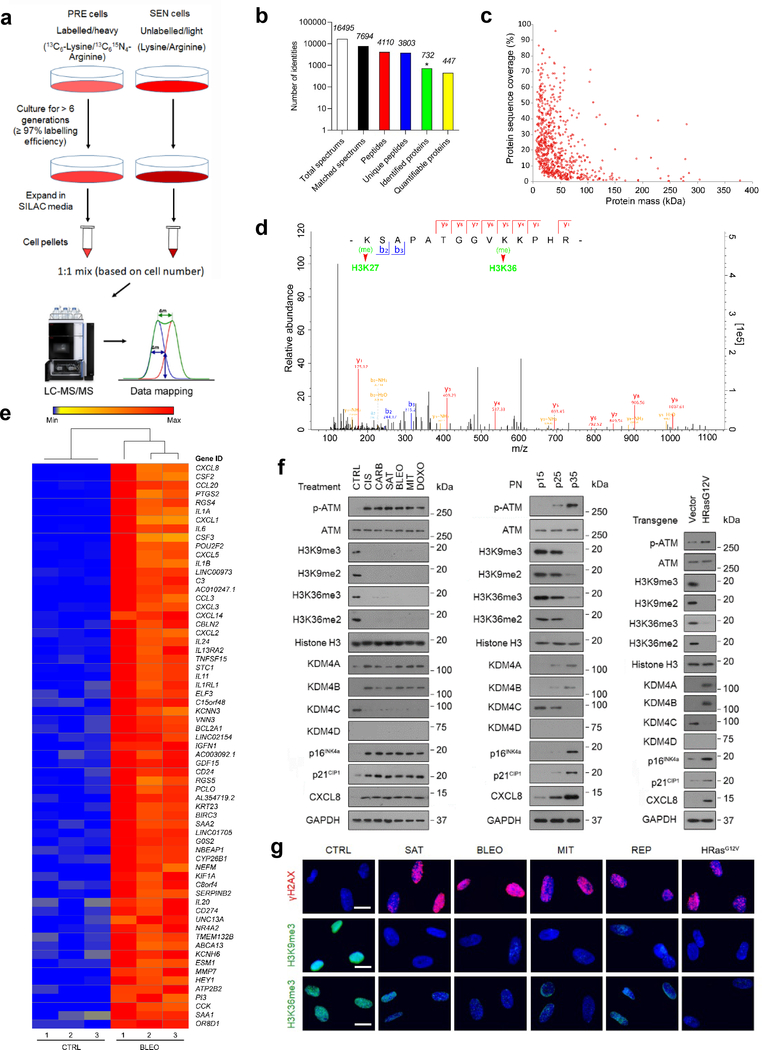
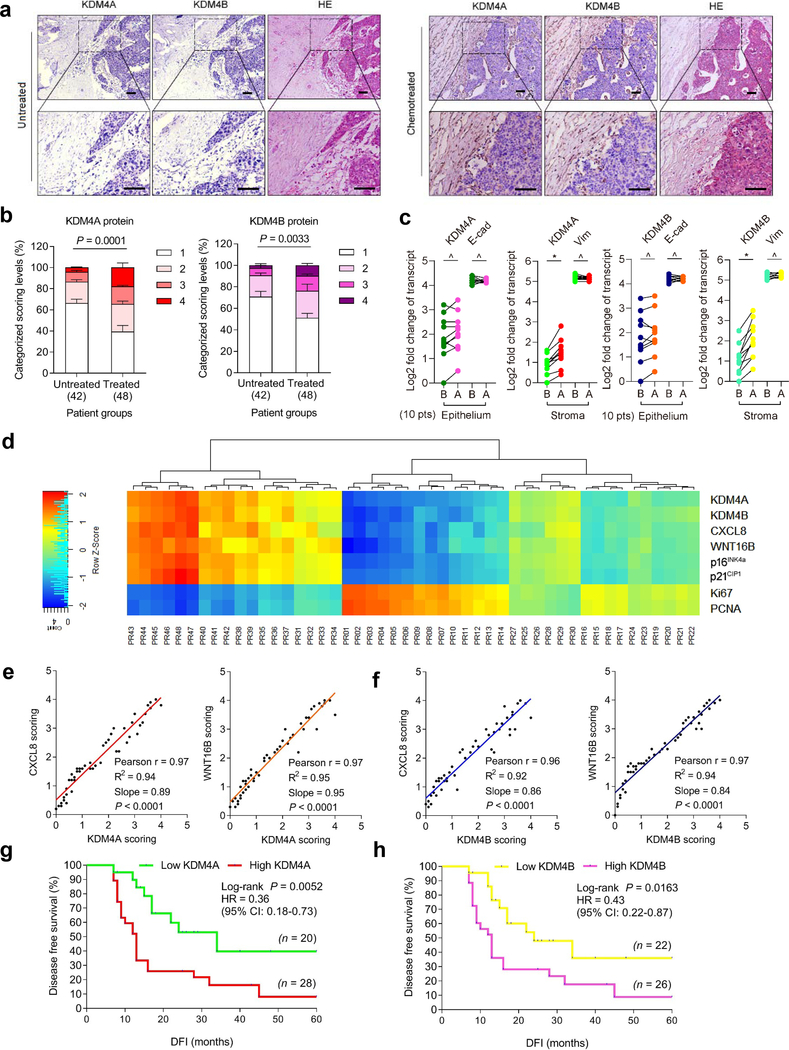
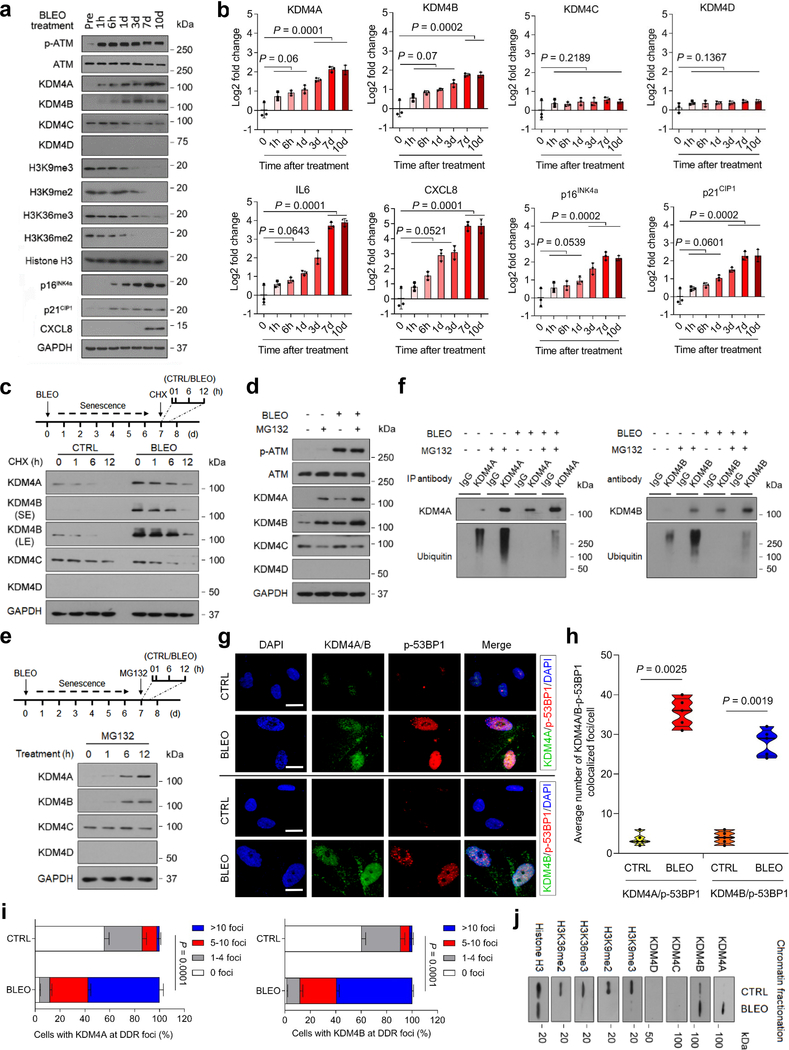
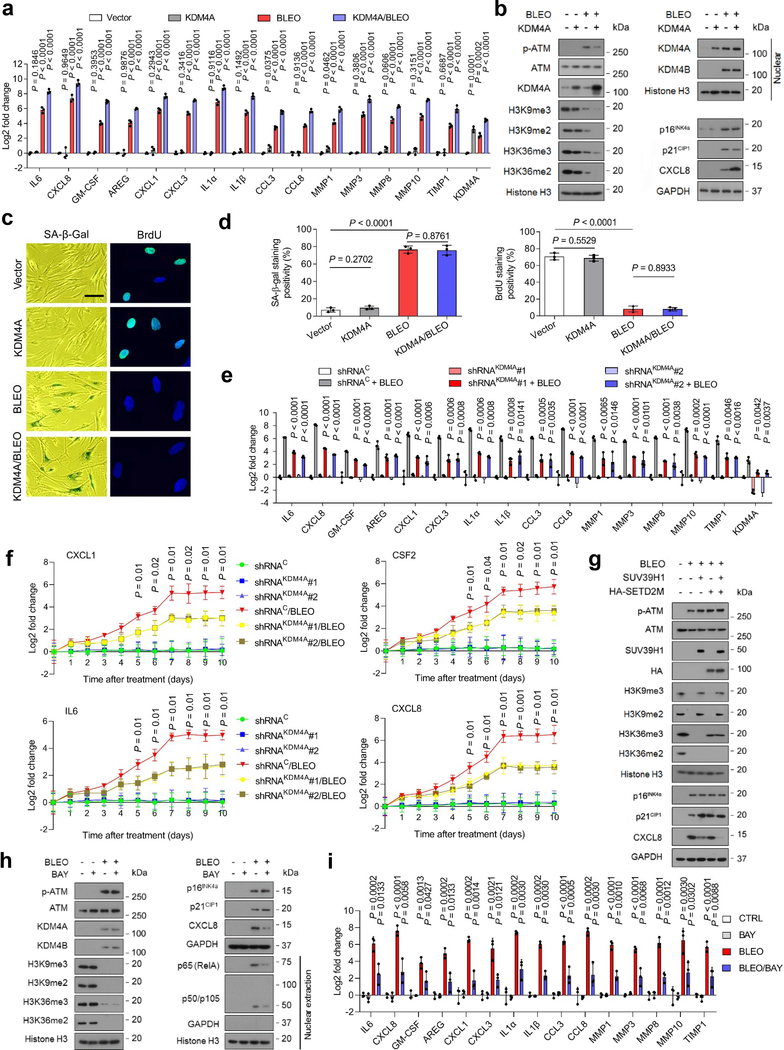
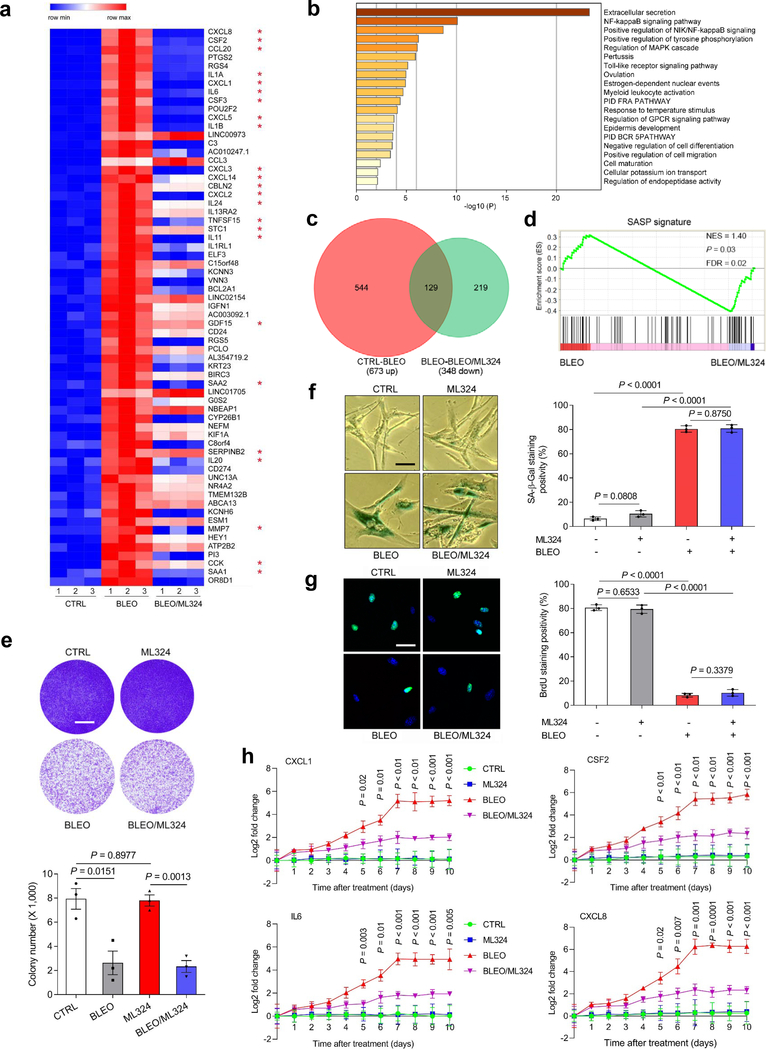
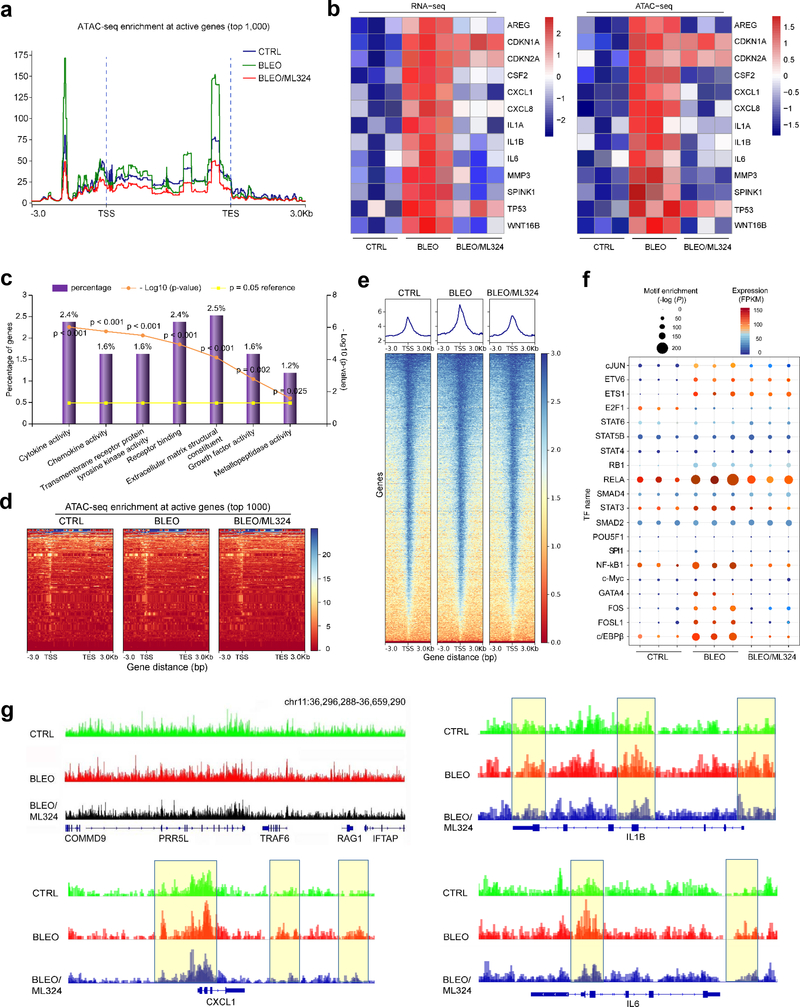
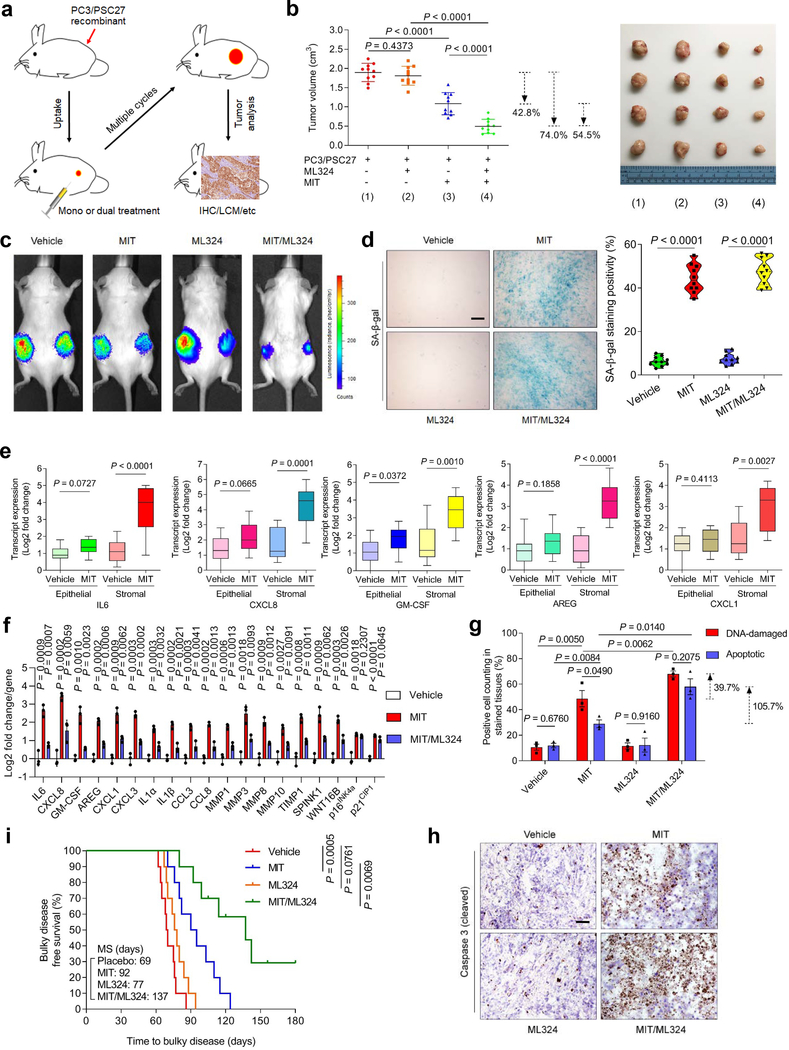
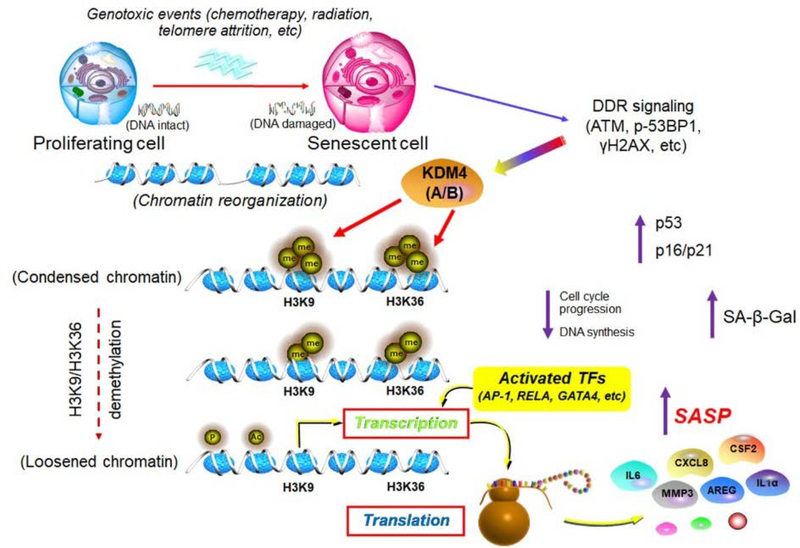
Cellular senescence restrains the expansion of neoplastic cells through several layers of regulation. We report that the histone H3-specific demethylase KDM4 is expressed as human stromal cells undergo senescence. In clinical oncology, upregulated KDM4 and diminished H3K9/H3K36 methylation correlate with poorer survival of prostate cancer patients post-chemotherapy. Global chromatin accessibility mapping via ATAC-seq, and expression profiling through RNA-seq, reveal global changes of chromatin openness and spatiotemporal reprogramming of the transcriptomic landscape, which underlie the senescence-associated secretory phenotype (SASP). Selective targeting of KDM4 dampens the SASP of senescent stromal cells, promotes cancer cell apoptosis in the treatment-damaged tumor microenvironment (TME), and prolongs survival of experimental animals. Our study supports dynamic changes of H3K9/H3K36 methylation during senescence, identifies an unusually permissive chromatin state, and unmasks KDM4 as a key SASP modulator. KDM4 targeting presents a novel therapeutic avenue to manipulate cellular senescence and limit its contribution to age-related pathologies including cancer.


Conflict of interest statement

Competing interests The authors declare no competing interests.

Figures

Extended Data Fig. 1 |
Extended Data Fig. 1 |. Characterization of cell lineage-dependent response to senescence induction.
a, Immunoblot analysis of gene expression profile after senescence induction of HFL1 cells. Cells were exposed to chemotherapeutic treatment by cisplatin (CIS), carboplatin (CARB), satraplatin (SAT), bleomycin (BLEO), mitoxantrone (MIT) or doxorubicin (DOXO). b, Immunoblot of lysates from HFL1 cells that have experienced replicative senescence, with samples collected at indicated passage numbers. c, Immunoblot of lysates from HFL1 cells transduced with a lentiviral construct encoding control vector or oncogenic Ras (HRasG12V). GAPDH, loading control. d, Immunoblot examination of lysates from human prostate cancer cell lines subject to chemotherapeutic treatment. LNCaP, DU145 and PC3 were exposed to MIT applied at the pre-optimized IC50 concentration per line. e, Immunoblot examination of lysates from human lung cancer cell lines subject to chemotherapeutic treatment. H460, H1299 and A549 were subject to treatment by BLEO at the pre-optimized IC50 concentration per line. f, Immunoblot assay after lentiviral transduction of human p16INK4a to PSC27 stromal cells. SE, short exposure. LE, long exposure. g, Similar to (f), immunoblot assay for HFL1 lentivirally transduced with human p16INK4a to analyze expression of relevant targets. SE, short exposure. LE, long exposure. h, Representative SA-β-Gal staining images of PSC27 and HFL1 upon transduction of HRasG12V or p16INK4a. Scale bar, 20 μm. Right, statistics of staining positivity. i, Quantitative profiling of transcript expression of SASP canonical factors and KDM4 family members. Data in all bar plots are shown as mean ± SD and representative of 3 biological replicates. h (right panel) and i, P values were determined by two-sided unpaired t-test, and adjusted for multiple comparisons.
Extended Data Fig. 2 |
Extended Data Fig. 2 |. H3K9me3 and H3K36me3 levels decline in human prostate tumor stroma.
a, Histological images of H3K9me3 staining in the stroma of human prostate cancer (PCa) tissues. Upper, before chemotherapy; lower, after chemotherapy. Left panel, immunohistochemical (IHC) staining; right panel, hematoxylin and eosin (HE) staining. Rectangular regions per left images are amplified into corresponding right images. Scale bars, 100 μm. b, Pathology-based statistical assessment of stromal H3K9me3 signal intensity in PCa samples (42 untreated versus 48 treated). In each group, patients were histologically assigned into 4 categories per IHC staining intensity of H3K9me3 in tumor stroma. 1, negative; 2, weak; 3, moderate; 4, strong expression. c, Histological images of H3K36me3 staining in the stroma of human PCa tissues. Upper, before chemotherapy; lower, after chemotherapy. Left panel, IHC staining; right panel, HE staining. Rectangular regions per left images are amplified into corresponding right images. Scale bars, 100 μm. d, Pathology-based statistical assessment of stromal H3K36me3 signal intensity in PCa samples (42 untreated versus 48 treated). In each group, patients were histologically assigned into 4 categories per IHC staining intensity of H3K9me3 in tumor stroma. 1, negative; 2, weak; 3, moderate; 4, strong expression. Data in all bar plots are shown as mean ± SD and representative of 3 biological replicates. Data in a-g are representative of 3 biological replicates. b and d, P values were determined by two-way ANOVA with Bonferroni’s post-hoc test.
Extended Data Fig. 3 |
Extended Data Fig. 3 |. H3K9me3 and H3K36me3 levels are reversely correlated with KDM4A/B expression.
a, Comparative analysis of H3K9me3/H3K36me3 signal intensity between before and after chemotherapy. Data were presented for epithelial and stromal cells, respectively, after averaging 3 independent pathological scores conferred by a pathologist (score range 1–4). Each dot represents an individual patient, with the data of ‘before’ and ‘after’ connected to allow direct profiling of H3K9me3/H3K36me3 expression in the same individual patient. Samples of 10 patents were evaluated. P values were determined by two-sided unpaired t-test, and adjusted for multiple comparisons. b, Landscape mapping of pathological correlation between KDM4A/B and H3K9me3/H3K36me3 in the stroma of PCa patients after chemotherapy. Scores derived from assessment of molecule-specific IHC staining, with expression levels colored to reflect low (blue) via modest (turquoise) and fair (yellow) to high (red) signal intensity. Columns represent individual patients, rows different molecules. Totally 48 patients posttreatment were analyzed, with scores of each patient averaged from 3 independent pathological readings. c, Statistical correlation between pathological scores of KDM4A/B and H3K9me3/H3K36me3 (Pearson correlation analysis, assuming data sampled from Gaussian distribution) in the 48 tumors with matching protein expression assessment data. P values were determined by two-sided unpaired t-test, and adjusted for multiple comparisons. d, Kaplan-Meier analysis of PCa patients. Disease-free survival (DFS) stratified according to H3K9me3 intensity (low, average score < 2, green line, n = 26; high, average score ≥ 2, red line, n = 22). DFS represents the length (months) of period calculated from the date of PCa diagnosis to the point of first disease relapse. Survival curves generated according to the Kaplan–Meier method, with P value calculated using a two-sided log-rank (Mantel-Cox) test. e, Kaplan-Meier analysis of PCa patients. Disease-free survival (DFS) stratified according to H3K36me3 expression (low, average score < 2, purple line, n = 27; high, average score ≥ 2, Kelly line, n = 21). DFS represents the length (months) of period calculated from the date of PCa diagnosis to the point of first disease relapse. Survival curves generated according to the Kaplan–Meier method, with P value calculated using a two-sided log-rank (Mantel-Cox) test. Data in all bar plots are shown as mean ± SD and representative of 3 biological replicates.
Extended Data Fig. 4 |
Extended Data Fig. 4 |. Enhanced SASP expression and decreased H3K9/H3K36 methylation are regulated by KDM4B.
a, Quantitative measurement of the SASP expression at transcription level. Stromal cells were transduced with a lentiviral construct encoding human KDM4B and/or exposed to BLEO treatment before analyzed. Signals normalized to CTRL cells (transduced with empty vector and untreated). b, Immunoblot assay of DNA damage repair (DDR) signaling, H3K9/H3K36 methylation, CXCL8 and senescence marker expression in stromal cells treated differently as described in (a). GAPDH, loading control. Chromatin fractionation was performed to evaluate KDM4A/B levels in nuclei, histone H3 as a nuclear lysate loading control. c, Immunoblot assay of DDR signaling, H3K9/H3K36 methylation, CXCL8 and senescence marker expression in cells treated with BLEO and/or Chaetocin. GPADH, loading control. SE, short exposure. LE, long exposure. d, Representative images of SA-β-Gal and BrdU staining of PSC27 treated in the ways described in (a). Scale bar, 20 μm. e, Comparative statistics of SA-β-Gal and BrdU staining results of stromal cells in the individual conditions of (a). Upper, SA-β-Gal staining. Lower, BrdU staining. f, Immunoblot analysis of key targets expressed in PSC27 sublines depleted of KDM4A or KDM4B via lentiviral transduction and/or subject to genotoxic stress by BLEO. g, Transcript expression of hallmark SASP factors in PSC27 sublines transduced with lentiviral constructs encoding shRNAs specific for KDM4B. Scrambled, transduction control. Cells subject to vehicle or BLEO treatment before analyzed. h, Comparative statistics of SA-β-Gal staining results of stromal cells transduced with a lentiviral construct encoding human KDM4A or 4B and/or exposed to BLEO treatment before processed. i, Comparative statistics of BrdU staining results of stromal cells transduced with a lentiviral construct encoding human KDM4A or 4B and/or exposed to BLEO treatment before processed. Data in all bar plots are shown as mean ± SD and representative of 3 biological replicates. a, e, g, P values were determined by two-sided unpaired t-test, and adjusted for multiple comparisons. Data in b-c, d, f are representative of 3 biological replicates. h-i, P values were determined by one-way ANOVA, and adjusted for multiple comparisons.
Extended Data Fig. 5 |
Extended Data Fig. 5 |. Targeting KDM4 reduces prostate cancer malignancy driven by senescent stromal cells.
a, Immunoblot analysis of KDM4A/B expression, H3K9/H3K36 methylation, CXCL8 and senescence marker expression in PSC27 treated by BLEO and/or ML324, a small molecule inhibitor of KDM4. GAPDH, loading control. b, GSEA profiling of gene expression with significant enrichment scores exhibiting an NF-κB-specific signature in BLEO/ ML324 co-treated cells compared with BLEO only-treated cells. c, Growth curve assessment of PSC27 cells upon exposure to BLEO, ML324 or both. Cells were counted at indicated timepoints after initiation of assays. d, Heatmap depicting the influence of DNA damage and ML324 on transcriptomic expression profile of PSC27 cells. Genes displayed are downregulated upon BLEO-induced cellular senescence, and sorted by their expression fold change in response to ML324 treatment (in descending order). e, Measurement of in vitro proliferation of prostate cancer (PCa) cells after exposure to the conditioned media (CM) of stromal cells treated by BLEO, ML324 or both, or transduced with individual shRNAs to deplete KDM4A/B. DMEM, routine media for PCa cell culture supplemented with 10%FBS. f, Assessment of in vitro migration of PCa cells after exposure to the CM of stromal cells treated as described in (e). g, Evaluation of in vitro invasion of PCa cells after exposure to the CM of stromal cells treated as described in (e). h, Chemoresistance of PCa cells to the cytotoxic agent mitoxantrone (MIT) given at the IC50 value of individual PCa cell lines upon culture with the CM described in (e). i, Representative images of PC3 cells upon treatment with the CM as described in (e). BM, BLEO/ML324. Scale bar, 100 μm. Data are shown as mean ± SD and representative of 3 independent experiments. Data in a, i are representative of 3 biological replicates. b, Statistical significance was calculated using one-way ANOVA with Tukey’ s post hoc comparison. c, P value was determined by two-way ANOVA, and adjusted for multiple comparisons. eh, P values were determined by two-sided unpaired t-test, and adjusted for multiple comparisons.
Extended Data Fig. 6 |
Extended Data Fig. 6 |. Chromatin accessibility declines in senescent cells but subject to reversal by ML324.
a, Heatmaps showing ATAC-seq enrichment of peaks near the accessible promoters (3.0 kb upstream and downstream TSS per gene) present in each of the assayed stromal samples (totally 9). Enrichment signals were collected for all active TSSs which were assorted by cap analysis of gene expression (CAGE) values, with peaks defined by hierarchical clustering. b, Heatmap displaying representative genes whose accessibility decreased upon cellular senescence but increased when cells were treated by ML324. c, The UCSC browser views show enrichment of ATAC-seq signals near the promoters of CMMD9, PRR5L, TRAF6, RAG1 and IFTAP, genes not correlated with the SASP. d, The UCSC browser views depict enrichment of ATAC-seq signals near the promoters of several SASP factors including AREG, SPINK1, MMP3 and WNT16B. e, The UCSC browser views manifest enrichment of ATAC-seq signals near the promoters of CDKN2A (p16INK4a) and TP53 (p53), genes correlated with cellular senescence.
Extended Data Fig. 7 |
Extended Data Fig. 7 |. ChIP-seq profiling of H3K9m3 and H3K36me3 and KDM4A ChIP-PCR to reveal epigenetic changes.
a, Genome browser views showing the distribution and intensity of peaks flanking the genomic sequences of genes associated with the SASP or cellular senescence, or genes involved in the SASP regulation. The transparent light purple boxs represent the area around the proximal TSS, body or TES region per gene. TSS, transcription start site. TES, transcription end site. b, Independent ChIP-qPCR assays for selected TSS of representative SASP factors bound by the demethylase KDM4A. The data indicate increased signal intensities in BLEO-induced senescent cells but diminished upon ML324 treatment. TSSs of p16INK4a and p21CIP1 were probed as parallel experiments. Data are shown as mean ± SD and representative of 3 independent experiments. P values were determined by two-sided unpaired t-test, and adjusted for multiple comparisons.
Extended Data Fig. 8 |
Extended Data Fig. 8 |. Preclinical scheme, tumor assessment and SASP analysis.
a, Schematic illustration of drug administration and tumor surveillance. Cancer cells (PC3) alone or alongside stromal cells (PSC27) were inoculated subcutaneously to NOC/SCID mice 2 weeks prior to chemotherapy. MIT was provided on the 1st day of each week starting from the 3rd week, then given every other week with a total number of 3 doses. b, Statistics of tumor end volumes. PC3 cells were xenografted to animal hind flank. MIT was administered to induce tumor regression, alone or together with ML324. c, Growth curves of tumors grown in PC3 mice subjected to indicated treatments. Measurements started from the 14th day after tumor xenografting until end of the regimen. d, Growth curves of tumors grown in PC3/PSC27 mice subjected to indicated treatments. Measurement period was the same as described in (c). e, Statistical profiling of tumor end volumes. PC3 cells were xenografted alone or alongside with PSC27 cells (pre-transduced with scramble or KDM4A/B-specific shRNAs via lentivirus) to the hind flank of NOD/SCID mice. Chemotherapeutic agent MIT was used to treat animals. Constructs encoding shRNAs were transduced to cancer or stromal cells in experiments depicted on the left and right parts as indicated, respectively. f, Quantitative transcript analysis of E-cadherin and vimentin, cell lineage-specific markers for epithelial and stromal cells, respectively. g, Transcript analysis of canonical SASP factors expressed in epithelial and stromal cells, respectively. Individual cell types were isolated from tumor tissues via LCM. Expression of p16INK4a and p21CIP1 was measured to determine in vivo cellular senescence. Data shown as mean ± SD and representative of 3 independent experiments. c,d, P values were determined by two-way ANOVA, and adjusted for multiple comparisons. e, P values were determined by one-way ANOVA, and adjusted for multiple comparisons. b, fg, P values were determined by two-sided unpaired t-test, and adjusted for multiple comparisons. fg, median, 25th and 75th percentiles, with Turkey whispers indicated in box-and-whisker plots and extending to values no further than 1.5 × IQR from either upper or lower hinge.
Extended Data Fig. 9 |
Extended Data Fig. 9 |. In tissue assessment of SASP and epigenetic factors.
a, Histological evaluation of KDM4A expression in tumor tissues. Left, representative images of IHC staining. Scale bar, 50 μm. Right, pathological scores (in a range of 1–4, averaged from 3 independent readings/animal) of KDM4A expressed in tumor tissues. b, Comparative evaluation of KDM4A expression in epithelial versus stromal cells isolated via LCM-based cell lineage-specific capture from the TME niche. Note, KDM4A induction was mainly observed in stroma upon MIT-mediated chemotherapeutic treatment. c, Histological evaluation of KDM4B expression in tumor tissues. At the end of therapeutic regimen, animals were sacrificed, with tissues processed for immunohistochemical (IHC) staining. Left, representative images of IHC staining. Scale bar, 50 μm. Right, pathological scores as described for a panel. d, Comparative evaluation of KDM4B transcript levels in epithelial versus stromal cells isolated via LCM-based cell lineage-specific capture from the TME niche. e, Histological evaluation of H3K9me3 and H3K36me3 in tumor tissues. At the end of therapeutic regimen, animals were sacrificed, with tissues processed for immunohistochemical (IHC) staining. Left, representative images of IHC staining. Scale bar, 100 μm. Green arrows, representative stromal cells. Right, statistical comparison of pathological scores (in a range of 1–4, averaged from 3 independent readings/animal) of H3K9me3 and H3K36me3 detected in tumor tissues. f, Heatmap depicting gene expression profile in stromal cells (PSC27) transplanted to experimental mice which experienced different therapeutic regimens. Cells were acquired through LCM after completion of treatments and histological process. Red stars, the SASP factors. Data are shown as mean ± SD and representative of 3 independent experiments. a (right panel), b, c (right panel), d, and e (right panel), P values were determined by two-sided unpaired t-test, and adjusted for multiple comparisons. b, d, Median, 25th and 75th percentiles, with Turkey whispers indicated in box-and-whisker plots and extending to values no further than 1.5 × IQR from either upper or lower hinge.
Extended Data Fig. 10 |
Extended Data Fig. 10 |. Clinical landscape of human KDM4 in cancer genomics.
a, OncoPrint view of human KDM4 alterations. Multidimensional cancer genomics datasets of KDM4 mutations in human prostate cancer (PCa) patients were mapped. Data from 3317 patients (3480 biospecimens) out of 10 individual clinical studies were subject to analysis and visualization, with source data from the Cancer Genome Atlas (TCGA), a landmark cancer genomics program. Top columns, individual patients affected by particular alterations. b, OncoPrint view of similar genomics mapping presentation of human KDM4 alterations in breast cancer (BCa) patients. Data from 4559 patients (4625 biospecimens) out of 10 individual clinical studies were incorporated. Source data derived from the TCGA portal. c, Cancer type-specific summary of human KDM4 mutations in PCa patients. Data were pooled from 8 separate studies that reported single-site mutations, amplifications, deep deletions and multiple alterations of human KDM4. d, Cancer type-specific summary of human KDM4 mutations in BCa patients. Data were pooled from 10 separate studies that reported single-site mutations, fusions, amplifications, deep deletions and multiple alterations of human KDM4.
Fig. 1.
Fig. 1.. Histone H3 Lysine Sites Are Epigenetically Modified upon Cellular Senescence.
a, Technical scheme of SILAC-based identification of intracellular proteins in presenescent versus senescent cells of the human stromal line PSC27. PRE cells, presenescent cells. SEN cells, senescent cells. b, Column statistics of different categories of protein molecules in output data after SILAC analysis. *, identified proteins (732). Data representative of 3 independent experiments. c, Scatterplot of proteins identified by SILAC procedure. Protein sequence coverage was plotted against protein mass (447 quantifiable). d, A representative plot derived from characterization of tandem mass spectrometry (MS/MS) based quantitative proteomics profiling. For MS scans, the m/z scan range was 100 to 1100. Intact peptides were detected in the Orbitrap at a resolution of 70,000. e, Heatmap depicting genes significantly upregulated in SEN cells after bleomycin treatment. CTRL, control. BLEO, bleomycin. Genes are ordered by their expression fold change (highest on top) in PRE versus SEN cells after RNA-seq. f, Immunoblot analysis of key molecules in DNA damage repair, cellular senescence and the SASP in PSC27 cells induced to senescence by chemotherapeutic agents (TIS), replicative exhaustion (RS), or oncogene activation (OIS). PN, passage number. p15, p25, p35 representing different passages in culture. Vector, empty control for human HRasG12V. H3K9me2/3 and H3K36me2/3, histone H3 methylation markers. g, Immunofluorescence staining of γH2AX, H3K9me3, and H3K36me3 in PSC27 cells after chemotherapeutic treatment (SAT, BLEO, and MIT), replicative exhaustion (REP), or oncogene activation (HRasG12V). SAT, satraplatin. BLEO, bleomycin. MIT, mitoxantrone. Scale bars, 5 μm. Data in f-g are representative of 3 independent biological replicates.
Fig. 2.
Fig. 2.. KDM4A and KDM4B Are Expressed in Human Prostate Tumor Stroma and Correlate with Adverse Clinical Survival.
a, Histological images of KDM4A/B in human prostate cancer (PCa) tissues. Left, before chemotherapy. Right, after chemotherapy. Scale bars, 100 μm. b, Pathological assessment of stromal KDM4A/B in PCa tissues (42 untreated versus 48 treated). Patients pathologically assigned into 4 categories per IHC staining intensity in stroma. 1, negative; 2, weak; 3, moderate; 4, strong expression. P values were determined by two-way ANOVA with Bonferroni’s post-hoc test. c, Comparative analysis of KDM4A/B before and after chemotherapy. Each dot represents an individual patient, with the data of “before” (B) and “after” (A) connected to allow direct profiling per individual. P values determined by two-sided unpaired t-test. ^, P > 0.05. *, P < 0.05. From left to right, P = 0.6152, P = 0.8451, P = 0.0486, P = 0.5253, P = 0.7660, P = 0.8279, P = 0.0179, P = 0.4612. d, Landscape of pathological correlation between KDM4A/B, CXCL8, WNT16B, p16INK4a, p21CIP1, Ki67 and PCNA in stroma of PCa patients after chemotherapy. Scores derived from histological assessment per factor (48 patients posttreatment). e, Statistical correlation (Pearson analysis) between pathological scores of KDM4A and CXCL8/WNT16B expressed in 48 PCa patients. P values were determined by two-sided unpaired t-test, and adjusted for multiple comparisons. f, Similar to data in e, correlation of KDM4B and CXCL8/WNT16B. g, Kaplan-Meier analysis of PCa patients. Disease-free survival (DFS) stratified according to KDM4A expression (low, average score < 2, green line, n = 20; high, average score ≥ 2, red line, n = 28). h, Kaplan-Meier analysis of PCa patients. DFS stratified according to KDM4B expression (low, average score < 2, yellow line, n = 22; high, average score ≥ 2, pink line, n = 26). Data in a are representative of 3 independent biological replicates. Statistics of g-h, survival curves derived from Kaplan-Meier analysis, with P value calculated using a two-sided log-rank (Mantel-Cox) test. Data in b are shown as mean ± SD and representative of 3 biological replicates.
Fig. 3.
Fig. 3.. KDM4 Expression Is Regulated Post-Translationally in Senescent Cells.
a, Time course analysis of KDM4 expression in PSC27 cells after bleomycin treatment. Cell lysates were collected at indicated time points posttreatment and subject to immunoblot assays. GAPDH, loading control. b, Time course measurement of transcript expression of KDM4 subfamily members and IL6, CXCL8, p16INK4a, and p21CIP1 in stromal cells after treatment. P values were determined by one-way ANOVA, and adjusted for multiple comparisons. c, Immunoblot of KDM4 expression in stromal cells treated by BLEO and/or cyclohexamide (CHX). Upper, schematic representation of experimental design and timeline. Cell lysates were collected at indicated time points after CHX addition to media. d, Immunoblot of KDM4 expression in stromal cells treated by BLEO and/or MG132. Cell lysates were collected after control or BLEO-induced senescent cells were treated by MG132 for 12 hr. e, Immunoblot appraisal of KDM4 protein levels in PSC27 treated by MG132. Cell lysates were collected at time points as indicated by the experimental scheme. f, Evaluation of KDM4 protein posttranslational modification via immunoprecipitation (IP) followed by immunoblot assays. Anti-KDM4A/B was used for IP, with precipitates subject to immunoblot assay with KDM4A/B antibody. Anti-ubiquitin was used to probe ubiquitination profile of KDM4A/B. g, Immunofluorescence staining of KDM4A/B and p-53BP1 in stromal cells. Cells were treated by BLEO and subject to immunofluorescence staining 7 days later. KDM4A/B, green. p-53BP1, red. Nuclei (DAPI), blue. Scale bars, 5 μm. h, Comparative statistics of the average number of foci where KDM4A/B and p-53BP1 are co-localized in damaged PSC27 per cell. i, Statistics of stromal cells displaying nuclear co-localization of KDM4A/B and p-53BP1 in control (CTRL) versus senescent (SEN) cells. P values were determined by two-way ANOVA with Bonferroni’s post-hoc test. j, Immunoblot assessment of KDM4 and H3K9/H3K36 methylation after chromatin fragmentation. Histone H3, loading control for nuclear lysates. Data in all bar plots are shown as mean ± SD and representative of 3 biological replicates. Data in a, c-d, e, g, f, j are representative of 3 replicates. b and h, P values were determined by two-sided unpaired t-test, and adjusted for multiple comparisons.
Fig. 4.
Fig. 4.. SASP Expression Is Enhanced but H3K9/H3K36 Methylation Is Attenuated by the Histone Demethylase KDM4A.
a, Quantitative assessment of SASP expression. PSC27 cells were transduced with a lentiviral construct encoding human KDM4A and/or exposed to BLEO before collected for expression assays. Signals normalized to CTRL cells (transduced with empty vector and untreated). b, Immunoblot assay of DNA damage repair (DDR) signaling, H3K9/H3K36 methylation, and SASP expression in cells processed in different ways as described in (a). GPADH, loading control. Chromatin fractionation performed to evaluate KDM4A/B in nuclei, histone H3 as nuclear lysate loading control. c, Representative images of SA-β-Gal and BrdU staining of PSC27 cells subject to treatment as described in (a). Scale bar, 10 μm. d, Comparative statistics of staining results of stromal cells in individual conditions of (a). Left, SA-β-Gal staining. Right, BrdU staining. e, Expression profiling of hallmark SASP factors in PSC27 sublines transduced with lentiviral constructs encoding KDM4A-specific shRNAs. Scrambled, shRNA control. Cells subject to vehicle or BLEO treatment before collection. f, Expression curves of hallmark SASP factors in stromal cells treated in conditions as described in (e). Cells lysed at the indicated time points after BLEO damage. g, Immunoblot assays of stromal cells transduced with lentiviral constructs encoding human SUV39H1 (full length), SETD2M (histone methylase domain SET, tagged with HA) or both. Cells were subject to BLEO treatment after transduction, lysates collected 7–10 days later. GAPDH, loading control. h, Immunoblot analysis of stromal cells treated with BLEO and/or BAY. Cell lysates were collected 7–10 days after treatment. Nuclear lysates were also prepared to assess nuclear translocation of representative NF-κB subunits, p65 (RelA) and p50/p105. GAPDH, loading control. BAY (Bay 11–7082), an NF-κB inhibitor. i, Quantitative assessment of SASP expression. Cells were subject to treatment(s) as described in (h). Signals normalized to CTRL cells per gene. Data in all bar plots shown as mean ± SD and representative of 3 biological replicates. In a, e, f, and i, P values were determined by two-sided unpaired t-test, and adjusted for multiple comparisons. Data in b, c, g, h are representative of 3 biological replicates.
Fig. 5.
Fig. 5.. Targeting KDM4 with a Small Molecule Inhibitor Interferes with the SASP but Not Cell Growth or Cell Cycle Arrest.
a, Heatmap depicting the influence of DNA damage and ML324, a selective chemical inhibitor of KDM4, on transcriptomic expression profile of PSC27 cells. Genes sorted by expression fold change when comparing between cells treated by CTRL versus BLEO (highest on top). Red stars, canonical SASP factors affected by ML324. b, Graphic visualization of pathways by GO profiling, significantly enriched genes were those downregulated and sorted according to their fold change when senescent cells were exposed to ML324. c, Venn diagram presentation of genes upregulated by BLEO (673, in relative to CTRL) and downregulated genes by ML324 (348, in relative to BLEO). d, GSEA profiling of gene expression with significant enrichment scores showing a SASP-specific signature in BLEO/ML324 co-treated cells compared with BLEO only-treated cells. e, In vitro colony formation assay of cells exposed to BLEO and/or ML324 treatment. Upper, representative images of crystal violet staining. Lower, comparative statistics. Scale bar, 200 μm. P values were determined by two-sided unpaired t-test, and adjusted for multiple comparisons. f, SA-β-Gal staining of cells after treatment by BLEO and/or ML324. Left, representative images. Scale bar, 10 μm. Right, statistics. g, BrdU staining of cells treated as described in (e). Left, images. Scale bar, 10 μm. Right, statistics. h, Time course expression of a subset of SASP factors (CXCL8, CSF2, CXCL1, and IL6). Cells were subject to BLEO and/or ML324 treatment. Data in all bar plots are shown as mean ± SD and representative of 3 biological replicates. d, Statistical significance was calculated using one-way ANOVA with Tukey’ s post hoc comparison. e (bottom panel), f and g (right panels), and h (all panels), P values were determined by two-sided unpaired t-test, and adjusted for multiple comparisons.
Fig. 6.
Fig. 6.. Accessible Chromatin Landscape in Senescent Cells and ML324-Mediated Suppression.
a, The average level of ATAC-seq enrichment (normalized) for the top 1,000 most active genes between proliferating cells, senescent cells (bleomycin-induced), and bleomycin/ML324 co-treated cells (marked as CTRL, BLEO, and BLEO/ML324, respectively). b, Heatmaps showing the expression (FPKM) of the SASP hallmark genes (RNA-seq, left) and the assessable chromatin enrichment (RPKM) (ATAC-seq, right) at their promoters (TSS ± 2.5 kb). Example genes are listed alongside each type of heatmap. c, Gene ontology (GO) analysis results for gene classes of significant expression fold change in proliferating versus senescent cells, and inhibited substantially upon ML324 treatment. Percentage of gene number among all upregulated genes in senescent cells, log10 of P value per class presented, with P < 0.05 (two-sided unpaired test) as significance. d, Heatmaps showing ATAC-seq enrichment of peaks near the accessible promoters (3.0 kb upstream of TSS and downstream of TES per gene) in each of the assayed samples. Enrichment signals were collected for all active TSSs and TESs, which were assorted by cap analysis of gene expression (CAGE) values, with peaks defined by hierarchical clustering. The top 1,000 genes of enrichment signals were selected for analysis. e, Heatmaps depicting ATAC-seq enrichment of peaks near the accessible promoters (3.0 kb upstream TSS and downstream TES per gene, respectively) present in each of the assayed samples. The whole genomic range was evaluated per sample. f, Transcription factor (TF) motifs identified from distal ATAC-seq peaks in each group’s samples. Only TFs expressed detectable (FPKM ≥ 5) and motif enrichment P value < 1 × 10⁻¹⁰ in each sample were included. g, The UCSC browser views show enrichment of ATAC-seq signals at the promoters of several SASP-unrelated genes (COMMD9, PRR5L, TRAF6, RAG1, and IFTAP) in contrast to those at the promotes of representative SASP factors (CXCL1, IL-1β, and IL6).
Fig. 7.
Fig. 7.. Therapeutically Targeting KDM4 in the Damaged TME Diminishes Cancer Resistance Conferred by Senescent Stroma.
a, Illustrative diagram for preclinical treatment of NOD/SCID mice. Two weeks after subcutaneous implantation and in vivo uptake of tissue recombinants, animals received either single (mono) or combinational (dual) agents administered as metronomic treatments. b, Statistical profiling of tumor end volumes. PC3 cells were xenografted alone or together with PSC27 cells. MIT was administered to induce tumor regression, alone or together with ML324. Right, representative images of tumors. c, Representative bioluminescence imaging (BLI) of PC3/PSC27 tumor‐bearing animals. Digital signals were proportional to in vivo luciferase activities measured by an IVIS device. d, Comparative imaging of in vivo senescence of tumor tissues by SA-β-gal staining. Scale bars, 200 μm. Right, violin plot of positivity statistics. e, Transcript assessment of in vivo expression of several canonical SASP factors in stromal cells isolated from tumors of NOD/SCID mice. Statistics performed with two-sided Mann-Whitney U-test, with upper and lower hinges representing 25th and 75th percentiles. Horizontal bars show the median value, and whiskers extend to the values no further than 1.5 ☓ IQR from either upper or lower hinge. f, Quantitative appraisal of SASP factor and senescence marker expression in stromal cells isolated from tumor tissues of animals. Signals per factor were normalized to vehicle-treated group. g, Statistical assessment of DNA damaged and apoptosis in preclinical biospecimens. Values presented as percentage of cells positively stained with antibodies against γ‐H2AX or caspase 3 (cleaved). h, Representative histological images of caspase 3 (cleaved) in tumors at the end of therapeutic regimes. Scale bars, 100 μm. i, Survival appraisal of mice sacrificed upon development of advanced bulky diseases. Survival duration calculated from the time of tissue recombinant injection until the day of death. Data analyzed by a two-sided log-rank (Mantel-Cox) test. Data in all bar plots shown as mean ± SD and representative of 3 biological replicates. b (left panel) and d (right panel), f and g, P values from two-sided unpaired t-test, and adjusted for multiple comparisons. Data in h are representative of 3 biological replicates.
Fig. 8.
Fig. 8.. Working model depicting epigenomic reprogramming and KDM4-mediated histone demethylation (H3K9/H3K36), events enabling SASP expression in senescent cells.
In genotoxic settings, senescent cells undergo irreversible DNA damage which triggers enhanced DDR signaling. Chromatin accessibility landscape is remodeled, with a set of activated transcription factors physically binding to the enhancers and promoters of senescence-associated genes including those encoding SASP factors. There is a strong concordance of clustering scheme and a close functional linkage between chromatin accessibility and transcriptional output. Future efforts to combine genome and epigenome sequencing, as well as to generate maps of chromosome conformation, will pave the way to tackling the non-coding genome in senescent cells. Importantly, technological pipelines demonstrating three dimensional epigenomes to allow identification of distinct modes of epigenetic regulation, and studies revealing dynamic engagement of key molecules including but not limited to KDM4 upon the onset of global re-configuration of chromatin and transcription machineries for genome activation, hold the potential to precisely define the epigenetic landscape of senescent cells. DDR, DNA damage repair. TF, transcription factor. SASP, senescence-associated secretory phenotype.

Comment in

References

    1. Parry AJ et al. NOTCH-mediated non-cell autonomous regulation of chromatin structure during senescence. Nat Commun 9, 1840 (2018). - PMC - PubMed
    1. Coppe JP et al. Senescence-associated secretory phenotypes reveal cell-nonautonomous functions of oncogenic RAS and the p53 tumor suppressor. PLoS biology 6, 2853–2868 (2008). - PMC - PubMed
    1. Kuilman T et al. Oncogene-induced senescence relayed by an interleukin-dependent inflammatory network. Cell 133, 1019–1031 (2008). - PubMed
    1. Acosta JC et al. Chemokine signaling via the CXCR2 receptor reinforces senescence. Cell 133, 1006–1018 (2008). - PubMed
    1. Song S, Lam E, Tchkonia T, Kirkland J & Sun Y Senescent Cells: Emerging Targets for Human Aging and Age-Related Diseases. Trends in biochemical sciences 45 (2020). - PMC - PubMed

Publication types