Identification of a competing endogenous RNA axis "SVIL-AS1/miR-103a/ICE1" associated with chemoresistance in lung adenocarcinoma by comprehensive bioinformatics analysis
- PMID: 34264003
- PMCID: PMC8419767
- DOI: 10.1002/cam4.4132
Identification of a competing endogenous RNA axis "SVIL-AS1/miR-103a/ICE1" associated with chemoresistance in lung adenocarcinoma by comprehensive bioinformatics analysis
Abstract
Background: Chemotherapy is an important treatment for lung cancer. The molecular mechanism of lung adenocarcinoma (LUAD) chemoresistance is not completely understood.
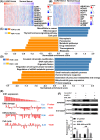
Methods: Weighted gene co-expression network analysis (WGCNA) was applied to screen the modules related to chemosensitivity using the data of LUAD patients receiving chemotherapy in The Cancer Genome Atlas database. GDCRNATools package was used to establish competing endogenous RNA (ceRNA) network based on the key chemotherapy-related module. Kaplan-Meier and risk models were used to analyze the influence of genes in the ceRNA network on the prognosis of LUAD patients receiving chemotherapy. Cell counting kit-8, reverse transcription-quantitative PCR, and dual-luciferase reporter assay were used to detect the effects of abnormal expression of genes in the ceRNA network on the proliferation and IC50 of cisplatin (DDP)-resistant LUAD cells, and the targeting relationship of genes in the ceRNA network. The signaling pathways and functions of ICE1 in LUAD were analyzed by LinkOmics and CancerSEA databases, and validated by Western blot.
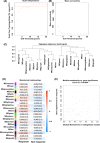
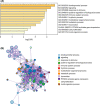
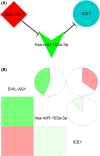
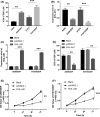
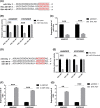
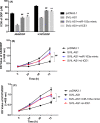
Results: Midnightblue module was the only WGCNA module positively correlated with chemosensitivity, in which the function of genes was related to cancer progression. SVIL-AS1/miR-103a/ICE1 was constructed based on midnightblue module. High expression of SVIl-AS1 and ICE1 corresponded to a favorable prognosis. High expression of miR-103a corresponded to a dismal prognosis. SVIl-AS1 was downregulated in DDP-resistant LUAD cells. SVIL-AS1 overexpression retarded the proliferation and DDP resistance of DDP-resistant LUAD cell. miR-103a was sponged by SVIL-AS1 and directly targeted ICE1. miR-103a overexpression and ICE1 knockdown overturned the suppressive effect of SVIL-AS1 overexpression on cell proliferation and DDP resistance. Further bioinformatics analysis and experimental verification showed that SVIL-AS1/miR-103a-3p/ICE1 axis can enhance DNA damage caused by chemotherapeutic agents.
Conclusions: SVIL-AS1 inhibited chemoresistance by acting as a sponge for miR-103a and upregulating ICE1 expression, which may be a potential therapeutic target for chemotherapy in LUAD.
Keywords: chemoresistance; competing endogenous RNA; lung adenocarcinoma; prognosis; weighted gene co-expression network analysis.
© 2021 The Authors. Cancer Medicine published by John Wiley & Sons Ltd.
Conflict of interest statement
The authors declare that they have no competing interest.
Figures


Similar articles
-
Downregulation of Linc00173 increases BCL2 mRNA stability via the miR-1275/PROCA1/ZFP36L2 axis and induces acquired cisplatin resistance of lung adenocarcinoma.J Exp Clin Cancer Res. 2023 Jan 10;42(1):12. doi: 10.1186/s13046-022-02560-6. J Exp Clin Cancer Res. 2023. PMID: 36627670 Free PMC article.
-
Clinical significance and biological function of PRKCQ-AS1/miR-582-3p expression in LUAD.Hereditas. 2025 Jul 1;162(1):116. doi: 10.1186/s41065-025-00482-9. Hereditas. 2025. PMID: 40597380 Free PMC article.
-
N6-methyladenosine-induced SVIL antisense RNA 1 restrains lung adenocarcinoma cell proliferation by destabilizing E2F1.Bioengineered. 2022 Feb;13(2):3093-3107. doi: 10.1080/21655979.2022.2025697. Bioengineered. 2022. PMID: 35068325 Free PMC article.
-
Predictions of the dysregulated competing endogenous RNA signature involved in the progression of human lung adenocarcinoma.Cancer Biomark. 2020;29(3):399-416. doi: 10.3233/CBM-200133. Cancer Biomark. 2020. PMID: 32741804
-
MicroRNA‑325: A comprehensive exploration of its multifaceted roles in cancer pathogenesis and therapeutic implications (Review).Oncol Lett. 2024 Jul 26;28(4):459. doi: 10.3892/ol.2024.14592. eCollection 2024 Oct. Oncol Lett. 2024. PMID: 39119235 Free PMC article. Review.
Cited by
-
Weighted Gene Co-Expression Network Analysis and Treatment Strategies of Tumor Recurrence-Associated Hub Genes in Lung Adenocarcinoma.Front Genet. 2021 Nov 16;12:756235. doi: 10.3389/fgene.2021.756235. eCollection 2021. Front Genet. 2021. PMID: 34868230 Free PMC article.
-
Engineered exosomes transporting the lncRNA, SVIL-AS1, inhibit the progression of lung cancer via targeting miR-21-5p.Am J Cancer Res. 2024 Jul 15;14(7):3335-3347. doi: 10.62347/YRJK5888. eCollection 2024. Am J Cancer Res. 2024. PMID: 39113865 Free PMC article.
-
Crosstalk among disulfidptosis-related lncRNAs in lung adenocarcinoma reveals a correlation with immune profile and clinical prognosis.Noncoding RNA Res. 2024 Mar 20;9(3):772-781. doi: 10.1016/j.ncrna.2024.03.006. eCollection 2024 Sep. Noncoding RNA Res. 2024. PMID: 38590434 Free PMC article.
-
Duality of the SVIL expression in bladder cancer and its correlation with immune infiltration.Sci Rep. 2023 Sep 5;13(1):14595. doi: 10.1038/s41598-023-41759-1. Sci Rep. 2023. PMID: 37670039 Free PMC article.
-
Integrated analysis to identify the AC005154.6/hsa-miR-29c-3p/CCNL2 axis as a novel prognostic biomarker associated with immune infiltration in prostate cancer.Cancer Cell Int. 2022 Nov 11;22(1):346. doi: 10.1186/s12935-022-02779-5. Cancer Cell Int. 2022. PMID: 36369040 Free PMC article.
References
-
- Ferlay J, Colombet M, Soerjomataram I, et al. Estimating the global cancer incidence and mortality in 2018: GLOBOCAN sources and methods. Int J Cancer. 2019;144:1941‐1953. - PubMed
-
- Yu J, Hou M, Pei T. FAM83A is a prognosis signature and potential oncogene of lung adenocarcinoma. DNA Cell Biol. 2020;39:890‐899. - PubMed
-
- Du L, Morgensztern D. Chemotherapy for advanced‐stage non‐small cell lung cancer. Cancer J. 2015;21:366‐370. - PubMed
Publication types
MeSH terms
Substances
Grants and funding
LinkOut - more resources
Full Text Sources
Research Materials
Miscellaneous

