. 2022 Jan;75(1):169-177.
doi: 10.1007/s12020-021-02822-x. Epub 2021 Jul 15.

Antitumor activity of Koningic acid in thyroid cancer by inhibiting cellular glycolysis

Affiliations

Antitumor activity of Koningic acid in thyroid cancer by inhibiting cellular glycolysis

Changxin Jing et al. Endocrine. 2022 Jan.

Abstract

Purpose: Koningic acid (KA), a sesquiterpene lactone, has been identified as an antimicrobial agent. Recent studies have revealed KA's antitumor activities in colorectal cancer, leukemia, and lung cancer. However, its antitumor effect in thyroid cancer remains largely unknown.

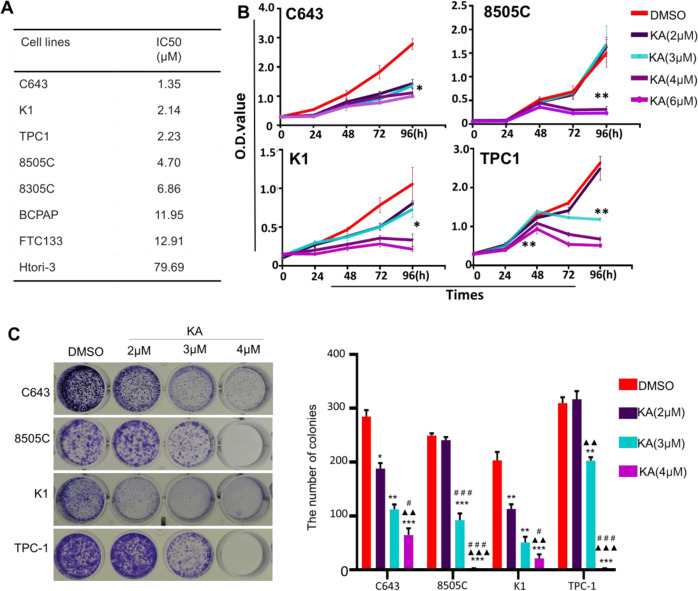
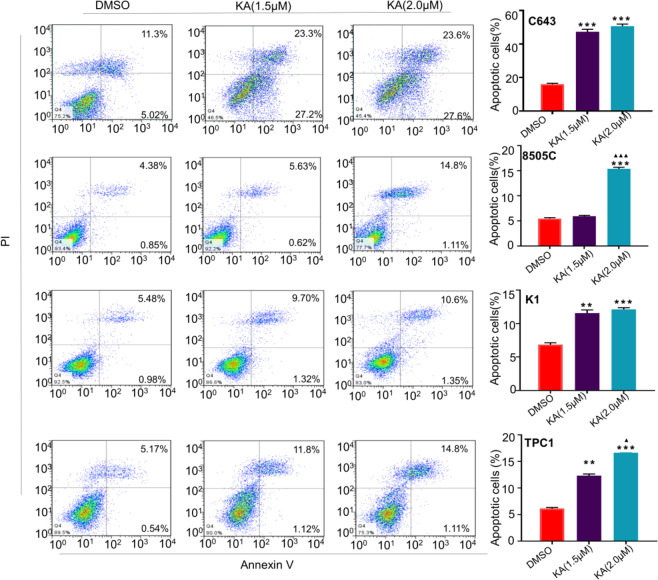
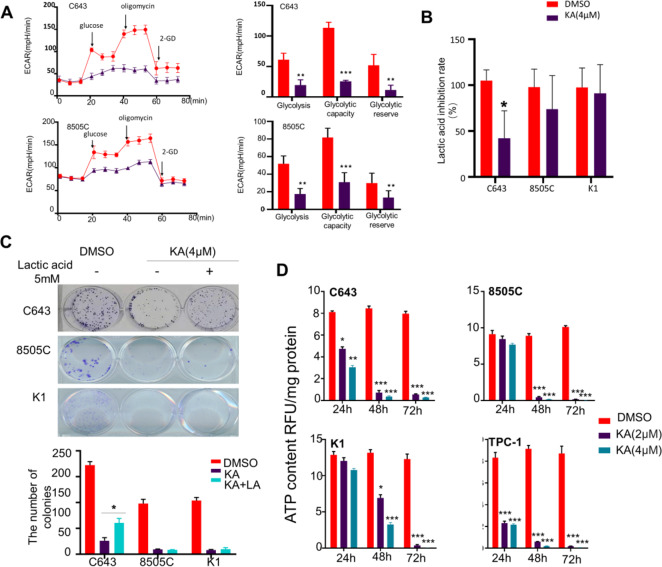
Methods: The effects of KA on proliferation, colony formation, apoptosis in thyroid cancer cells were assessed by MTT assay and flow cytometry. After KA treatment, the glycolysis ability of thyroid cancer cells was detected by ECAR, and the glycolytic products and relative ATP levels were measured by ELISA. The underlying mechanisms of antineoplastic activity of KA in thyroid cancer were detected by Western blot. Finally, the antineoplastic activity in vivo was observed in Xenograft mouse models.

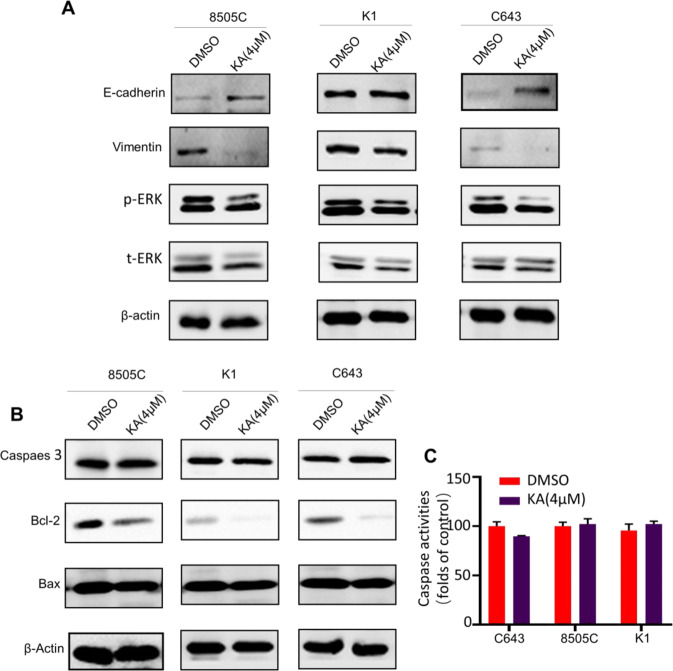
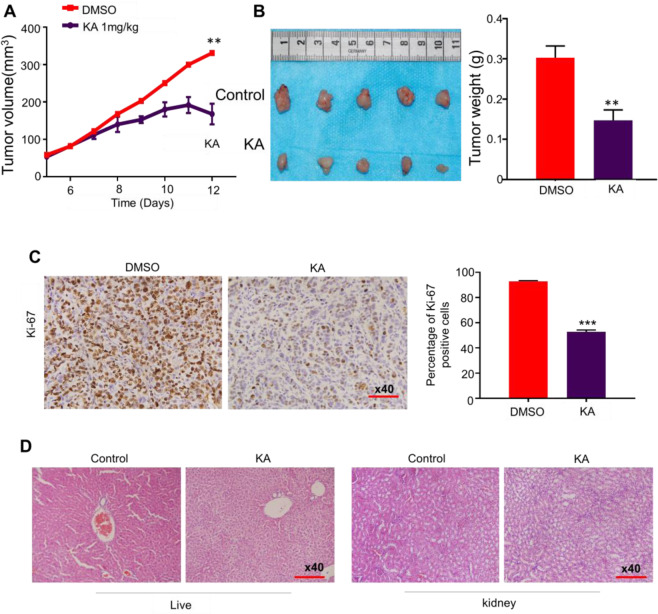
Results: KA inhibited the proliferation, colony formation, and increased cell apoptosis in thyroid cancer cell lines in a dose and time-dependent manner. We verified that the glycolysis ability, ATP production, and lactic acid level in thyroid cancer cells had experienced an extensive decrease after KA treatment. In addition, lactic acid, the metabolite of glycolysis, could weaken the effect of KA on its colony formation ability in C643 thyroid cancer cell line. Our data also showed that KA kills thyroid cancer cells by inhibiting the MAPK/ERK pathway and decreasing Bcl-2 level. By contrast with the control group, the growth of xenograft tumor was dramatically inhibited by KA without obvious drug side effects.

Conclusion: Our data demonstrate that KA kills thyroid cancer cell lines by inhibiting their glycolysis ability, the MAPK/ERK pathway and the Bcl-2 level and suggest that KA has potential clinical value in thyroid cancer therapy.

Keywords: ATP deprivation; Antineoplastic activity; Extracellular acidification rate; Glycolysis ability; Koningic acid; Thyroid cancer.


Conflict of interest statement

The authors declare no competing interests.

Figures

Fig. 1
Fig. 1
KA inhibits cell growth and colony formation capacity. A Thyroid cancer cell lines were treated with the indicated concentrations of KA for 24 h, followed by MTT assay to evaluate cell growth. IC50 values were calculated using the Reed–Muench method. B Selected four thyroid cancer cell lines were treated with the indicated concentrations of KA or vehicle control (DMSO) at the indicated time point, followed by MTT assay to evaluate the time course of cell proliferation. C Representative images of colony formation in 8505C, TPC-1, K1, and C643 cells treated with vehicle control (DMSO) or KA at the indicated concentrations are shown individually. Quantitative analysis of colony numbers is shown in right panel. Data are presented as mean ± SD of values from three different measurements. Statistically significant differences are indicated: *p < 0.05; **p < 0.01; ***p < 0.001 for comparison with control; ▲▲p < 0.01; ▲▲▲p < 0.001 for comparison with KA in 2 μM concentration; #p < 0.05; ##p < 0.01; ###p < 0.001 for comparison with KA in 3 μM concentration
Fig. 2
Fig. 2
Induction of apoptosis by KA in thyroid cancer cell lines. C643, 8505C, K1, and TPC-1 cells were treated with vehicle control (DMSO) or KA at the indicated concentrations for 48 h. The percentage of early apoptotic (bottom right quarter) and late apoptotic (top right) cells is resented in the figures (left panel). After treated with KA for 48 h, 2 μM KA induced a dramatic increase in both early and late apoptosis in four thyroid cancer cell lines compared to the control. The data are presented as mean ± SD of values from three independent experiments in the right panel. Statistically significant differences are indicated: *p < 0.05; **p < 0.01; ***p < 0.001 for comparison with control. ▲▲p < 0.01; ▲▲▲p < 0.001 for comparison with KA in 1.5 mM concentration
Fig. 3
Fig. 3
KA weaken the glycolytic ability of thyroid cancer cells. A ECAR is a standard and comprehensive method to assess the key parameters of glycolytic capacity. The Glycolytic Capacity of C643 and 8505C were significantly decrease after treated with KA compared with the control group. B After KA treatment for 24 h, the lactic acid production of thyroid cancer cell line C643 was significantly reduced, while 8505C and K1 cell lines were not. C 5 mM Lactic acid was added to the medium separately or simultaneously with 4 μM KA. 5 mM L-lactic acid could partially alleviate the antiproliferative activity of KA just only in C643 cell line. D The ATP levels experienced a rapid, extensive decrease in four thyroid cancer cell lines after treated with KA, while with the higher KA concentrations, accompanied by the more ATP deprivation. Data are presented as mean ± SD of values from three different measurands. Statistically significant differences are indicated: *p < 0.05; **p < 0.01; ***p < 0.001 for comparison with control
Fig. 4
Fig. 4
KA inhibits EMT, MAPK/ERK pathway and BCL-2 in thyroid cancer cells. A E‐cadherin was substantially upregulated, however Vimentin were significantly downregulated, with the following of reduced phosphorylation of ERK level in the KA-treated group compared with control. B The promoting apoptotic molecules Caspase 3 and Bax expression did not changed significantly, but the expression of Bcl-2 experienced downregulated significantly after treated with KA for 24 h. C There was no significant change in the activity of Caspase 3 after KA treatment in different cancer cee lines
Fig. 5
Fig. 5
Inhibition the growth of C643-derived xenograft tumor by KA. A Time course of tumor growth was measured in each group at the indicated time points of various treatments. B Pictures were tumor weight at the end time points of different treatments. Bar graphs represents mean tumor weight from mice with the indicated treatments. C Representative Ki-67 stain sections of xenograft tumors. Bar graphs represent mean ± SD of the numbers of Ki-67-positive cells from five microscopic fields in each group (right panel). D Representative H&E stain liver and kidney sections from the indicated mice. Statistically significant differences are indicated: *p < 0.05; **p < 0.01; ***p < 0.001 for comparison with control

References

    1. Bray F, Ferlay J, Soerjomataram I, et al. Global cancer statistics 2018: GLOBOCAN estimates of incidence and mortality worldwide for 36 cancers in 185 countries. CA Cancer J. Clin. 2018;68:394–424. doi: 10.3322/caac.21492. - DOI - PubMed
    1. Xing M. Molecular pathogenesis and mechanisms of thyroid cancer. Nat. Rev. Cancer. 2013;13:184–199. doi: 10.1038/nrc3431. - DOI - PMC - PubMed
    1. Gibson WJ, Ruan DT, Paulson VA, et al. Genomic heterogeneity and exceptional response to dual pathway inhibition in anaplastic thyroid cancer. Clin. Cancer Res. 2017;23:2367–2373. doi: 10.1158/1078-0432.CCR-16-2154-T. - DOI - PMC - PubMed
    1. Kim S, Yazici YD, Calzada G, et al. Sorafenib inhibits the angiogenesis and growth of orthotopic anaplastic thyroid carcinoma xenografts in nude mice. Mol. Cancer Ther. 2007;6:1785–1792. doi: 10.1158/1535-7163.MCT-06-0595. - DOI - PubMed
    1. Taccaliti A, Silvetti F, Palmonella G, et al. Anaplastic thyroid carcinoma. Front. Endocrinol. 2012;3:84. doi: 10.3389/fendo.2012.00084. - DOI - PMC - PubMed