. 2021 Sep 8;6(17):e149149.
doi: 10.1172/jci.insight.149149.

Endothelium-protective, histone-neutralizing properties of the polyanionic agent defibrotide

Affiliations

Endothelium-protective, histone-neutralizing properties of the polyanionic agent defibrotide

Hui Shi et al. JCI Insight. .

Abstract

Neutrophil-mediated activation and injury of the endothelium play roles in the pathogenesis of diverse disease states ranging from autoimmunity to cancer to COVID-19. Neutralization of cationic proteins (such as neutrophil extracellular trap-derived [NET-derived] histones) with polyanionic compounds has been suggested as a potential strategy for protecting the endothelium from such insults. Here, we report that the US Food and Drug Administration-approved polyanionic agent defibrotide (a pleiotropic mixture of oligonucleotides) directly engages histones and thereby blocks their pathological effects on endothelium. In vitro, defibrotide counteracted endothelial cell activation and pyroptosis-mediated cell death, whether triggered by purified NETs or recombinant histone H4. In vivo, defibrotide stabilized the endothelium and protected against histone-accelerated inferior vena cava thrombosis in mice. Mechanistically, defibrotide demonstrated direct and tight binding to histone H4 as detected by both electrophoretic mobility shift assay and surface plasmon resonance. Taken together, these data provide insights into the potential role of polyanionic compounds in protecting the endothelium from thromboinflammation with potential implications for myriad NET- and histone-accelerated disease states.

Keywords: Endothelial cells; Inflammation; Neutrophils; Thrombosis; Vascular Biology.


Conflict of interest statement

Conflict of interest: Defibrotide was provided by Jazz Pharmaceuticals. The work was also partially supported by a grant from Jazz Pharmaceuticals, which did not participate in study design or data analysis.

Figures

Figure 1
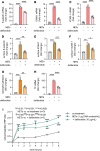
Figure 1. Defibrotide inhibits the activation and permeability of cultured HUVECs by NETs.
(AC) HUVECs were pretreated with defibrotide (10 μg/mL) for 30 minutes, followed by isolated NETs (1 μg DNA content/mL) for 4 hours. E-selectin (A), ICAM-1 (B), and VCAM-1 (C) mRNA levels were determined by qPCR. Mean ± SD is presented for 1 representative experiment out of 3 independent experiments, all with similar results; ****P < 0.0001 by 1-way ANOVA corrected by Dunnett’s test. (DF) HUVECs were pretreated with defibrotide (10 μg/mL) for 30 minutes, followed by the addition of NETs for 6 hours. Surface expression of E-selectin (D), ICAM-1 (E), and VCAM-1 (F) were then detected by in-cell ELISA. (G) HUVEC monolayers were pretreated with defibrotide (10 μg/mL) for 30 minutes, followed by NETs (1 μg DNA content/mL) for 4 hours. Calcein-AM–labeled neutrophils were then added as described in Methods. Mean ± SD is presented for n = 3 independent experiments; **P < 0.01 and ***P < 0.001 by 1-way ANOVA corrected by Dunnett’s test. (H) HUVECs were treated as for AC. Tissue factor mRNA levels were detected at 4 hours. Mean ± SD is presented for 1 representative experiment out of 3 independent experiments, all with similar results; ****P < 0.0001 as compared by 1-way ANOVA corrected by Dunnett’s test. (I) HUVECs were treated as for AC. Cell permeability was assessed by measuring horseradish peroxidase (HRP) movement through EC monolayers in a Transwell system as described in Methods. Mean ± SD is presented for 1 representative experiment out of 3 independent experiments, all with similar results; **P < 0.01, ***P < 0.001 and ****P < 0.0001 by 2-way ANOVA corrected by Tukey’s test. #P < 0.05, ###P < 0.001, and ####P < 0.0001 by 2-way ANOVA corrected by Tukey’s test.
Figure 2
Figure 2. Transcriptome profiling of HUVECs in response to NETs ± defibrotide.
(A) HUVECs were treated with vehicle (PBS), NETs (1 μg DNA content/mL), or NETs + defibrotide (10 μg/mL) for 4 hours (n = 3 per group). RNA sequencing was performed. K-means clustering of differentially expressed genes is presented as a heatmap. (B) Bubble plot of upregulated biological processes in the NETs group as compared with the vehicle group. Color-coding is based on P value, and bubble size is based on the number of genes in each pathway. (C) Bubble plot of downregulated biological processes in the NETs group as compared with the NETs + defibrotide group. DF, defibrotide.
Figure 3
Figure 3. NET-derived histone H4 induces HUVEC activation.
(AD) NETs (1 μg DNA content/mL) were incubated with antibodies to histone H4 (100 ng/mL) for 1 hour and then added to HUVECs for 4 hours. E-selectin (A), ICAM-1 (B), VCAM-1 (C), and tissue factor (TF) mRNA levels were determined by qPCR. Mean ± SD is presented for 1 representative experiment out of 3 independent experiments, all with similar results; *P < 0.05, **P < 0.01, ***P < 0.001,and ****P < 0.0001 by 1-way ANOVA corrected by Dunnett’s multiple comparison test.
Figure 4
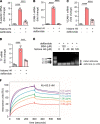
Figure 4. Defibrotide abolishes HUVEC activation by extracellular histone H4.
(AD) HUVECs were pretreated with defibrotide (10 μg/mL) for 30 minutes, followed by recombinant histone H4 (25 μg/mL) for 4 hours. E-selectin (A), ICAM-1 (B), VCAM-1 (C), and tissue factor (TF) (D) mRNA levels were determined by qPCR. Mean ± SD is presented for 1 representative experiment out of 3 independent experiments, all with similar results; ***P < 0.001, ****P < 0.0001 by 1-way ANOVA corrected by Dunnett’s test. (E) Defibrotide, and histone H4 were incubated at 37°C for 30 minutes and then resolved on a 0.5% agarose gel. (F) Surface plasmon resonance assay characterizing the binding kinetics of defibrotide to histone H4. The profile of defibrotide at gradient concentrations (from 0.39 μg/mL to 12.5 μg/mL) flowing over histone H4 protein immobilized on a NiNTA chip are shown. The calculated dissociation constant (KD) is labeled.
Figure 5
Figure 5. Defibrotide protects HUVECs from histone H4–mediated cell death.
(A) HUVECs were treated with different doses of histone H4 (0, 25, 50, and 100 μg/mL) in the presence or absence of defibrotide (20 μg/mL). After 24 hours, HUVECs were stained with crystal violet solution for 10 minutes, and absorbance was measured at 570 nm to determine cell viability. Mean ± SD for 3 independent experiments, along with representative images, are presented; **P < 0.01, ***P < 0.001, and ****P < 0.0001 by 1-way ANOVA corrected by Tukey’s multiple comparisons test. Scale bars: 500 μm. (B) HUVECs were treated with histone H4 (25 μg/mL) in the presence or absence of defibrotide (20 μg/mL, added at different time points relative to histone H4). After 24 hours, HUVECs were stained with crystal violet solution for 10 minutes, and absorbance was measured at 570 nm to determine cell viability. Mean ± SD is presented for 1 representative experiment out of 3 independent experiments,all with similar results; *P < 0.05 and ****P < 0.0001 by 1-way ANOVA corrected by Tukey’s test. (C) HUVECs were treated with histone H4 and different doses of defibrotide in the presence of annexin V red agent. The plate was imaged every hour using the IncuCyte S3 timelapse microscope for 30 hours. Mean ± SD is presented for 1 representative experiment out of 3 independent experiments,all with similar results; **P < 0.01 and ***P < 0.001 by 2-way ANOVA corrected by Dunnett’s test.
Figure 6
Figure 6. Defibrotide protects HUVECs from histone H4–mediated pyroptosis.
(A and B) HUVECs were treated with histone H4 (100 μg/mL) ± defibrotide (20 μg/mL) for 4 hours. The concentrations of IL-1β (A) and IL-18 (B) were determined in supernatants (n = 6 independent experiments); ***P < 0.001 and ****P < 0.0001 by 1-way ANOVA corrected by Dunnett’s test. Data were presented as mean ± SD. (C) Immunoblotting detection of activated gasdermin D (GSDMD) and caspase 3 in cell lysates. HUVECs were treated with histone H4 (100 μg/mL) or staurosporine (50 nM) for 6 hours before collecting the cell lysates. Con, control; H4, histone H4; stauro, staurosporine. (D and E) HUVECs were treated as in A and B, and HMGB1 translocation (D) and secretion (E) were determined by microscopy and supernatant ELISA, respectively (n = 3 independent experiments); ****P < 0.0001 by 1-way ANOVA corrected by Dunnett’s test. Scale bars: 100 μm (primary image) and 10 μm (inset). Data were presented as mean ± SD.
Figure 7
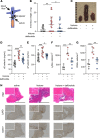
Figure 7. Defibrotide alleviates histone-mediated endothelial activation and venous thrombosis in mice.
(A) Thrombus initiation in the IVC via placement of a fixed suture over a spacer that was subsequently removed. (B) Mice were injected with either histone (10 mg/kg) or saline via tail vein 1 hour prior to surgery. Meanwhile, defibrotide (150 mg/kg) or saline was administered by retro-orbital injection 24 hours prior to surgery and then immediately following closure of the abdomen. Thrombus weight was determined 24 hours later. Scatter plots are presented, with each data point representing a unique mouse (horizontal bars represent mean + SD); *P < 0.05 and **P < 0.01 by Kruskal-Wallis test followed by Dunn’s multiple comparison test. Data were presented as mean ± SD. (C) Representative thrombi from the experiments presented in panel B with rulers measuring thrombi in millimeters. (D and E) Serum samples from the experiments presented in B were tested for soluble E-selectin (D) and soluble P-selectin (E) by ELISA; *P < 0.05, **P < 0.01, ***P < 0.001, and ****P < 0.0001 by 1-way ANOVA corrected by Dunn’s multiple comparison test. Data were presented as mean ± SD. (FH) Thrombus sections from B were stained for Ly6G+ and CD45+ cells. Positively stained cells were quantified in 4 randomly selected fields for each thrombus. **P < 0.01 and ***P < 0.001 by 1-way ANOVA corrected by Dunn’s multiple comparison test. Scale bars: 1000 μm. Data is presented as mean ± SD.

Update of

Comment in

References

    1. Nathan C. Neutrophils and immunity: challenges and opportunities. Nat Rev Immunol. 2006;6(3):173–182. doi: 10.1038/nri1785. - DOI - PubMed
    1. Brinkmann V, et al. Neutrophil extracellular traps kill bacteria. Science. 2004;303(5663):1532–1535. doi: 10.1126/science.1092385. - DOI - PubMed
    1. Sreeramkumar V, et al. Neutrophils scan for activated platelets to initiate inflammation. Science. 2014;346(6214):1234–1238. doi: 10.1126/science.1256478. - DOI - PMC - PubMed
    1. Semeraro F, et al. Histones induce phosphatidylserine exposure and a procoagulant phenotype in human red blood cells. J Thromb Haemost. 2014;12(10):1697–1702. doi: 10.1111/jth.12677. - DOI - PMC - PubMed
    1. Fuchs TA, et al. Extracellular DNA traps promote thrombosis. Proc Natl Acad Sci U S A. 2010;107(36):15880–15885. doi: 10.1073/pnas.1005743107. - DOI - PMC - PubMed

Publication types

MeSH terms