. 2021 Jul 15;16(7):e0252048.
doi: 10.1371/journal.pone.0252048. eCollection 2021.

Brigatinib causes tumor shrinkage in both NF2-deficient meningioma and schwannoma through inhibition of multiple tyrosine kinases but not ALK

Affiliations

Brigatinib causes tumor shrinkage in both NF2-deficient meningioma and schwannoma through inhibition of multiple tyrosine kinases but not ALK

Long-Sheng Chang et al. PLoS One. .

Abstract

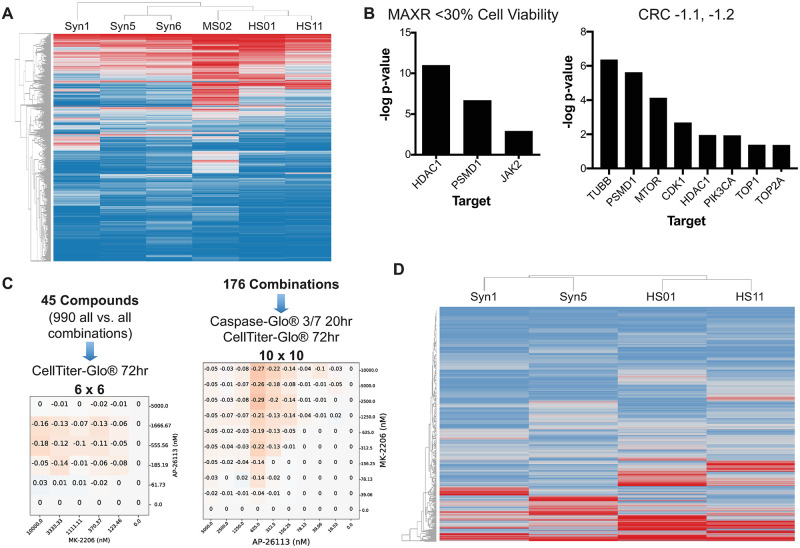
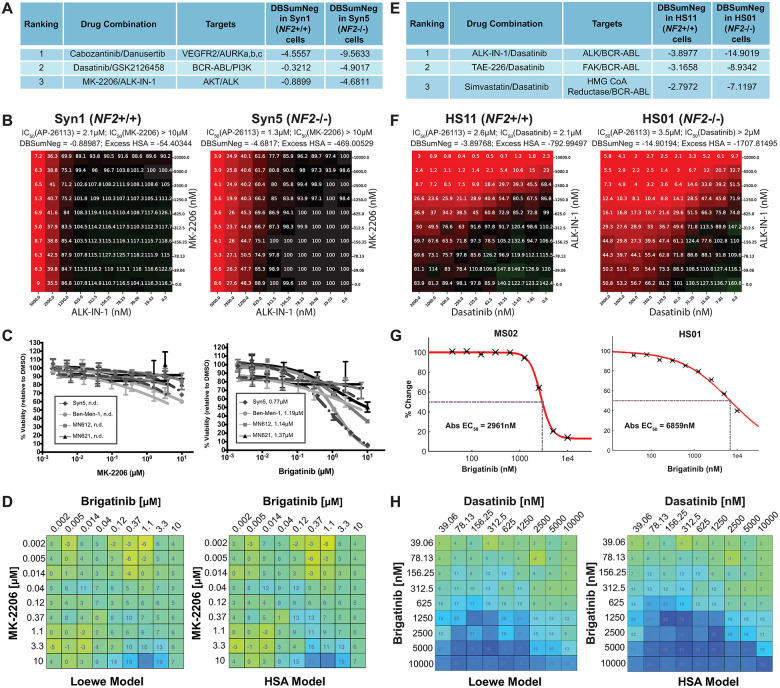
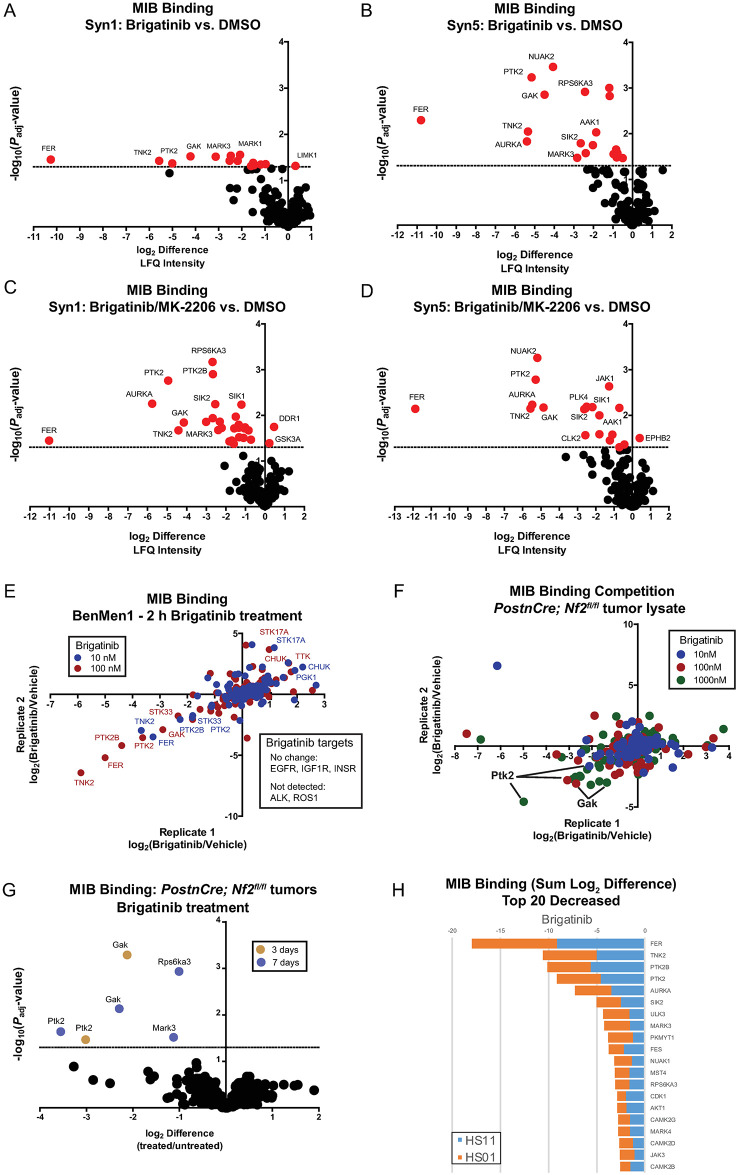
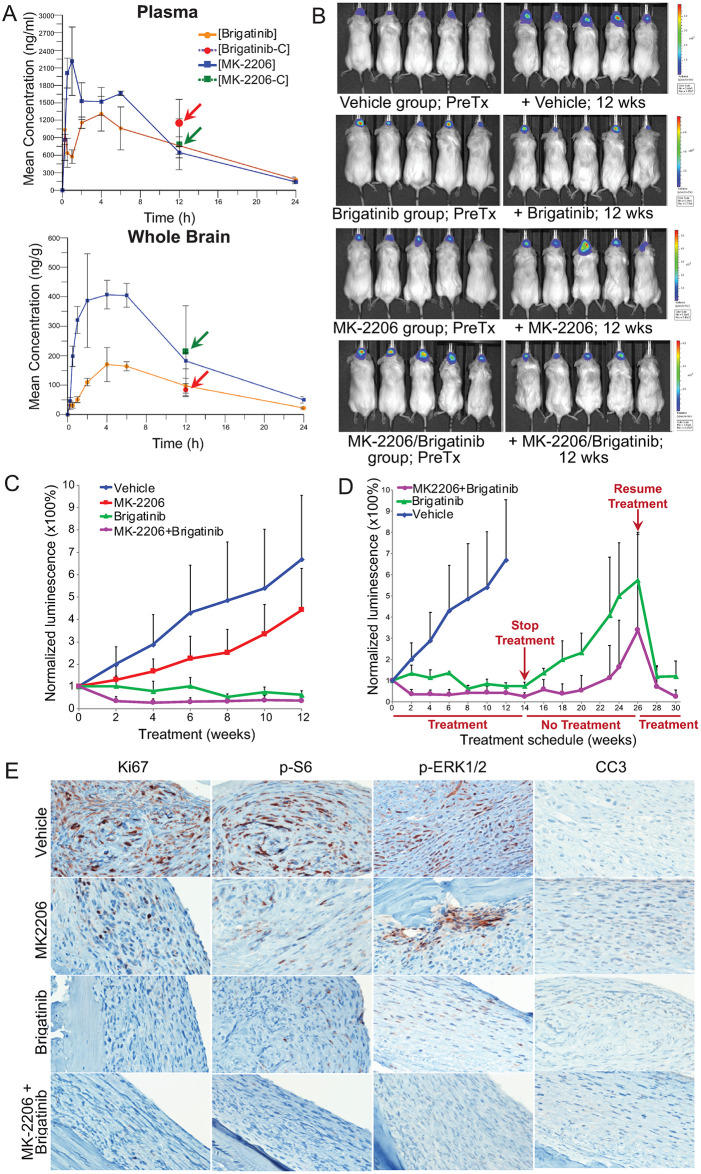
Neurofibromatosis Type 2 (NF2) is an autosomal dominant genetic syndrome caused by mutations in the NF2 tumor suppressor gene resulting in multiple schwannomas and meningiomas. There are no FDA approved therapies for these tumors and their relentless progression results in high rates of morbidity and mortality. Through a combination of high throughput screens, preclinical in vivo modeling, and evaluation of the kinome en masse, we identified actionable drug targets and efficacious experimental therapeutics for the treatment of NF2 related schwannomas and meningiomas. These efforts identified brigatinib (ALUNBRIG®), an FDA-approved inhibitor of multiple tyrosine kinases including ALK, to be a potent inhibitor of tumor growth in established NF2 deficient xenograft meningiomas and a genetically engineered murine model of spontaneous NF2 schwannomas. Surprisingly, neither meningioma nor schwannoma cells express ALK. Instead, we demonstrate that brigatinib inhibited multiple tyrosine kinases, including EphA2, Fer and focal adhesion kinase 1 (FAK1). These data demonstrate the power of the de novo unbiased approach for drug discovery and represents a major step forward in the advancement of therapeutics for the treatment of NF2 related malignancies.


Conflict of interest statement

No authors have competing interests.

Figures

Fig 1
Fig 1. Single-agent and matrix HTS of the oncology MIPE 4.0 collection in meningioma and schwannoma cells.
(A) Heat map of pharmacological responses (as % cell viability at the maximum dose tested, 46 μM, also called maximum response) of the MIPE 4.0 library in NF2-expressing Syn1 and NF2-null Syn5 human arachnoidal cells, NF2-deficient Ben-Men-1 (Syn6) meningioma cells, NF2-expressing HS11 and NF2-knockdown HS01 human Schwann cells, and Nf2-/- MS02 mouse schwannoma cells. Responses were clustered using a Hierarchical Clustering in Spotfire TIBCO. Red indicates low % cell viability and blue is high viability. (B) Target enrichment plots for pan active hits selected by % viability at the maximum concentration of compound tested (MAXR) <30% for both cell lines and all assay modes (top panel) and for pan active hits selected by CRCs -1.1 or -1.2 for both cell lines and all assay modes (bottom). The -log p-values were calculated as follows: Given a selection of compounds, the annotated targets for these compounds were identified and the enrichment for each target computed, compared to background, using the Fishers exact test. For this test, the background was defined as all the targets annotated in the MIPE collection. The p-value from the test was adjusted for multiple hypothesis testing using the Benjamini-Hochberg method. A -log p-value >1 was used as a cut-off to consider a target or processed being overrepresented. (C) Number of combinations tested and assays used for the 6x6 and 10x10 matrix combination HTS. Delta bliss 6x6 and 10x10 matrix plots for the combination of MK-2206 and ALK-IN-1 in Syn5 cells, using the CellTiterGlo viability assay. Darker color indicates higher DeltaBliss scores for synergy. (D) Heat map of DeltaBliss Sum Negative for the 990 6x6 all vs. all pairwise combinations of the 45 drugs selected from the single-agent testing. The IC50 and maximum % inhibition of each compound in each indicated cell line were calculated. Responses were clustered using a Hierarchical Clustering in Spotfire TIBCO. Red indicates low % cell viability and blue is high viability.
Fig 2
Fig 2. Like ALK-IN-1, brigatinib exhibited growth-inhibitory synergy with MK-2206 or dasatinib in meningioma and schwannoma cells.
(A) The top synergistic drug combinations identified for NF2-deficient meningioma cells. (B) 10x10 dose-viability response matrix of ALK-IN-1 vs MK-2206 in Syn1 and Syn5 cells, assessed at 72h. (C) Single-drug dose-response curves (DRCs) for MK-2206 (left) or brigatinib (27) were generated for human NF2-null cell lines, including Syn5, Ben-Men-1, and two primary meningiomas (MN612, MN621). Drug concentrations are outlined under Supplementary Methods in S1 File. n.d., not determined. Data is expressed as +/- SEM. (D) Combination treatment of Ben-Men-1 cells was carried out in a 10x10 dose-matrix format using the same increasing concentration range of MK-2206 and brigatinib as with single DRCs. Heatmaps were generated on a colorimetric scale using Combenefit software, which calculates the drug interaction effects (relative to vehicle/DMSO control). (E) The top synergistic drug combinations identified for NF2-related schwannoma cells. (F) 10x10 dose-viability response matrix of ALK-IN-1 vs dasatinib in HS11 and HS01 cells, assessed at 72h. (G) Brigatinib dose-response in mouse MS02 and human HS01 cells at 60 and 72h, respectively. (H) Loewe and highest single agent (HSA) synergy matrix analysis of brigatinib vs. dasatinib in HS01 cells treated for 72h.
Fig 3
Fig 3. MIB/MS kinome profiling reveals brigatinib target specificity in multiple NF2-deficient cell models.
(A-D) MIB/MS kinome profiling was performed following treatment of Syn1 and Syn5 cells with vehicle (DMSO), brigatinib (1μM) or the combination of MK-2206 (0.5μM) and brigatinib (1μM) for 24h in biological triplicate. MIB binding (log2LFQ intensities) were used for comparisons and the volcano plots indicate log2 difference and significance (5% FDR, indicated by dashed line). (E) MIB/MS kinome profiling was performed following treatment of Ben-Men-1 cells with vehicle (DMSO) or brigatinib (10nM, blue or 100nM, red) for 2h in biological duplicate. The log2 difference in MIB binding (LFQ intensity) was calculated and plotted relative to vehicle for each replicate. (F) Tumor lysates from the Postn-Cre;Nf2flox/flox mouse model were prepared and equal amounts of total protein were incubated for 2h with vehicle (0.001% ethanol) or brigatinib (10nM, blue; 100nM, red; 1000nM, green) in biological duplicate prior to MIB/MS kinome profiling. The log2 difference in MIB binding (LFQ intensity) was calculated and plotted relative to vehicle for each replicate. (G) Postn-Cre;Nf2flox/flox mice were treated with vehicle or brigatinib for 3 or 7 days (gold and blue, respectively, for indicated kinases). Tumors were harvested and subjected to MIB/MS kinome profiling. MIB binding (log2LFQ intensities) was determined and used for comparisons of brigatinib to vehicle treatment. The volcano plot indicates log2 difference and significance (5% FDR, indicated by dashed line). (H) HS11 and HS01 cells were treated with vehicle (DMSO) or brigatinib (1μM) for 24h prior to MIB/MS kinome profiling. MIB binding (log2LFQ intensities) was determined and the top 20 kinases with decreased MIB binding compared to vehicle are shown as a stacked bar plot for the two cell lines.
Fig 4
Fig 4. Brigatinib inhibits multiple RTKs, non-RTKs, and their downstream signals.
(A) Western blot analysis was conducted to detect ALK expression in Ben-Men-1 cells grown under various growth conditions and with or without brigatinib treatment. (B) Brigatinib treatment greatly reduced phosphorylation of non-RTKs FER and FAK, RTKs EPHA2 and ErbB3, and their downstream signaling molecules AKT, ERK1/2, and S6 in active growing Ben-Men-1 cells or growth-arrested cells stimulated with 20% serum. (C) Brigatinib blocked phosphorylation of EGFR, ErbB3, and IGF1R in growth-arrested Ben-Men-1 cells stimulated with each cognate ligand. (D) Brigatinib reduced the levels of p-FAK, p-ERK1/2, p-AKT, p-S6, and p-Gsk in Nf2 deficient murine Schwann Cells. (E) Brigatinib reduced phosphorylation of FAK, ERK1/2, MEK, AKT, S6RP, p70S6K, STAT3, and IGR in NF2-deficient HS01 human Schwann cells.
Fig 5
Fig 5. Brigatinib and its combination with MK-2206 effectively shrank intracranial meningioma xenografts.
(A) Pharmacokinetic (PK) analysis was conducted to determine the concentrations of brigatinib and MK-2206 in mouse plasma and brain. Mice were treated with a single maximum tolerated dose (MTD) of brigatinib or MK-2206. Prior to and at various times after dosing (n = 3 per time point), blood and brain from each dosed mouse were collected for UHPLC-MS/MS. The mean concentration of each drug at each indicated time point with standard deviation was plotted. Also, mice were treated with a combined dose of brigatinib and MK-2206 at their MTD (n = 3), and the drug concentration in the plasma and brain determined (indicated with arrows). (B-C) Mice with established meningioma xenografts were treated with vehicle, brigatinib, MK-2206, or brigatinib+MK-2206 by oral gavage (n = 10 each) and tumor growth was monitored by BLI. (B) Shown are representative BL images of tumor-bearing mice acquired prior to (PreTx) and 12 weeks (wks) after treatment. (C) The relative tumor-emitted BL signals were quantified and denoted as % of total flux after treatment relative to the total flux prior to treatment designated as one (100%). The data are shown as mean ± standard deviation. At least seven mice from each group completed the entire 12-week treatment. (D) Upon cessation of treatment, tumors in mice that had been treated with brigatinib or brigatinib+MK-2206 for 14 weeks (n = 4 each) regrew. However, tumor shrinkage was observed when the treatment was re-initiated. Data shown for mice treated with brigatinib or brigatinib+MK-2206 are only from the cage of mice that had undergone cessation of treatment and retreatment. (E) Representative images of immunostained sections of the heads of tumor-bearing mice after 12-week treatment with vehicle, MK-2206, brigatinib, or MK-2206+brigatinib for Ki67, p-S6, p-ERKs, and cleaved caspase 3 (CC3) expression.
Fig 6
Fig 6. Brigatinib, dasatinib, simvastatin and combination treatments in the schwannoma mouse model.
(A) Single-dose pharmacokinetics of compounds in PostnCre; Nf2flox/flox mice. Plasma compound concentrations were measured at baseline, 1, 2, 4, 8 and 24 hours after administering a single oral dose to n = 3 PostnCre; Nf2flox/flox mice. Parameters were calculated using a noncompartmental NCA-xls using PK add ins. (B) Volume of dorsal root ganglia (DRG) was measured post-mortem. All treatment groups had significantly smaller DRG volume when compared to vehicle, and brigatinib-treated DRGs showed the greatest reduction. One-Way ANOVA with Dunnett’s multiple comparison’s test; p = 0.0001(****), p = 0.0007(***), p<0.05(*). (C) Representative hematoxylin and eosin stained DRGs following 12 weeks of continuous treatment with the indicated drugs.

References

    1. Synodos for NFC, Allaway R, Angus SP, Beauchamp RL, Blakeley JO, Bott M, et al.. Traditional and systems biology based drug discovery for the rare tumor syndrome neurofibromatosis type 2. PLoS One. 2018;13(6):e0197350. doi: 10.1371/journal.pone.0197350 - DOI - PMC - PubMed
    1. Blakeley JO, Evans DG, Adler J, Brackmann D, Chen R, Ferner RE, et al.. Consensus recommendations for current treatments and accelerating clinical trials for patients with neurofibromatosis type 2. Am J Med Genet A. 2012;158A(1):24–41. doi: 10.1002/ajmg.a.34359 - DOI - PMC - PubMed
    1. Evans DG, Kalamarides M, Hunter-Schaedle K, Blakeley J, Allen J, Babovic-Vuskanovic D, et al.. Consensus recommendations to accelerate clinical trials for neurofibromatosis type 2. Clin Cancer Res. 2009;15(16):5032–9. doi: 10.1158/1078-0432.CCR-08-3011 - DOI - PMC - PubMed
    1. Cui Y, Groth S, Troutman S, Carlstedt A, Sperka T, Riecken LB, et al.. The NF2 tumor suppressor merlin interacts with Ras and RasGAP, which may modulate Ras signaling. Oncogene. 2019;38(36):6370–81. doi: 10.1038/s41388-019-0883-6 - DOI - PMC - PubMed
    1. Hadfield KD, Smith MJ, Urquhart JE, Wallace AJ, Bowers NL, King AT, et al.. Rates of loss of heterozygosity and mitotic recombination in NF2 schwannomas, sporadic vestibular schwannomas and schwannomatosis schwannomas. Oncogene. 2010;29(47):6216–21. doi: 10.1038/onc.2010.363 - DOI - PubMed

MeSH terms