. 2021 Sep 6;60(37):20325-20330.
doi: 10.1002/anie.202103228. Epub 2021 Aug 11.

Electrochemical Modulation of Carbon Monoxide-Mediated Cell Signaling

Affiliations

Electrochemical Modulation of Carbon Monoxide-Mediated Cell Signaling

Jimin Park et al. Angew Chem Int Ed Engl. .

Abstract

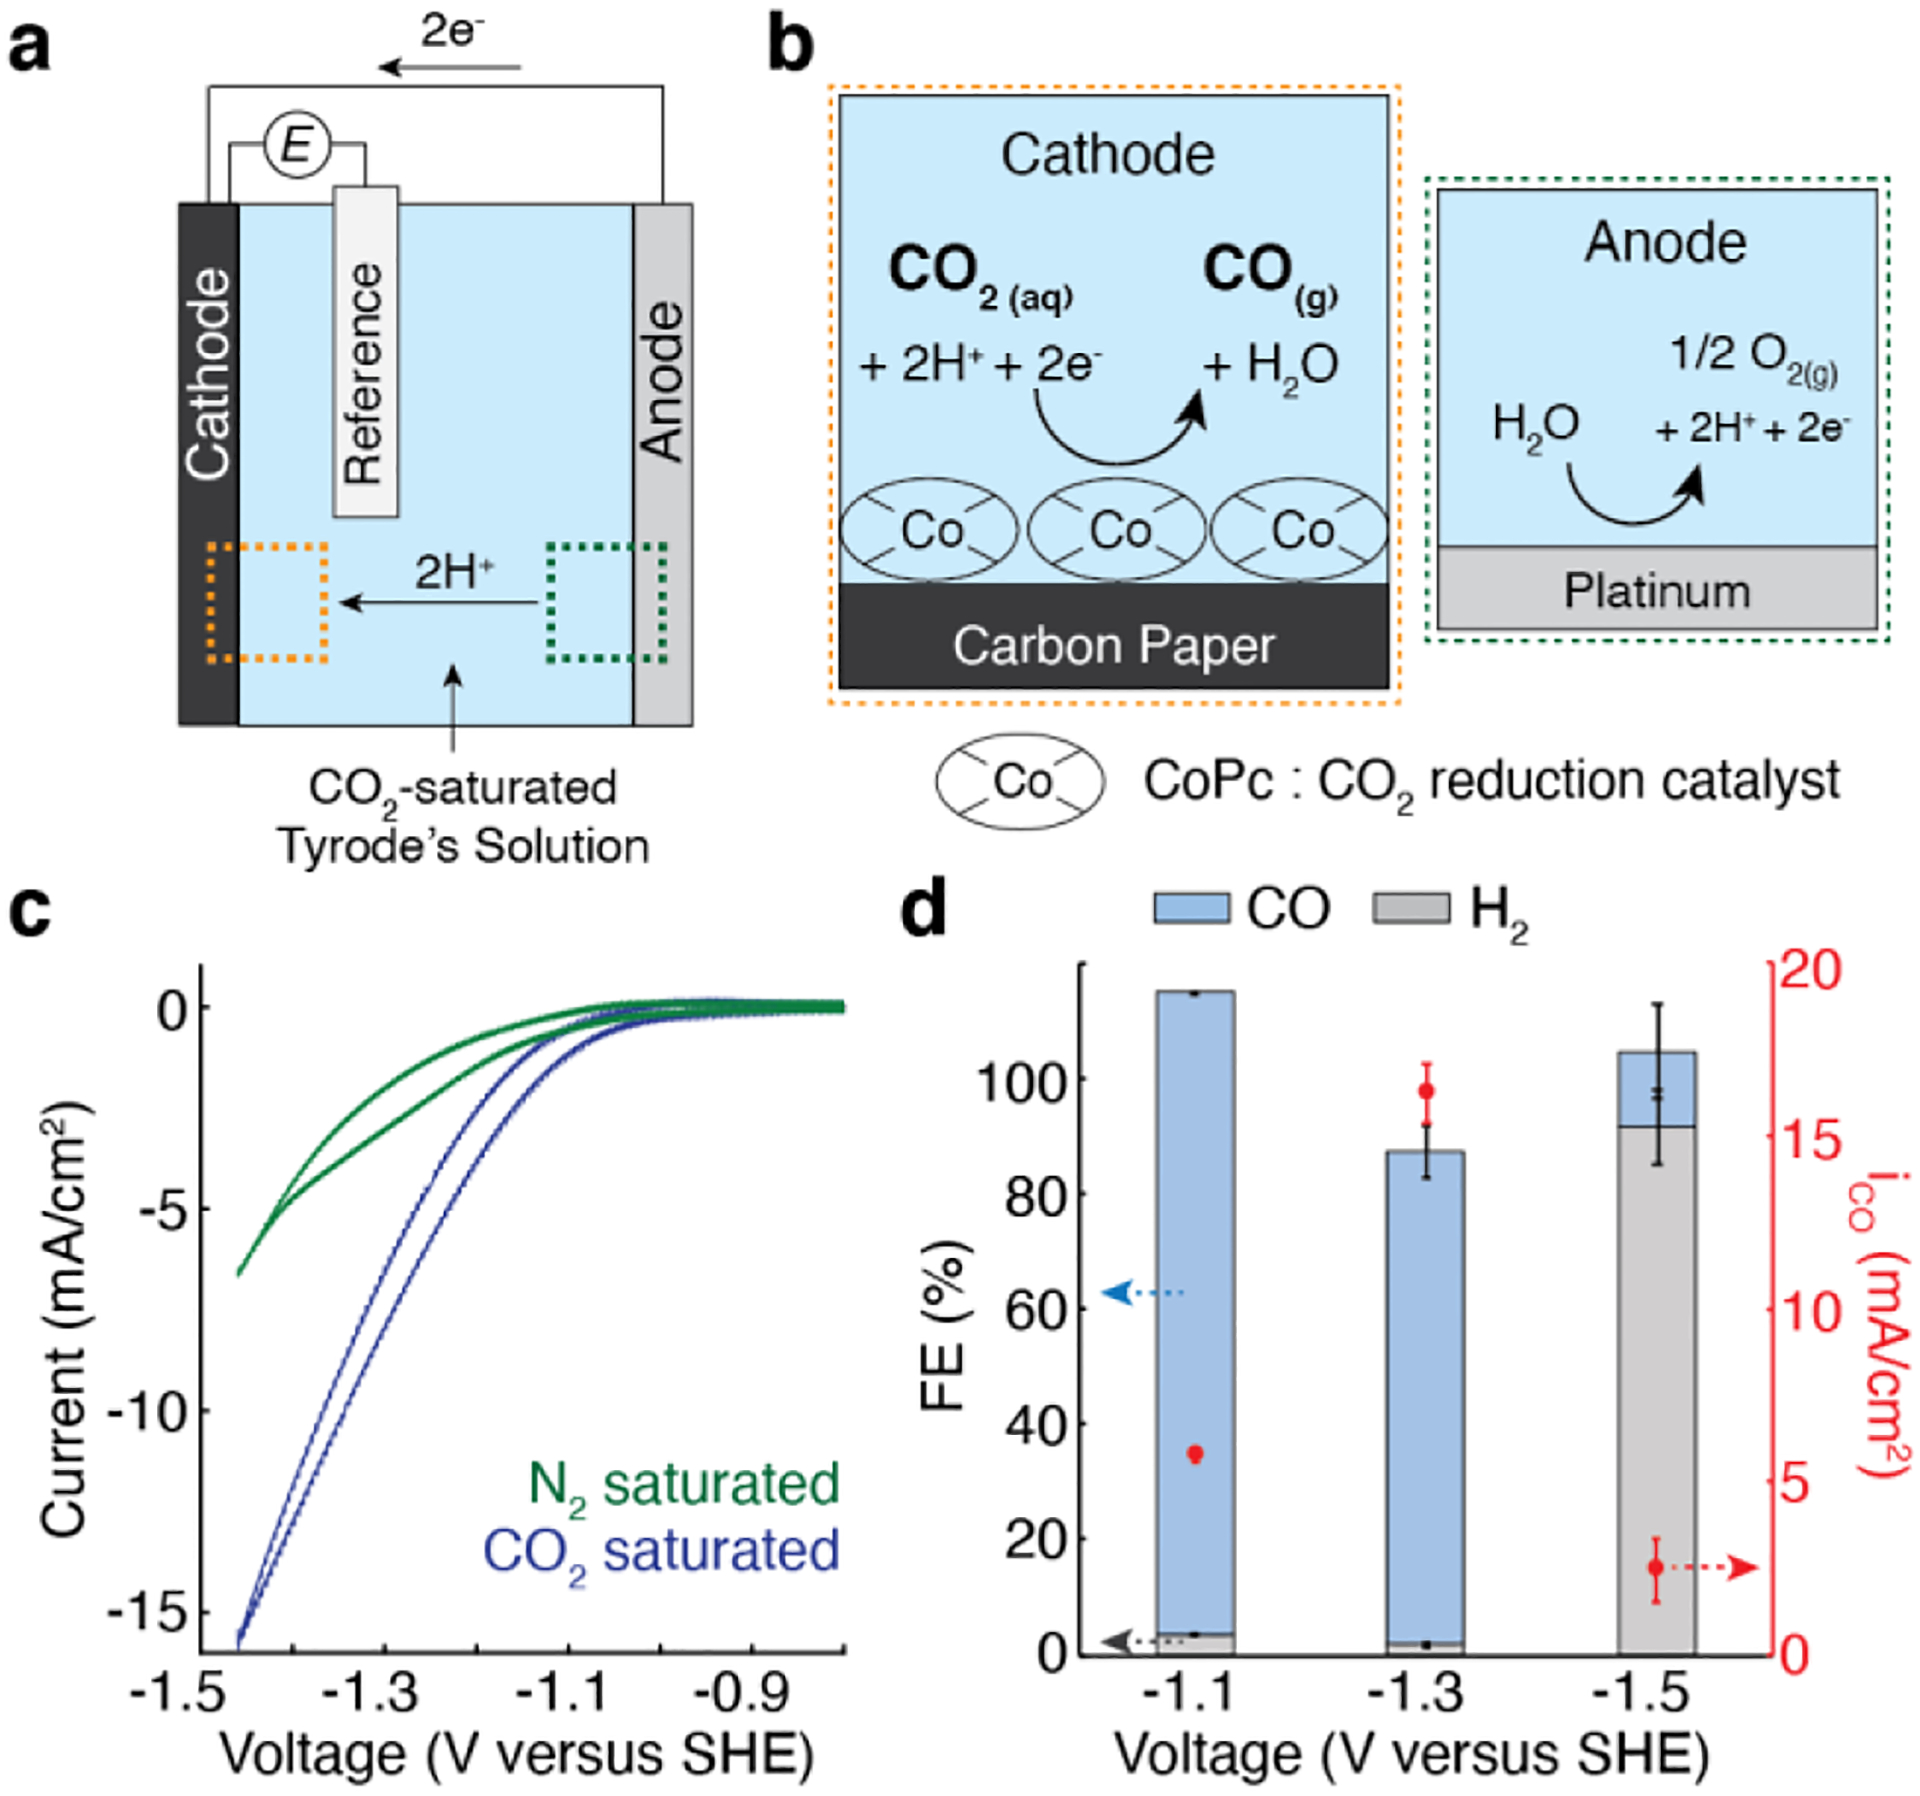
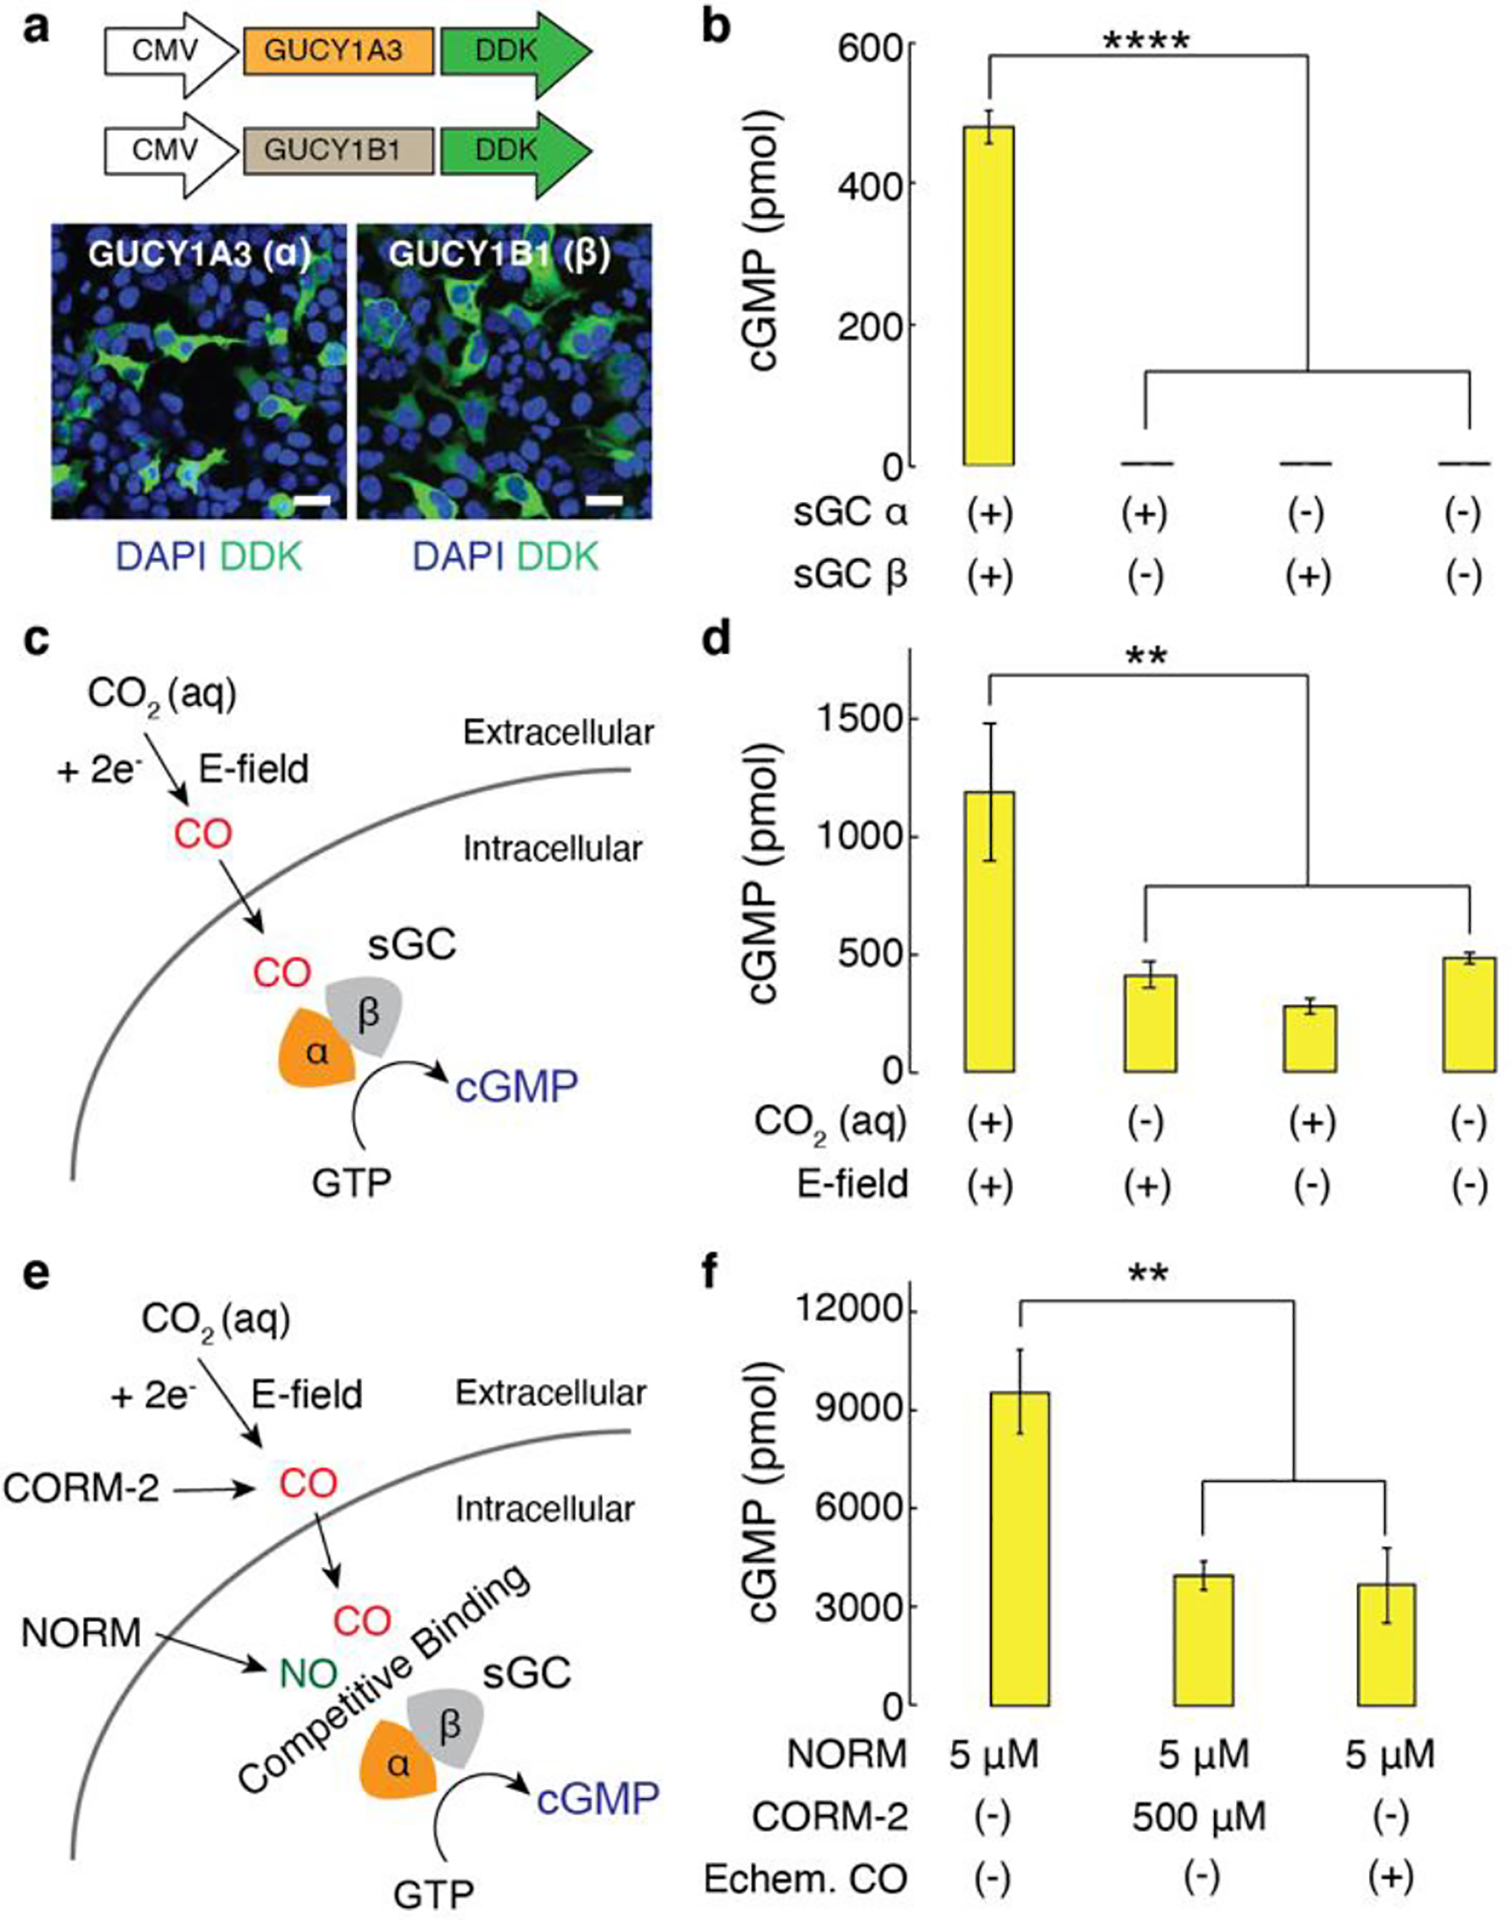
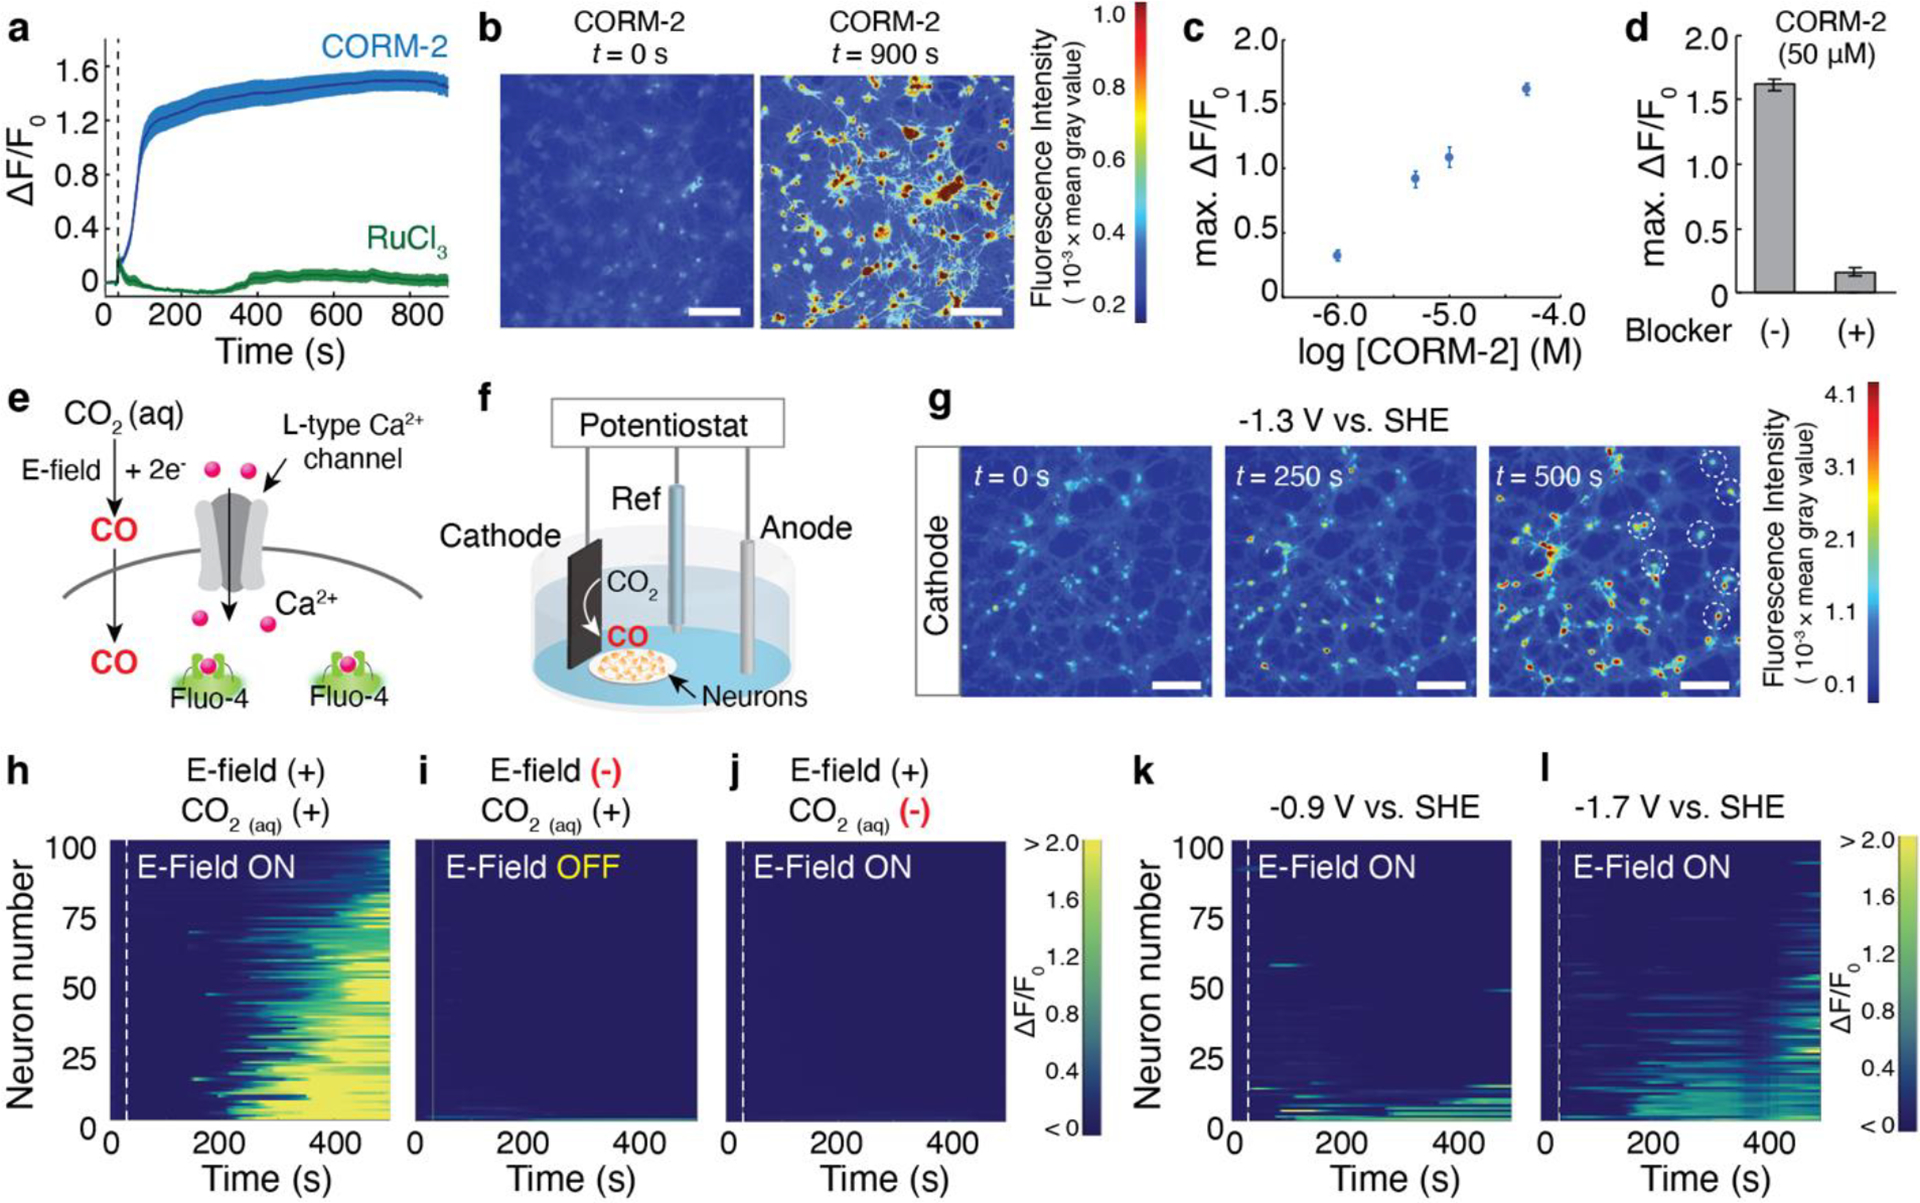
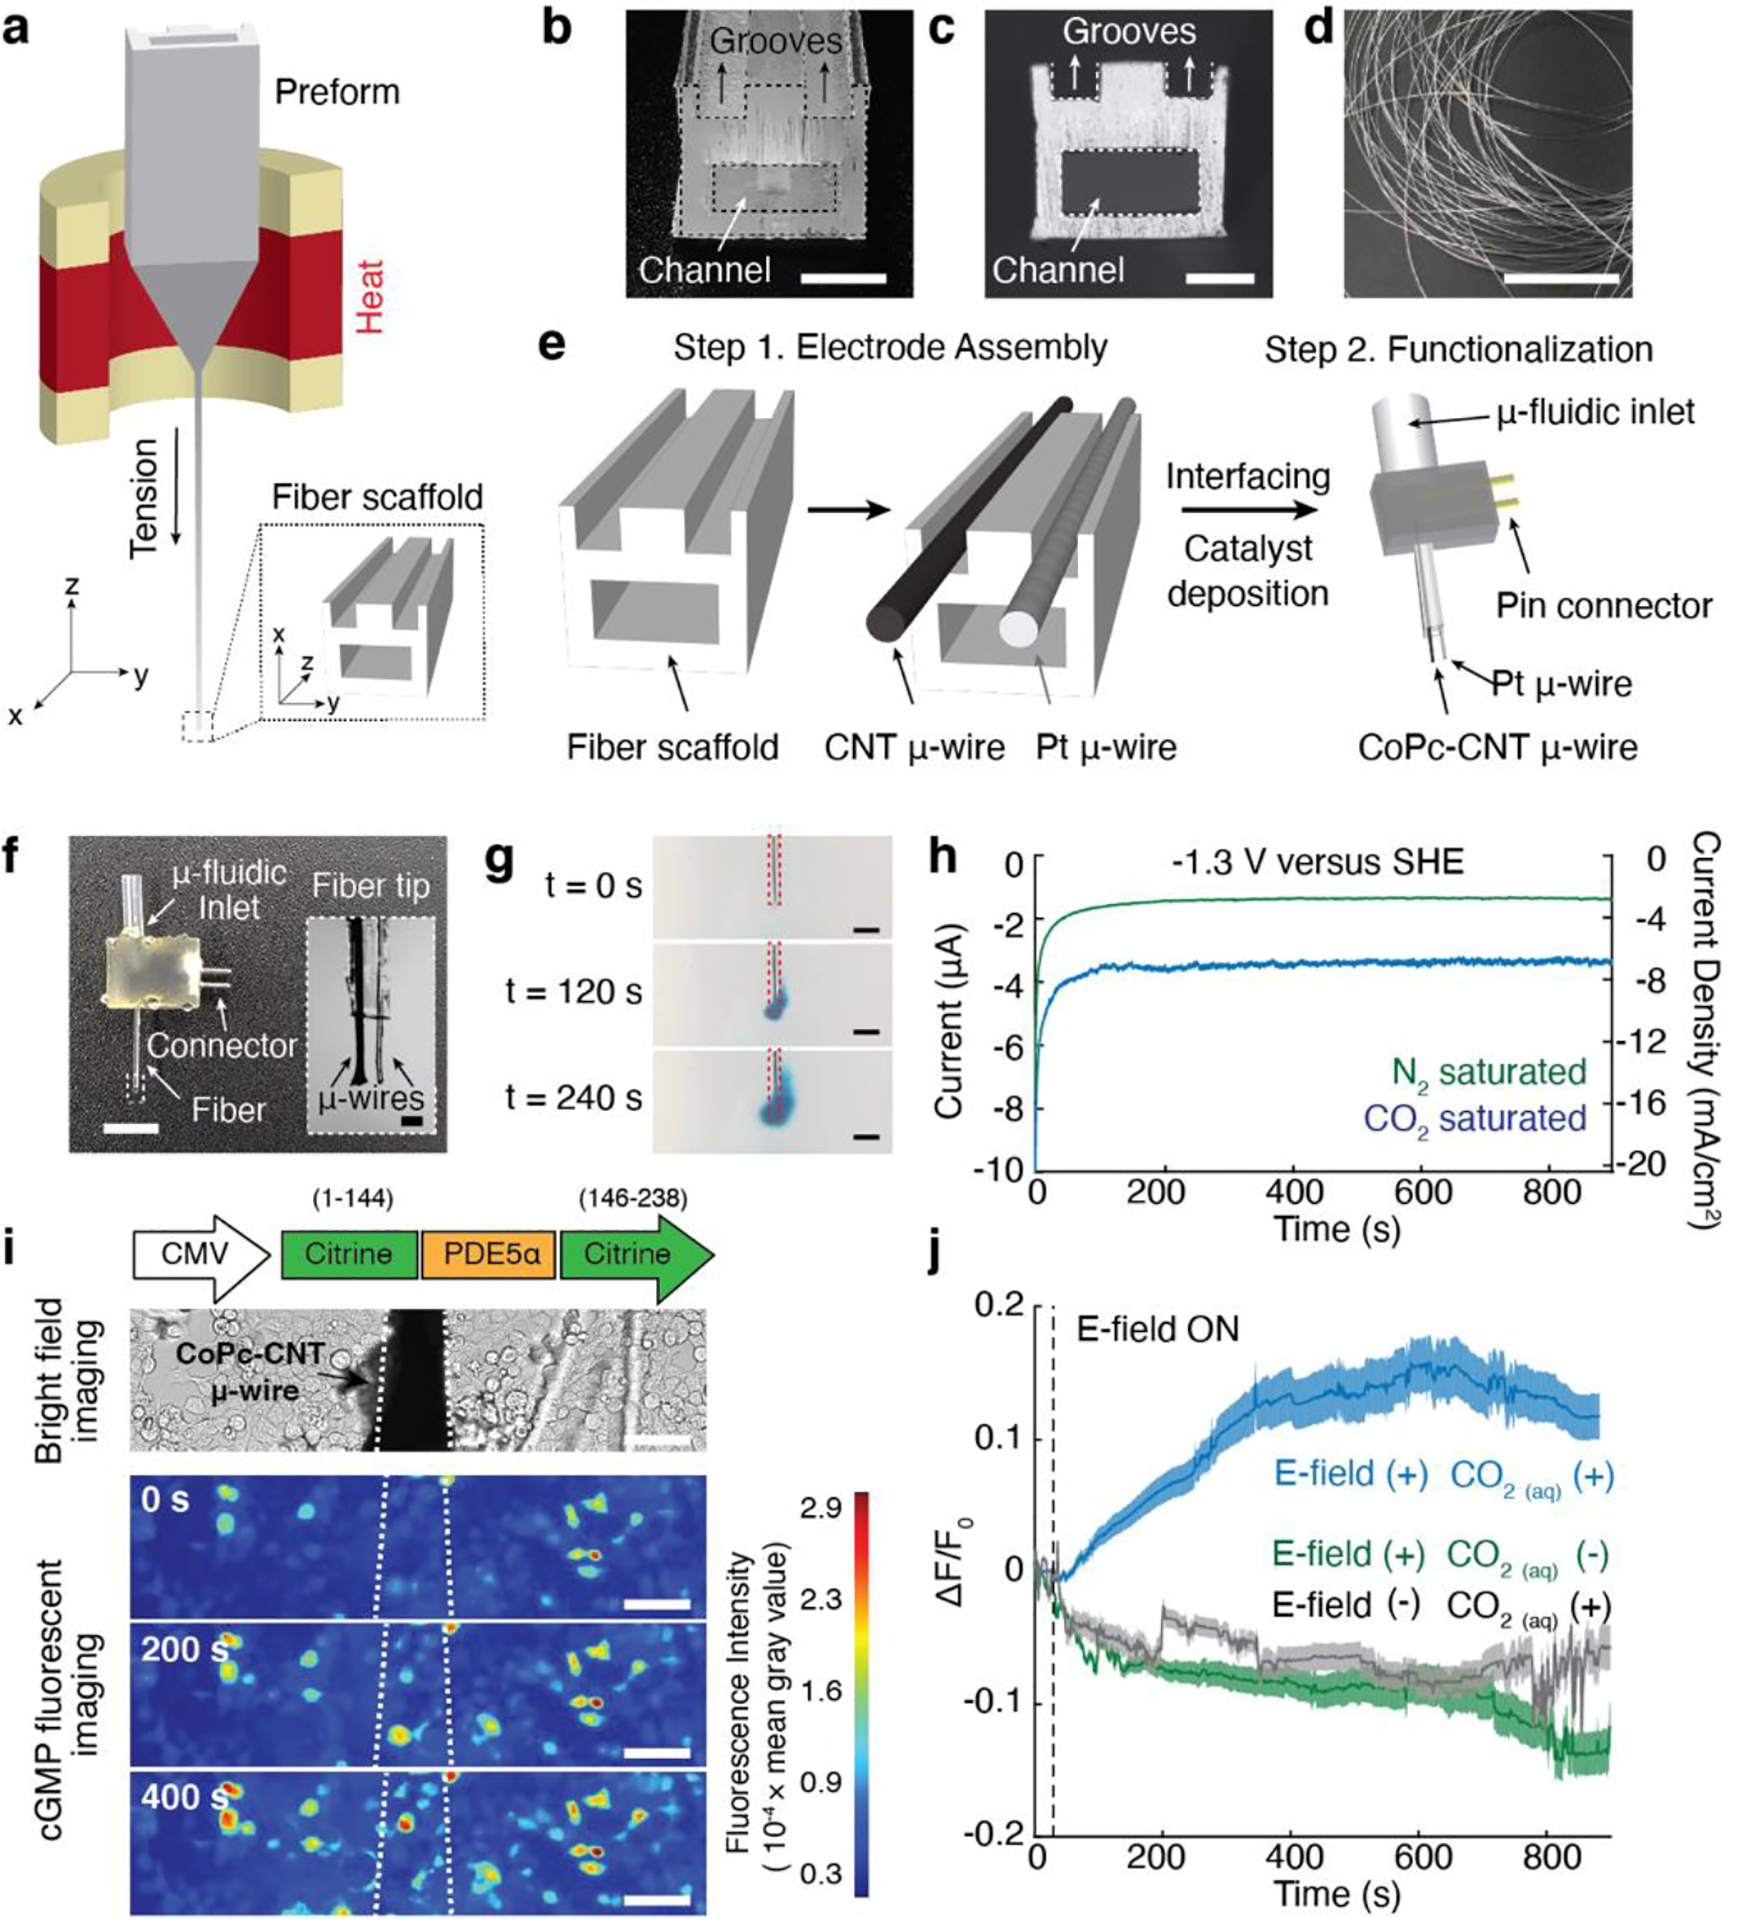
Despite the critical role played by carbon monoxide (CO) in physiological and pathological signaling events, current approaches to deliver this messenger molecule are often accompanied by off-target effects and offer limited control over release kinetics. To address these challenges, we develop an electrochemical approach that affords on-demand release of CO through reduction of carbon dioxide (CO2 ) dissolved in the extracellular space. Electrocatalytic generation of CO by cobalt phthalocyanine molecular catalysts modulates signaling pathways mediated by a CO receptor soluble guanylyl cyclase. Furthermore, by tuning the applied voltage during electrocatalysis, we explore the effect of the CO release kinetics on CO-dependent neuronal signaling. Finally, we integrate components of our electrochemical platform into microscale fibers to produce CO in a spatially-restricted manner and to activate signaling cascades in the targeted cells. By offering on-demand local synthesis of CO, our approach may facilitate the studies of physiological processes affected by this gaseous molecular messenger.

Keywords: carbon monoxide; cell signaling; electrochemistry; fiber drawing; receptors.


Figures

Figure 1.
Figure 1.
a, A schematic illustrating the electrochemical system for in situ CO delivery. b, An illustration of the electrochemical reactions at the CoPc/OxCP cathode and Pt anode. c, CV curves of CoPc/OxCP electrodes in CO2− (blue) or N2− (green) saturated Tyrode’s solution at pH 7.4 (scan rate, 100 mV/s). d, The Faradaic efficiency (FE) for CO and H2, and partial current density of CO (iCO) (mean ± standard error of the mean (s.e.m.), n = 3) at various applied voltages.
Figure 2.
Figure 2.
a, Representative confocal images of HEK cells transfected with DDK-tagged α-subunit of sGC or DDK-tagged β-subunit of sGC under the CMV promoter (scale bar, 50 μm). b, Intracellular cGMP levels (mean ± s.e.m.) in 106 HEK cells 48 h after the transfection (n = 6, one-way analysis of variance (ANOVA) and Tukey’s multiple comparison test, F3,20 = 392.2, **** p = 1.1 × 10⁻¹⁶ < 0.0001). c, A schematic illustrating activation of sGC mediated by electrochemically produced CO. GTP, guanosine 5’ triphosphate. d, Intracellular cGMP levels (mean ± s.e.m.) in 106 sGC+ cells following CO delivery driven by CoPc/OxCP cathodes at −1.3 V versus SHE for 10 min. The statistical significance of an increase in cGMP levels after electrochemical CO delivery as compared with controls was assessed by one-way ANOVA and Tukey’s multiple comparison test (n = 6, F3,20 = 7.4, ** p = 0.0016 < 0.01). e, An illustration of NO-sGC-cGMP signaling pathways modulated by CO. NORM, nitric oxide releasing molecule. f, Intracellular cGMP levels (mean ± s.e.m.) in 106 sGC+ cells following NO delivery in the presence or absence of CO (n = 5, one-way ANOVA and Tukey’s multiple comparison test, F2,12 = 10.9, ** p = 0.002 < 0.01).
Figure 3.
Figure 3.
a, Averaged fluo-4 fluorescence traces for hippocampal neurons (n = 100 neurons for each trace) following 50 μM CORM-2 (blue) or 50 μM RuCl3 (green) infusion at 30 s (dashed lines). The solid lines and shaded areas represent the mean and s.e.m., respectively. b, Time-lapse images of Ca2+ responses in response to CORM-2 infusion (scale bar, 50 μm). c, CORM-2 concentration-dependent maximum of normalized fluo-4 fluorescence change averaged across 100 neurons. d, Maximum of normalized fluo-4 fluorescence increases in 100 neurons following the infusion of 50 μM CORM-2 in the presence or absence of L-type Ca2+ channel blocker nitrendipine. e, A schematic illustrating a potential mechanism of CO-mediated Ca2+ responses in neurons through L-type Ca2+ channel. f, Experimental scheme for electrochemical CO delivery to neurons. g, Time-lapse images of Ca2+ increases in neurons triggered by CO produced from CoPc/OxCP cathodes, which were positioned at the left edge in all three images, at −1.3 V versus SHE (scale bar, 50 μm). Neurons located at greater distances from the cathode responded over time (white dotted circles). h-j, Individual fluo-4 fluorescence traces for 100 neurons at different experimental conditions. E-field (–) in (i) represents neurons immersed in CO2-saturated solution in the absence of an applied voltage. CO2(aq) (–) in (j) represents neurons immersed in Tyrode’s not saturated in CO2 in the presence of an applied voltage (j). Voltage of −1.3 V were turned on at 30 s (dashed lines) in h and j. k-l, Individual fluo-4 fluorescence traces for 100 neurons after electrochemical CO generation at −0.9 V (k) and −1.7 V versus SHE (l). Voltages were turned on at 30 s (dashed lines).
Figure 4.
Figure 4.
a, A schematic illustrating the fiber drawing procedure. b-c, Cross-sectional images of the preform (b, scale bar, 5 mm) and the fiber scaffold after the drawing process (c, scale bar, 100 μm). Two microscale grooves and one hollow microchannel are visible in c. d, A photograph of a bundle of fiber scaffolds after the drawing process (scale bar, 5 cm). e, A schematic demonstrating microelectrode assembly on the fiber scaffold, followed by fiber connectorization and functionalization of the CNT microwires with CoPc catalyst. f, A photograph of the resulting CO delivery fiber (scale bar, 5 mm) and a microscope image of the fiber tip (inset, scale bar, 100 μm). g, Delivery of CO2-saturated Tyrode’s solution with a dye (BlueJuice) into a brain phantom (0.6% agarose gel) through the microfludic channel within the fiber at an infusion rate of 100 nL/min (scale bar, 500 μm). h, Chronoamperometry measurements conducted with the electrocatalytic fiber in CO2-saturated (blue) or N2-saturated (green) Tyrode’s solution at pH 7.4. i, An optical image of a CoPc-CNT microwire of the CO-delivery fiber positioned above Green cGull-expressing cells (top). Time-lapse images of local cGMP dynamics in Green cGull-expressing cells in response to electrochemically synthesized CO from the CoPc-CNT microwire (white dotted lines) at −1.3 V versus SHE (scale bar, 50 μm) (bottom). j, Averaged Green cGull fluorescence traces of cells (n = 100 cells for each trace) at different experimental conditions. The solid lines and shaded areas indicate the mean and s.e.m., respectively. E-field (–) and CO2(aq) (–) indicate cells after delivery of CO2-saturated solution in the absence of an applied voltage and cells subjected to cathodic voltage without CO2 saturation, respectively. Voltages of −1.3 V were turned on at 30 s (dashed lines).

References

    1. Verma A, Hirsch DJ, Glatt CE, V Ronnett G, Snyder SH, Science (80-.) 1993, 259, 381–384. - PubMed
    1. Motterlini R, Otterbein LE, Nat. Rev. Drug Discov 2010, 9, 728. - PubMed
    1. Ingi T, Cheng J, V Ronnett G, Neuron 1996, 16, 835–842. - PubMed
    1. Romão CC, Blättler WA, Seixas JD, Bernardes GJL, Chem. Soc. Rev 2012, 41, 3571–3583. - PubMed
    1. Otterbein LE, Bach FH, Alam J, Soares M, Tao Lu H, Wysk M, Davis RJ, Flavell RA, Choi AMK, Nat. Med 2000, 6, 422–428. - PubMed

Publication types

Substances

LinkOut - more resources