. 2021 Sep 1;109(17):2781-2796.e10.
doi: 10.1016/j.neuron.2021.06.019. Epub 2021 Jul 14.

A neural code for egocentric spatial maps in the human medial temporal lobe

Affiliations

A neural code for egocentric spatial maps in the human medial temporal lobe

Lukas Kunz et al. Neuron. .

Abstract

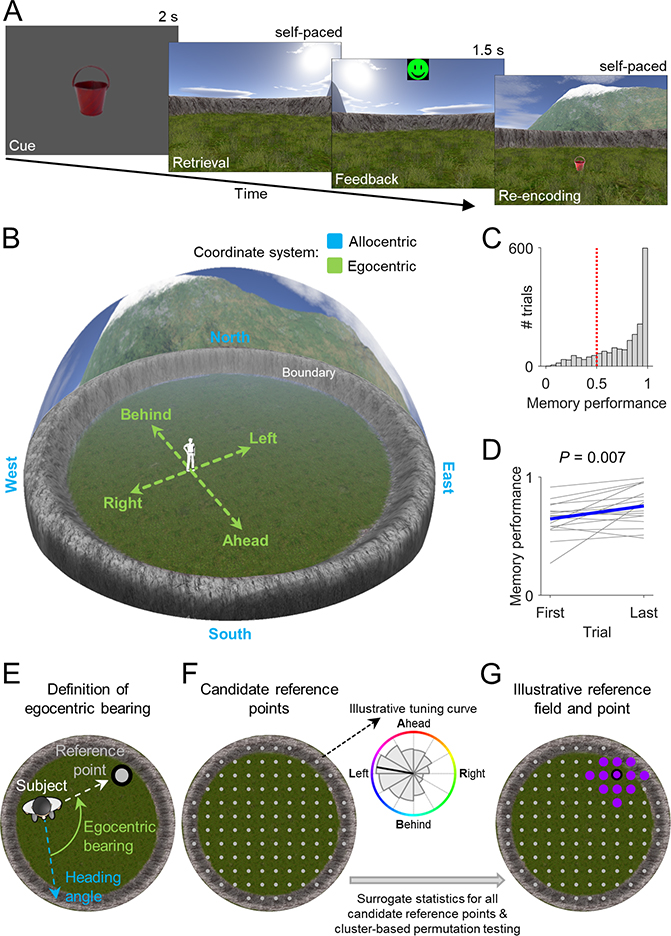
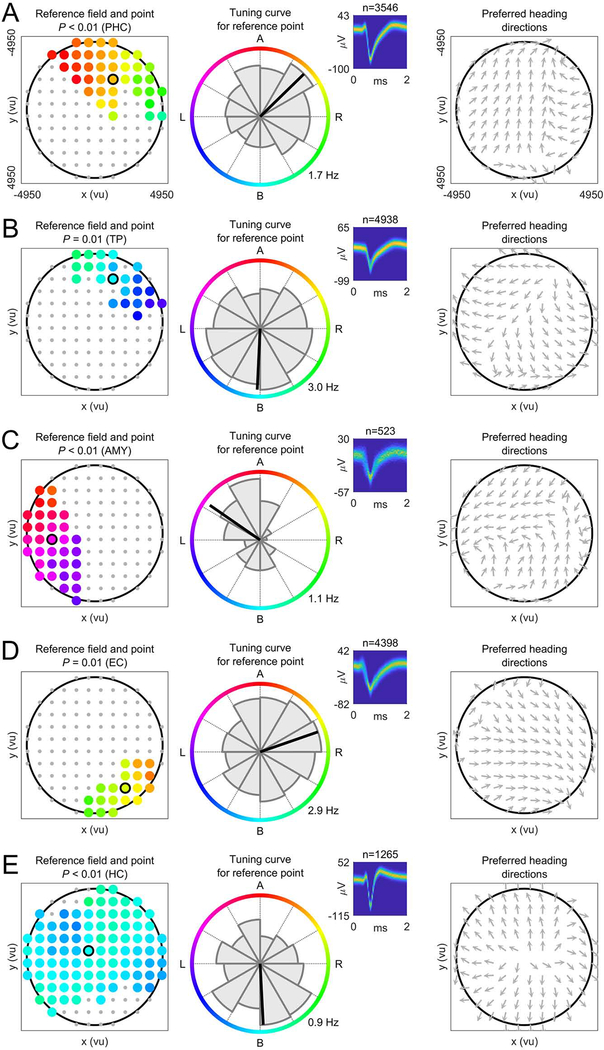
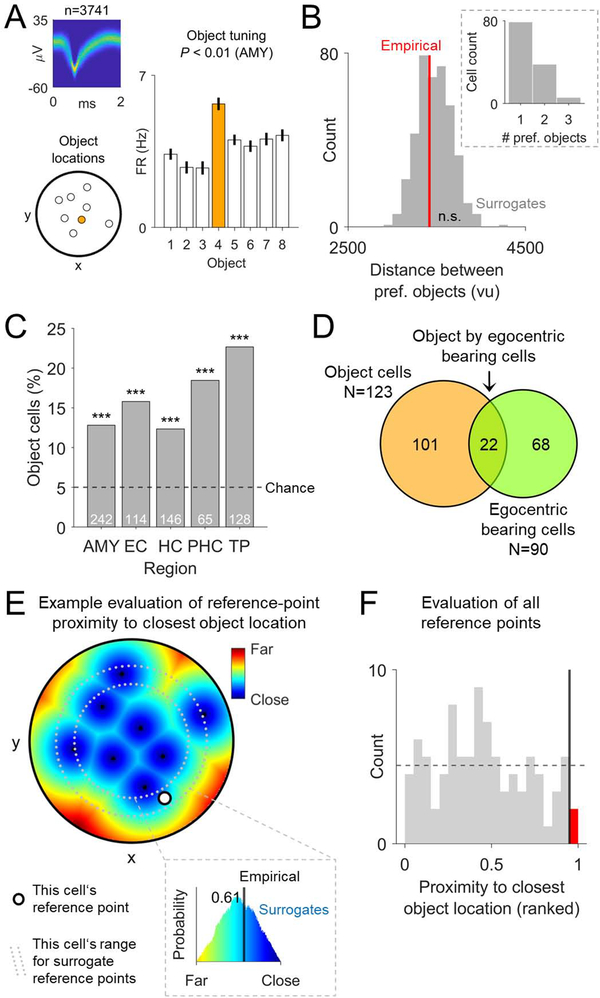
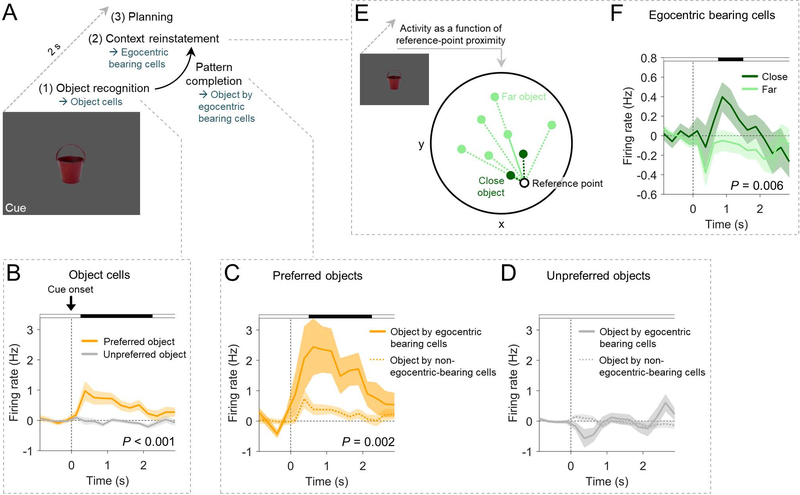
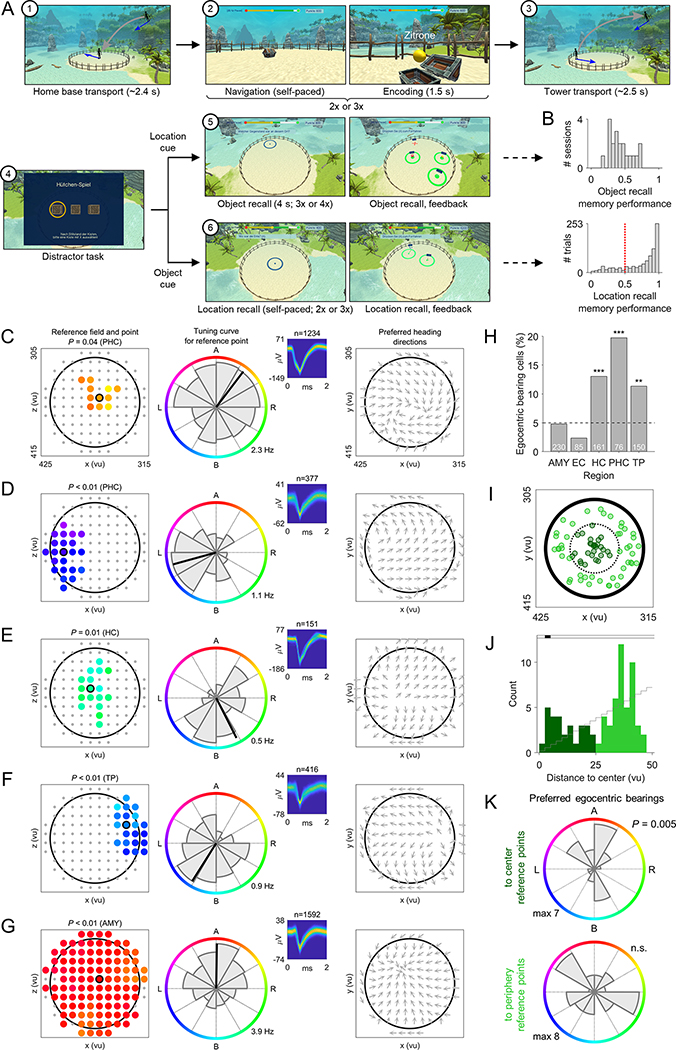
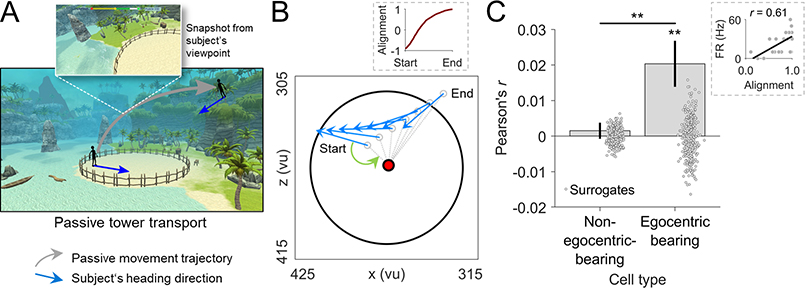
Spatial navigation and memory rely on neural systems that encode places, distances, and directions in relation to the external world or relative to the navigating organism. Place, grid, and head-direction cells form key units of world-referenced, allocentric cognitive maps, but the neural basis of self-centered, egocentric representations remains poorly understood. Here, we used human single-neuron recordings during virtual spatial navigation tasks to identify neurons providing a neural code for egocentric spatial maps in the human brain. Consistent with previous observations in rodents, these neurons represented egocentric bearings toward reference points positioned throughout the environment. Egocentric bearing cells were abundant in the parahippocampal cortex and supported vectorial representations of egocentric space by also encoding distances toward reference points. Beyond navigation, the observed neurons showed activity increases during spatial and episodic memory recall, suggesting that egocentric bearing cells are not only relevant for navigation but also play a role in human memory.

Keywords: allocentric; egocentric; electrophysiology; hippocampus; human single-neuron recording; memory; navigation; parahippocampal cortex; sense of direction.


Conflict of interest statement

Declaration of interests The authors declare no competing interests.

Figures

Figure 1.
Figure 1.. Spatial reference memory task and analysis procedure for identifying egocentric bearing cells.
(A) In each trial, a given object (“cue”) had to be placed at its location (“retrieval”). Patients received feedback depending on response accuracy (“feedback”) and re-encoded the correct object location afterwards (“re-encoding”). (B) Virtual environment. Allocentric and egocentric reference frames are illustrated. (C) Spatial memory performance values across all trials from all patients. Red line, chance level. (D) Change in spatial memory performance between first and last trial. Blue line, mean across subjects. (E) Definition of egocentric bearing. (F) Left, candidate reference points. Right, illustrative tuning curve for one candidate point depicting firing rate as a function of egocentric bearing (coloring) towards this point. Significance of each candidate reference point is tested via surrogate statistics. (G) Cluster-based permutation testing identifies the largest cluster of significant candidate reference points (“reference field”). The “reference point” is the center of mass of the reference field. Coloring, preferred egocentric bearings according to the inset in F.
Figure 2.
Figure 2.. Egocentric bearing cells encode egocentric directions towards local reference points.
(A to E) Example EBCs. Left column, EBC plot showing the reference field (colored dots) and the reference point (colored dot with black circle). Coloring, preferred egocentric bearing towards each location of the reference field (see colored circle in the middle column). Gray dots, candidate reference points without significant tuning. P-value, significance from cluster-based permutation test. Middle column, tuning curve showing how the cell’s firing rate varies as a function of egocentric bearing towards the reference point (maximum firing rate at bottom right). Colored circle indicates egocentric bearing. Inset, spike shapes as density plot (number above inset indicates spike count); yellow, maximum; blue, 0. Right column, vector-field map showing the cell’s preferred allocentric heading direction across the environment (gray arrows). Large black circles, environmental boundary. A (B; L; R), reference point ahead (behind; to the left; to the right) of the subject. ms, milliseconds; μV, microvolt. AMY, amygdala; EC, entorhinal cortex; HC, hippocampus; PHC, parahippocampal cortex; TP, temporal pole.
Figure 3.
Figure 3.. Egocentric bearing cells have reference points positioned throughout the environment, show a range of egocentric bearings, exhibit distance tuning, and their firing rates covary with spatial memory performance.
(A) Overlap between EBCs, direction cells, and place-like cells. (B) Percentage of EBCs across brain regions. Asterisks, significance from binomial tests vs. 5% chance (dashed line). White numbers, total number of cells per region. (C) Spatial distribution of reference points. Dotted line separates center reference points (dark green) from periphery reference points (lime green). (D) Distribution of reference-point distances to the environment center. Black shading, significance at Pcorr. < 0.05 vs. chance (gray stairs). (E) Distribution of preferred egocentric bearings towards reference points in the environment center (left) and towards periphery reference points (right). P-value from Rayleigh test for 2-fold symmetry. (F) Example EBC showing activity linearly correlated with reference-point distance. Gray bars, firing rates; red lines, linear fit. P-values result from the comparison against surrogate statistics. (G) Distance-tuning curves for all EBCs, sorted by peak-firing distance to the reference point. Translucent coloring, absence of significant linear distance tuning. (H) Example EBC with a bearing-distance field, which also exhibited linear distance tuning. Firing-rate map shows firing rate as a function of egocentric bearing and egocentric distance to the reference point. Black line delineates the bearing-distance field. P-value results from the comparison against surrogate statistics. (I) Example EBC with a bearing-distance field, but without linear distance tuning. (J) Additional example EBCs with bearing-distance fields. (K) Relative bearing- and distance-extent of all bearing-distance fields. Inset shows relative 2D extent of all bearing-distance fields. Green, significant bearing-distance fields; gray, unsignificant fields. (L) Summary distribution of all bearing-distance fields. (M) Distribution of memory cells across brain regions. (N) Examples of EBCs that also behaved as memory cells by increasing (left) or decreasing (right) their firing rates in relation to better memory performance. P-values result from the comparison against surrogate statistics. Red lines, linear fit. Firing-rate residuals are displayed since the effect of time/experience was regressed out beforehand. (O) Prevalence of memory cells among egocentric bearing, direction, and place-like cells vs. non-spatial cells. Asterisks, significance from χ2 tests. FG, fusiform gyrus; FR, firing rate; max, maximum; min, minimum. n.s., not significant; *P < 0.05; **P < 0.01; ***P < 0.001.
Figure 4.
Figure 4.. Relevance of objects for the activity of egocentric bearing cells.
(A) Example object cell with firing rates that vary as a function of the objects whose locations have to be learned and retrieved throughout the task. Each bar shows the firing rate during trials with a given object. Orange bar depicts the cell’s preferred object. P-value results from the comparison against surrogate statistics. (B) Mean distance between preferred objects of object cells with at least 2 preferred objects. Red line, empirical mean distance between preferred objects; gray bars, histogram of surrogate distances. Inset, number of preferred objects per object cell. (C) Distribution of object cells across brain regions. (D) Overlap between object cells and EBCs. (E) Illustration of the proximity (inverse of the distance) of all arena locations to their closest object location in one example cell. Black dots, object locations; white dot, reference point; gray dotted lines, margin for cell-specific surrogate reference points. Inset shows the rank (here, 0.61) of the empirical proximity between the reference point and its closest object location (black line) relative to the surrogate proximities between surrogate reference points and their closest object locations (colored histogram). (F) Histogram of the proximity of reference points to their closest object location, ranked with respect to the proximity of surrogate reference points to their closest object location, for all EBCs. Vertical black line, 5% alpha level; red bar, number of reference points that are significantly close to their nearest object location. The expected null distribution of the ranked empirical values is a flat histogram (dotted horizontal line). ***P < 0.001.
Figure 5.
Figure 5.. Egocentric bearing cells participate in context reinstatement during spatial memory recall.
(A) Hypothesis on the cognitive processes during memory cues: object recognition (supported by object cells) may trigger pattern completion (involving the activity of conjunctive object by egocentric bearing cells) and context reinstatement (associated with EBC activity). Planning of navigation routes may follow. (B) Firing rates of object cells during cue presentation of trials with the preferred object(s) vs. trials with unpreferred object(s). (C) Firing rates of conjunctive object by egocentric bearing cells during cue presentation of trials with their preferred object(s) as compared to object cells that are not EBCs. (D) Firing rates of conjunctive object by egocentric bearing cells during cue presentation of trials with the unpreferred object(s) as compared to object cells that are not EBCs. (E) Illustration of the separation of cue periods into “close” and “far” depending on whether the location of the cueing object is close to or farther away from the reference point, respectively. (F) Firing rates of EBCs during cue presentation of trials in which the object location is close to the reference point vs. trials in which the object location is farther away from the reference point. Shaded areas, SEM across cells. P-values result from cluster-based permutation tests, which control for multiple comparisons across the entire time windows; black shading at top, time points from the significant cluster. Firing rates in B, C, D, and F are baseline-corrected with respect to a one-second baseline interval before the onset of the cue period.
Figure 6.
Figure 6.. Replication of egocentric bearing cell activity in the hybrid spatial navigation–episodic memory task.
(A) At the beginning of each trial ①, the subject was passively transported to a location on the beach. Figure shows the subject’s movement schematically from the side (gray arrow). Blue arrows, subject’s heading directions. During the navigation–encoding period of each trial ②, the subject navigated towards 2 or 3 treasure chests. Upon arrival, the chest opened and the subject encoded both the object within and the location of the chest. Next, the subject was passively transported ③ to an elevated recall position. During the subsequent distractor task ④ the subject was asked to follow a coin hidden underneath one of 3 moving boxes. Then, during location-cued object recall ⑤, a location on the beach was shown and the subject was asked to recall the associated object. Conversely, during object-cued location recall ⑥, the name of an object was shown, and the subject was asked to recall the associated location. (B) Memory performance for object and location recall. Red dotted line, chance level. (C to G) Example EBCs in the hybrid spatial navigation–episodic memory task. Same depiction as in Figure 2. (H) Distribution of EBCs across brain regions. (I) Spatial distribution of reference points. (J) Distribution of reference-point distances to the environment center. Black shading, statistical significance at Pcorr. < 0.05 vs. chance (gray stairs). (K) Distribution of preferred bearings towards reference points in the environment center and towards periphery reference points. P-value from Rayleigh test for 2-fold symmetry. **P < 0.01; ***P < 0.001.
Figure 7.
Figure 7.. The tuning of egocentric bearing cells persists during passive transport.
(A) Schematic of the tower-transport period. Gray arrow, subject’s movement; blue arrows, subject’s heading directions. (B) Behavioral data from an example tower transport, in which the subject is transported from its location on the beach (Start) to the elevated position (End). Blue arrows, subject’s heading direction at select time points. Red dot, this cell’s reference point. Gray dashed lines, vectors from the subject’s location (unfilled gray dots) to the reference point. Green arrow, egocentric bearing at Start. Height values of the subject’s position are omitted for clarity. Inset, alignment of the current egocentric bearing with the preferred egocentric bearing across the entire transport period (“1” indicates perfect alignment). (C) Mean correlation between firing rates and the alignment of the subject’s current egocentric bearing with the preferred egocentric bearing during passive transport. Point clouds, surrogate means based on shuffled data. Inset, example correlation across time bins from one transport period. *P < 0.05; **P < 0.01.
Figure 8.
Figure 8.. Egocentric bearing cells activate during successful episodic memory recall.
(A) Schematic for location-cued object recall. (B and C) Firing rates of EBCs (B) and non-spatial cells (C) during successful vs. unsuccessful object recall. (D) Interaction effect showing a significant difference between the activity of EBCs and non-spatial cells during successful vs. unsuccessful recall periods. (E) Schematic for object-cued location recall. (F and G) Response-locked firing rates of EBCs (F) and non-spatial cells (G) during successful vs. unsuccessful location recall. (H) Interaction effect showing a significant difference between the activity of EBCs and non-spatial cells during successful vs. unsuccessful recall periods. Firing rates in B, C, D, F, G, and H are baseline-corrected with respect to a one-second baseline interval before the onset of the recall period. In B, C, F, and G: black shadings at top, significant clusters of firing-rate differences between successful and unsuccessful recall periods (cluster-based permutation tests, P < 0.05); gray shadings, significant deviations of firing rates from 0 during successful recall periods (cluster-based permutation tests, P < 0.05). In D and H, black shadings indicate significant interaction effects (cluster-based permutation tests, P < 0.05). All cluster-based permutation tests control for multiple comparisons across the entire time window.

References

    1. Aguirre GK, Detre JA, Alsop DC, and D’Esposito M (1996). The Parahippocampus Subserves Topographical Learning in Man. Cereb. Cortex 6, 823–829. - PubMed
    1. Alexander AS, Carstensen LC, Hinman JR, Raudies F, William Chapman G, and Hasselmo ME (2020). Egocentric boundary vector tuning of the retrosplenial cortex. Sci. Adv. 6, eaaz2322. - PMC - PubMed
    1. Berens P (2009). CircStat: A MATLAB Toolbox for Circular Statistics. J. Stat. Softw. 31, 1–21.
    1. Bicanski A, and Burgess N (2018). A neural-level model of spatial memory and imagery. ELife 7, e33752. - PMC - PubMed
    1. Boccara CN, Nardin M, Stella F, O’Neill J, and Csicsvari J (2019). The entorhinal cognitive map is attracted to goals. Science 363, 1443–1447. - PubMed

Publication types

LinkOut - more resources