. 2021 Jul 15;16(1):47.
doi: 10.1186/s13024-021-00457-0.

Knock-in models related to Alzheimer's disease: synaptic transmission, plaques and the role of microglia

Affiliations

Knock-in models related to Alzheimer's disease: synaptic transmission, plaques and the role of microglia

Diana P Benitez et al. Mol Neurodegener. .

Abstract

Background: Microglia are active modulators of Alzheimer's disease but their role in relation to amyloid plaques and synaptic changes due to rising amyloid beta is unclear. We add novel findings concerning these relationships and investigate which of our previously reported results from transgenic mice can be validated in knock-in mice, in which overexpression and other artefacts of transgenic technology are avoided.

Methods: AppNL-F and AppNL-G-F knock-in mice expressing humanised amyloid beta with mutations in App that cause familial Alzheimer's disease were compared to wild type mice throughout life. In vitro approaches were used to understand microglial alterations at the genetic and protein levels and synaptic function and plasticity in CA1 hippocampal neurones, each in relationship to both age and stage of amyloid beta pathology. The contribution of microglia to neuronal function was further investigated by ablating microglia with CSF1R inhibitor PLX5622.

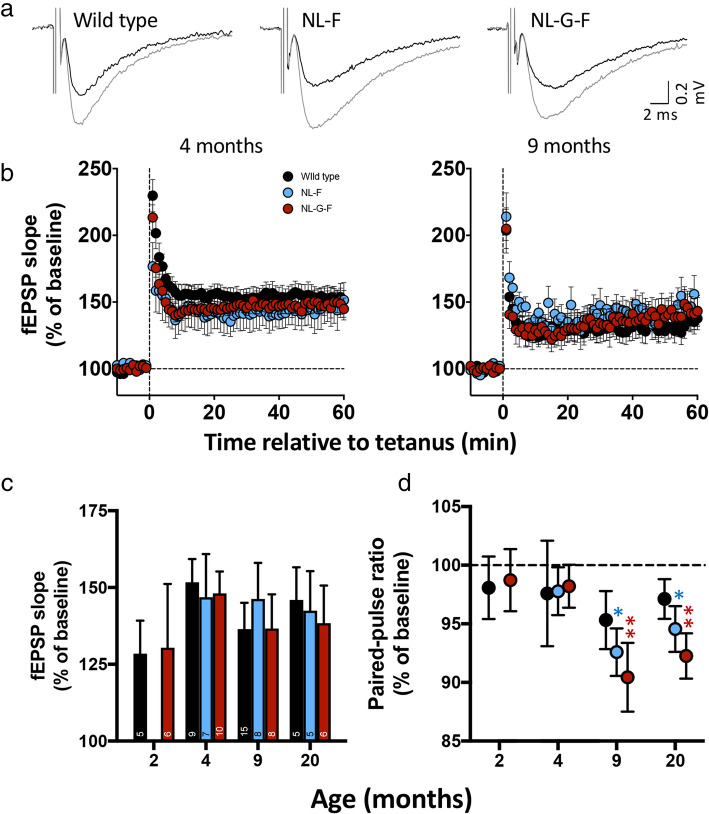
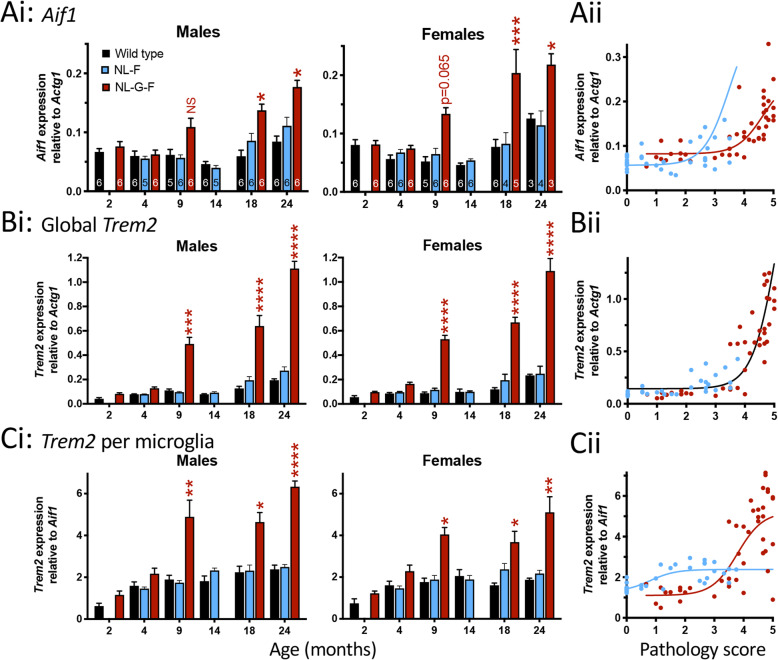
Results: Both App knock-in lines showed increased glutamate release probability prior to detection of plaques. Consistent with results in transgenic mice, this persisted throughout life in AppNL-F mice but was not evident in AppNL-G-F with sparse plaques. Unlike transgenic mice, loss of spontaneous excitatory activity only occurred at the latest stages, while no change could be detected in spontaneous inhibitory synaptic transmission or magnitude of long-term potentiation. Also, in contrast to transgenic mice, the microglial response in both App knock-in lines was delayed until a moderate plaque load developed. Surviving PLX5266-depleted microglia tended to be CD68-positive. Partial microglial ablation led to aged but not young wild type animals mimicking the increased glutamate release probability in App knock-ins and exacerbated the App knock-in phenotype. Complete ablation was less effective in altering synaptic function, while neither treatment altered plaque load.

Conclusions: Increased glutamate release probability is similar across knock-in and transgenic mouse models of Alzheimer's disease, likely reflecting acute physiological effects of soluble amyloid beta. Microglia respond later to increased amyloid beta levels by proliferating and upregulating Cd68 and Trem2. Partial depletion of microglia suggests that, in wild type mice, alteration of surviving phagocytic microglia, rather than microglial loss, drives age-dependent effects on glutamate release that become exacerbated in Alzheimer's disease.

Keywords: Ageing; Alzheimer’s disease; Amyloid beta; Gene expression; Microglia; Neurodegeneration; Plaques; Synaptic plasticity; Synaptic transmission; TREM2.


Conflict of interest statement

The authors declare that they have no competing interests.

Figures

Fig. 1
Fig. 1
Plaques develop with age in AppNL-F and AppNL-G-F mice. a and b) Examples of plaques detected using LCOs (green) in AppNL-F (a) and AppNL-G-F (b) hippocampus at the ages indicated. DAPI nuclear counterstain (blue). c) Median and upper quartile range for Aβ pathology scores (0–5; Supplementary Fig.1). Sample sizes (animals) are indicated within the bars. Sections (30 μm thick) were labelled with LCOs and scored blind to experimental group. While there was a significant effect of age (p < 0·0001) and there were no significant differences between the sexes at any given age. (Genotype effects were not assessed by age, as the progression of plaques is known to be slower in AppNL-F than AppNL-G-F.) Note that, for each animal, the score is the average of three sections, giving one value per animal which may not be an integer
Fig. 2
Fig. 2
Frequency of spontaneous excitatory synaptic transmission is reduced in an age-dependent manner in AppNL-F and AppNL-G-F mice. A) Examples of continuous voltage-clamp recordings from CA1 pyramidal neurones in slices from 9- and 20-month-old wild type, AppNL-F and AppNL-G-F animals illustrating the reduction in frequency of spontaneous EPSCs observed at these ages. Confirmed EPSCs are indicated by the asterisks. B) Frequencies (i) and median amplitudes (ii) of spontaneous EPSCs in wild type and knock-in mice. C) Frequencies (i), median amplitudes (ii) and decay time constants (iii) of miniature EPSCs in wild type and App knock-in mice. Data in panels B and C plotted as mean ± SEM. Sample sizes (animals) are indicated by the numbers inside bars in subpanels i. Sequential Sidak corrected post-hoc comparisons to wild type are indicated by * p < 0·05; *** p < 0·001 (9-months-old: AppNL-G-F p = 0·025; 20-months-old: AppNL-F p = 0·018, AppNL-G-F p = 0·00028)
Fig. 3
Fig. 3
Paired-pulse ratios of evoked excitatory postsynaptic currents are altered in an age-dependent manner in AppNL-F and AppNL-G-F mice. a) Examples of evoked CA3-CA1 EPSCs in response to paired stimuli applied to Schaffer collaterals in slices from 20-month-old animals. b) Paired-pulse ratios of CA3-CA1 EPSCs at ages indicated. Sample sizes (animals) are indicated by the numbers to the right of the 50 ms data points. Holm-Sidak post hoc tests compared to wild type are indicated by * p < 0·05; ** p < 0·01; **** p < 0·0001 (2-month-old: p = 0·0174; 7-month-old: p = 0·019; 9-months-old AppNL-F 25 ms p = 3·4 × 10−8, AppNL-G-F 25 ms p = 1·1 × 10−7, AppNL-F 50 ms p = 0·0086, AppNL-G-F 50 ms p = 0·021; 20-month-old AppNL-F 25 ms p = 7.5 × 10−5, AppNL-G-F 25 ms p = 6·0 × 10−9, AppNL-G-F 50 ms p = 0·0034). c) Failure rates of unitary evoked EPSCs in 20-month-old wild type and App knock-in animals. Holm-Sidak post hoc tests compared to wild type are indicated by * p < 0·05; ** p < 0·01 (NL-F p = 0·013, NL-G-F p = 0·0069). Data in panels B and C plotted as mean ± SEM. Sample sizes (animals) are indicated by the numbers within bars
Fig. 4
Fig. 4
Altered locus of expression of long-term potentiation in AppNL-F and AppNL-G-F mice. a) Example CA3-CA1 fEPSPs recorded in stratum radiatum of slices from 9-month-old animals. b) Example time courses of field EPSP slope, expressed as percent of mean baseline and relative to induction tetanus. c) Summary of LTP magnitude across ages calculated as the mean of 51–60 min after conditioning. d) Paired-pulse ratio mean of 51–60 min after conditioning as a percentage of baseline. Data in panels C and D plotted as mean ± SEM. Sample sizes (animals) are indicated in the bars within panel C. NB, at 9 and 20 months, while the paired-pulse ratio was significantly different from baseline for both App knock-in lines and not for wild type, there was no significant difference between the groups (One sample t-tests versus 100%: * p < 0·05; ** p ≤ 0·01; 9-months-old AppNL-F p = 0·0080, AppNL-G-F p = 0·014; 20-months-old AppNL-F p = 0·049, AppNL-G-F p = 0·010)
Fig. 5
Fig. 5
Microgliosis occurs at an earlier plaque pathology stage in AppNL-F than AppNL-G-F mice. A) Example of a ramified (left) and amoeboid (right) microglial cell in CA1 of 9-month-old AppNL-G-F mice. Scale bar for both images shown on right image. B) Densities of IBA1+ microglia in male (panel i) and female (panel ii). A generalised linear mixed model, with comparisons of Age × Genotype within Sex was followed by a sequential Sidak post hoc analysis. ** p < 0.01; *** p < 0.001; **** p < 0.0001 with respect to age- and sex-matched wild type (Males: 9-month-old p = 0·00048; 18-month-old p = 2·2 × 10−6; 24-month-old AppNL-F p = 0·016, AppNL-G-F F p = 1·4 × 10−5; Females; 9-month-old p = 0·00031; 24-month-old p = 0·0086). Data plotted as mean ± SEM. Sample sizes (animals) are indicated within the bars. C) Sigmoidal fit to microglial density plotted against corresponding pathology score for an individual animal. Genotype is indicated by colour (red: AppNL-G-F; blue: AppNL-F); both male and female data are included
Fig. 6
Fig. 6
Microglial gene expression is upregulated at an earlier plaque pathology stage in AppNL-F than AppNL-G-F mice. Ai) Aif1 (the gene encoding IBA1) gene expression determined by RT-qPCR expressed relative to the housekeeping gene Actg1 for males (left) and females (right). Sequential Sidak post hoc analyses following GLMM are indicated by * p < 0·05; ** p < 0·01; *** p < 0·001; **** p < 0·0001; NS not significant (Males: 9-month-old p = 0·36, 24-month-old p = 0·026; Females: 18-months-old p = 0·0013, 24-month-old p = 0·033). Aii) Sigmoidal fit to Aif1 expression plotted against corresponding pathology score for an individual animal. Bi) Trem2 gene expression relative to the housekeeping gene Actg1, representing a global Trem2 expression in the hippocampus for males (left) and females (right). Sequential Sidak post hoc analyses following GLMM are indicated by *** p < 0·001; **** p < 0·0001 (Males: 9-months-old p = 0·00015, 18-months-old p = 4·0 × 10−7, 24-month-old p < 1 × 10−20; Females: 9-months-old p = 1·5 × 10−5, 18-months-old p = 8·2 × 10−8, 24-months-old p = 6·7 × 10−14). Bii) Sigmoidal fit to Trem2 expression relative to Actg1 plotted against corresponding pathology score for an individual animal. Ci) Trem2 gene expression relative to Aif1 gene expression, representing a per-microglia Trem2 expression for males (left) and females (right). Sequential Sidak post hoc analyses following GLMM are indicated by *p < 0.05; ** p < 0·01; **** p < 0·0001 (Males: 9-months-old p = 0·0020, 18-months-old p = 0·019, 24-months-old p = 1·1 × 10−5; Females: 9-months-old p = 0·026, 18-months-old p = 0·042, 24-months-old p = 0·0025). Cii) Sigmoidal fit to Trem2 expression relative to Aif1 plotted against corresponding pathology score for an individual animal. Sequential Sidak post hoc analyses following GLMM are indicated by * p < 0·05; ** p < 0·01; *** p < 0·001; **** p < 0·0001; NS not significant (p = 0·36). Data in subpanels i within A-C plotted as mean ± SEM. Sample sizes (animals) are indicated within the bars in panel A
Fig. 7
Fig. 7
Depletion of microglia using PLX5622 reduces the presence of small plaques but exacerbates the paired-pulse ratio effects of App knock-in mice. Red and blue timelines indicate the PLX5622 feeding regimen for App knock-in mice and age-matched wild types. The first age indicates the start of treatment, the second the age animals were killed for experimentation. A&F) Fluorescent micrographs of AppNL-G-F (A) and AppNL-F (F) CA1 region of the hippocampus following labelling of Aβ with LCOs and fluorescent immunohistological staining for IBA1 and CD68. Stratum oriens (SO), stratum pyramidale (SP), stratum radiatum (SR) and stratum lacunosum moleculare (SLM) are indicated in the no-drug AppNL-G-F condition (for further orientation, the stratum moleculare (SM), stratum granulosum (SG) and hilus (H) within the dentate gyrus are also shown). Scale bar in NL-G-F 1200 mg/kg PLX image is 200 μm. B&G) Densities determined as cells that were IBA1+ microglia. Two-way ANOVA revealed significant main effects of drug (AppNL-G-F p < 0·0001; AppNL-F p < 0·0001). C&H) Densities of IBA1+ microglia that were also CD68+ in the CA1 region of AppNL-G-F (C) or AppNL-F mice. Data are presented as total density (i) and proportion of IBA1+ microglia (ii). Sample sizes (animals) for panels B and C are indicated within the bars of panel B; and for panels G and H are indicated in panel G. In panels B,C,G&H, Sidak corrected simple comparisons within drug are indicated by * versus control (0 mg PLX5622/kg food) and † versus 300 mg/kg; † p < 0·05; ** p < 0·01; *** p < 0·001; ****/†††† p < 0·0001. D&I) Plaque size histograms. Dunnett’s post hoc test for within plaque size bin comparisons to 0 mg/kg PLX5622 are indicated by *** p < 0·001 and **** p < 0·0001. Sample sizes (animals) are indicated within the parentheses in the legends. E&J) Paired-pulse ratios from PLX5622-treated. In wild type (Ei and Ji) and AppNL-G-F (Eii) or AppNL-F (Jii) mice. Sample sizes are indicated in the legend. For simplicity in panels E&J, only Sequential Sidak comparisons within drug dose versus control at the 25 ms inter-stimulus interval are indicated * p < 0·05; **** p < 0·0001; see main text for further details. Data in panels B-E and G-J plotted as mean ± SEM
Fig. 8
Fig. 8
Summary timelines of phenotypes in APP knock-in and transgenic mice. Timelines for indicated phenotypes in AppNL-F (left), AppNL-G-F (centre) and TASTPM transgenic mice (right). AppNL-F and AppNL-G-F data are all included in the current publication. TASTPM data were published in Matarin et al., 2014; Cummings et al., 2015; and Medawar et al., 2019 (a preliminary comparison was presented in Joel et al., 2018). Note the phenotypic development in relation to plaque deposition within each mouse model and across the three models. Magnitudes of change across different phenotypes are not necessarily proportional; however, within any given phenotype, magnitudes of change across genotypes are proportional. Microgliosis refers to densities of IBA1+ microglia. Probability of glutamate release is based on paired-pulse ratio data. Spontaneous and miniature EPSCs reflect changes in frequency

References

    1. Gotz J, Bodea LG, Goedert M. Rodent models for Alzheimer disease. Nat Rev Neurosci. 2018;19(10):583–598. doi: 10.1038/s41583-018-0054-8. - DOI - PubMed
    1. Sasaguri H, Nilsson P, Hashimoto S, Nagata K, Saito T, De Strooper B, Hardy J, Vassar R, Winblad B, Saido TC. APP mouse models for Alzheimer's disease preclinical studies. EMBO J. 2017;36(17):2473–2487. doi: 10.15252/embj.201797397. - DOI - PMC - PubMed
    1. Andrew RJ, Kellett KA, Thinakaran G, Hooper NM. A Greek tragedy: the growing complexity of Alzheimer amyloid precursor protein proteolysis. J Biol Chem. 2016;291(37):19235–19244. doi: 10.1074/jbc.R116.746032. - DOI - PMC - PubMed
    1. Rice HC, de Malmazet D, Schreurs A, Frere S, Van Molle I, Volkov AN, et al. Secreted amyloid-beta precursor protein functions as a GABABR1a ligand to modulate synaptic transmission. Science. 2019;363:eaao4827. 10.1126/science.aao4827. - PMC - PubMed
    1. Garcia-Gonzalez L, Pilat D, Baranger K, Rivera S. Emerging alternative proteinases in APP metabolism and Alzheimer's disease pathogenesis: a focus on MT1-MMP and MT5-MMP. Front Aging Neurosci. 2019;11:244. doi: 10.3389/fnagi.2019.00244. - DOI - PMC - PubMed

Publication types

Substances