Multicenter Study
. 2021 Jul;9(7):e002197.
doi: 10.1136/jitc-2020-002197.

Multi-institutional TSA-amplified Multiplexed Immunofluorescence Reproducibility Evaluation (MITRE) Study

Affiliations
Multicenter Study

Multi-institutional TSA-amplified Multiplexed Immunofluorescence Reproducibility Evaluation (MITRE) Study

Janis M Taube et al. J Immunother Cancer. 2021 Jul.

Abstract

Background: Emerging data suggest predictive biomarkers based on the spatial arrangement of cells or coexpression patterns in tissue sections will play an important role in precision immuno-oncology. Multiplexed immunofluorescence (mIF) is ideally suited to such assessments. Standardization and validation of an end-to-end workflow that supports multisite trials and clinical laboratory processes are vital. Six institutions collaborated to: (1) optimize an automated six-plex assay focused on the PD-1/PD-L1 axis, (2) assess intersite and intrasite reproducibility of staining using a locked down image analysis algorithm to measure tumor cell and immune cell (IC) subset densities, %PD-L1 expression on tumor cells (TCs) and ICs, and PD-1/PD-L1 proximity assessments.

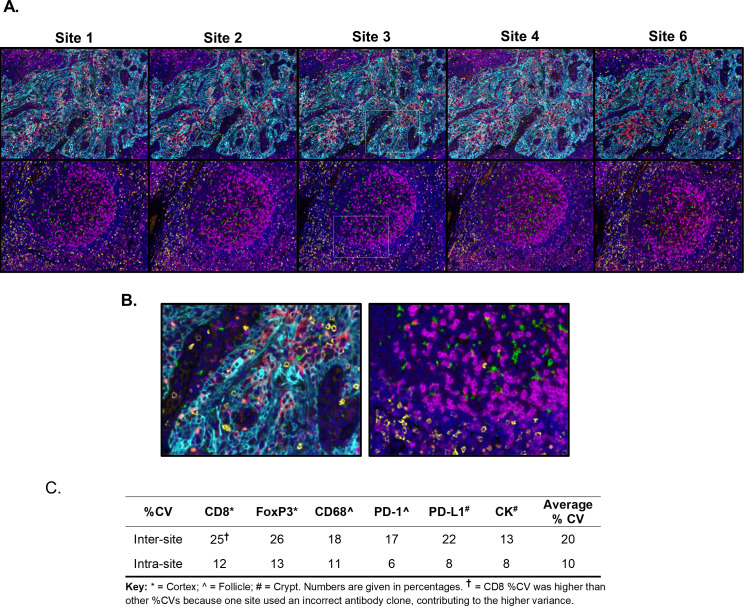
Methods: A six-plex mIF panel (PD-L1, PD-1, CD8, CD68, FOXP3, and CK) was rigorously optimized as determined by quantitative equivalence to immunohistochemistry (IHC) chromogenic assays. Serial sections from tonsil and breast carcinoma and non-small cell lung cancer (NSCLC) tissue microarrays (TMAs), TSA-Opal fluorescent detection reagents, and antibodies were distributed to the six sites equipped with a Leica Bond Rx autostainer and a Vectra Polaris multispectral imaging platform. Tissue sections were stained and imaged at each site and delivered to a single site for analysis. Intersite and intrasite reproducibility were assessed by linear fits to plots of cell densities, including %PDL1 expression by TCs and ICs in the breast and NSCLC TMAs.

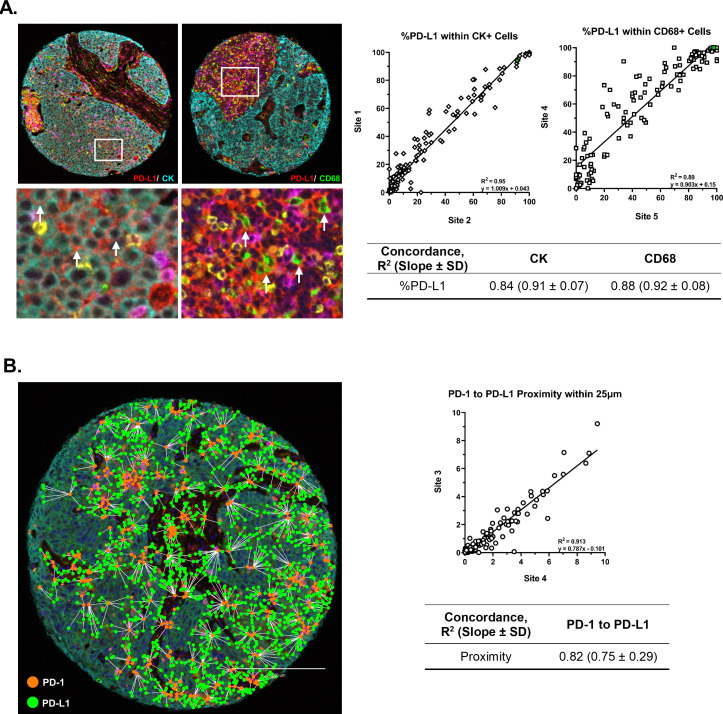
Results: Comparison of the percent positive cells for each marker between mIF and IHC revealed that enhanced amplification in the mIF assay was required to detect low-level expression of PD-1, PD-L1, FoxP3 and CD68. Following optimization, an average equivalence of 90% was achieved between mIF and IHC across all six assay markers. Intersite and intrasite cell density assessments showed an average concordance of R2=0.75 (slope=0.92) and R2=0.88 (slope=0.93) for breast carcinoma, respectively, and an average concordance of R2=0.72 (slope=0.86) and R2=0.81 (slope=0.68) for NSCLC. Intersite concordance for %PD-L1+ICs had an average R2 value of 0.88 and slope of 0.92. Assessments of PD-1/PD-L1 proximity also showed strong concordance (R2=0.82; slope=0.75).

Conclusions: Assay optimization yielded highly sensitive, reproducible mIF characterization of the PD-1/PD-L1 axis across multiple sites. High concordance was observed across sites for measures of density of specific IC subsets, measures of coexpression and proximity with single-cell resolution.

Keywords: biomarkers; breast neoplasms; immunohistochemistry; lung neoplasms; programmed cell death 1 receptor; tumor.


Conflict of interest statement

Competing interests: CB-M, SMJ, and BAF: research support from Bristol Myers Squibb II-ON program, and equipment and supply support from Akoya Biosciences; JT: research support from Bristol Myers Squibb; DLR declares that in the last 2 years, he has served as a consultant to AstraZeneca, Amgen, BMS, Cell Signaling Technology, Cepheid, Daiichi Sankyo, Danaher, GSK, Konica/Minolta, Merck, NanoString, Novartis, PAIGE.AI, PerkinElmer/Akoya Biosciences, Ultivue, and Ventana Medical Systems; BAF declares consulting for Ultivue and Neogenomics and research support from Macrogenics, Bristol Myers Squibb, Incyte, OncoSec Medical, and Merck; KR, CW, JM, CC, BR, DL, and CH: all are employees of Akoya Biosciences. No potential conflicts of interest were disclosed by the other authors.

Figures

Figure 1
Figure 1
The multiplex immunofluorescent (mIF) assay is comparable with monoplex IF and ‘gold standard’ chromogenic IHC staining. (A) Six-plex mIF assay reagents including the TSA-Opal and marker pairings, as well as the clone used for detecting each target. (B) Quantitative comparison of percentage of cells phenotyped as ‘positive’ for each marker by staining approach (chromogenic IHC, monoplex IF, and multiplex IF). For each marker, 10 HPFs per sample (n=5 NSCLC archival specimens) were acquired, and the % positive cells were averaged. Plot shows median and IQR, with whiskers showing min to max for each marker. (C) Representative images for each marker showing comparable staining patterns and cell densities on sequential NSCLC slides stained with chromogenic IHC stains, monoplex IF, and the mIF assay. HPFs, high power fields; IF, immunofluorescent; IHC, immunohistochemistry; NSCLC, non-small cell lung cancer.
Figure 2
Figure 2
Intersite and intrasite reproducibility for the six-plex mIF assay in tonsil tissue. (A) Representative low power images from tonsil serial sections stained at each site.* Yellow=CD8, orange=FoxP3, green=CD68, magenta=PD-1, red=PD-L1 and cyan=CK (tumor marker). (B) High power photomicrographs corresponding to white boxes in low-power images showing staining patterns in the tonsillar crypts (left) and follicles (right). (C) Average intersite and intrasite CVs for each marker, as well as an average %CV for all markers. These comparisons were performed on only the top quartile of cells for each marker to provide a sensitive measure of potential variability. *Site 5 was excluded from this comparison due to a combination of mIF assay run failure and delayed data submission. mIF, multiplex immunofluorescent.
Figure 3
Figure 3
Strong intersite and intrasite concordance was observed for the cell lineages markers assessed in breast carcinoma TMA. (A) A breast carcinoma TMA was cut into 12 serial sections. Two slides were provided to each of the six sites, with one slide stained each of 2 days at each site. Images show the serial sections from a representative TMA core stained at each site over 2 days and highlight the visual consistency of automated mIF assay staining results. (B) Representative intersite cell density concordance plots for each marker, CD68, CD8, FOXP3, PD-1, PD-L1, and CK (tumor cells). The remaining intersite and intrasite comparisons are shown in online supplemental figure S2. (C) Average intersite and intrasite concordance plots densities of each cell lineage. Data shown as R2 (slope and SD of slope). The intersite and intrasite concordance results for cell lineage markers assessed in the NSCLC TMA are shown in online supplemental figure S3. P values for all concordance values are statistically significant. CK, cytokeratin; mIF, multiplex immunofluorescent; NSCLC, non-small cell lung cancer; TMA, tissue microarray.
Figure 4
Figure 4
Strong concordance was also achieved for %PD-L1 coexpression assessments by cell type and PD-1/PD-L1 proximity analysis. (A) Left panels: representative low and corresponding high-power photomicrographs of breast carcinoma TMA cores showing PD-L1 expression on CK+ tumor cells and CD68+ macrophages (white arrows on left and right images, respectively). Right panels: representative intersite comparison demonstrating the percent of PD-L1 displayed by CK+ and CD68+ cells. Green data points identify the two TMA cores shown in the left panels. The remaining intersite and intrasite comparisons are shown in online supplemental table S2. There was high average intersite concordance of %PD-L1 within CK+ and CD68+ cells (table shows R2 with slope and SD of slope). Similar results for intersite and intrasite concordance were observed in the NSCLC TMA and are shown in online supplemental table S3. (B) Left panel: representative image showing a TMA core with proximity map overlay, where orange dots represent PD-1+ cells, and green dots represent PD-L1+ cells. White lines display distance from all PD-L1+ cells to neighboring PD-1+ cells. Only those within 25 µm are counted (scale bar represents 200 µm). Right panel: representative intersite comparison demonstrating reproducibility of PD-1/PD-L1 proximity assessment. A high average intersite concordance for assessment of PD-1/PD-L1 proximity was observed. The individual intersite comparisons for both the breast and lung TMAs are shown in online supplemental tables S4 and S5 (table shows R2 with slope and SD of slope). P values for all concordance values are statistically significant. NSCLC, non-small cell lung cancer; TMAs, tissue microarrays.

References

    1. Taube JM, Galon J, Sholl LM, et al. . Implications of the tumor immune microenvironment for staging and therapeutics. Mod Pathol 2018;31:214–34. 10.1038/modpathol.2017.156 - DOI - PMC - PubMed
    1. Sunshine J, Taube JM. Pd-1/Pd-L1 inhibitors. Curr Opin Pharmacol 2015;23:32–8. 10.1016/j.coph.2015.05.011 - DOI - PMC - PubMed
    1. Hansen AR, Siu LL. Pd-L1 testing in cancer: challenges in companion diagnostic development. JAMA Oncol 2016;2:15–16. 10.1001/jamaoncol.2015.4685 - DOI - PubMed
    1. Rimm DL, Han G, Taube JM, et al. . A prospective, multi-institutional, Pathologist-Based assessment of 4 immunohistochemistry assays for PD-L1 expression in non-small cell lung cancer. JAMA Oncol 2017;3:1051–8. 10.1001/jamaoncol.2017.0013 - DOI - PMC - PubMed
    1. Taube JM, Anders RA, Young GD, et al. . Colocalization of inflammatory response with B7-H1 expression in human melanocytic lesions supports an adaptive resistance mechanism of immune escape. Sci Transl Med 2012;4:127ra37. 10.1126/scitranslmed.3003689 - DOI - PMC - PubMed

Publication types

Substances