. 2021 Aug 1;35(15-16):1093-1108.
doi: 10.1101/gad.348319.121. Epub 2021 Jul 15.

Transient genomic instability drives tumorigenesis through accelerated clonal evolution

Affiliations

Transient genomic instability drives tumorigenesis through accelerated clonal evolution

Ofer Shoshani et al. Genes Dev. .

Abstract

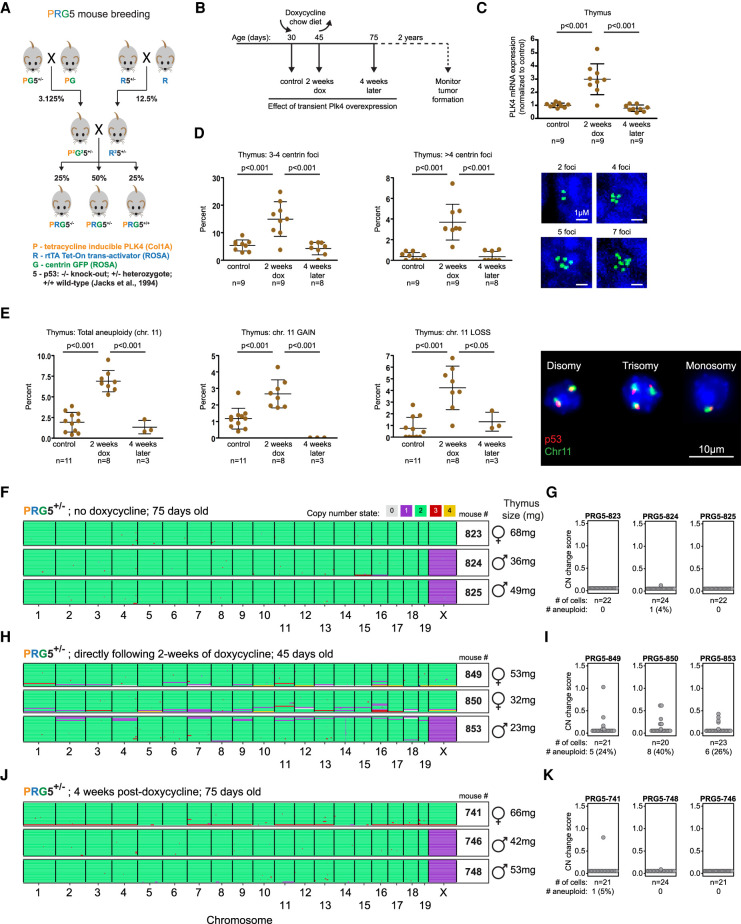
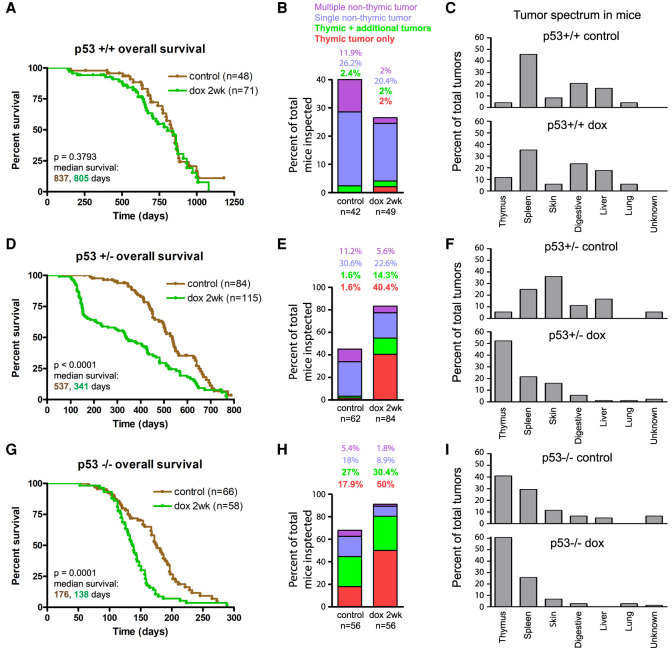
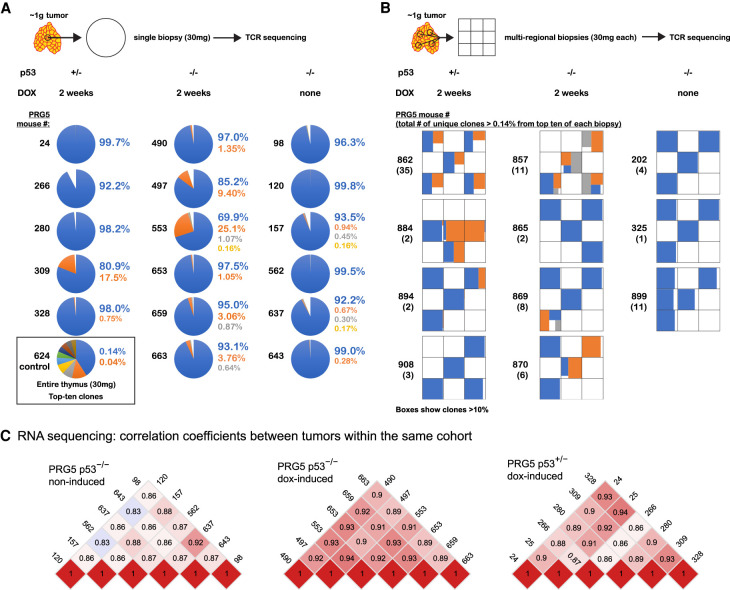
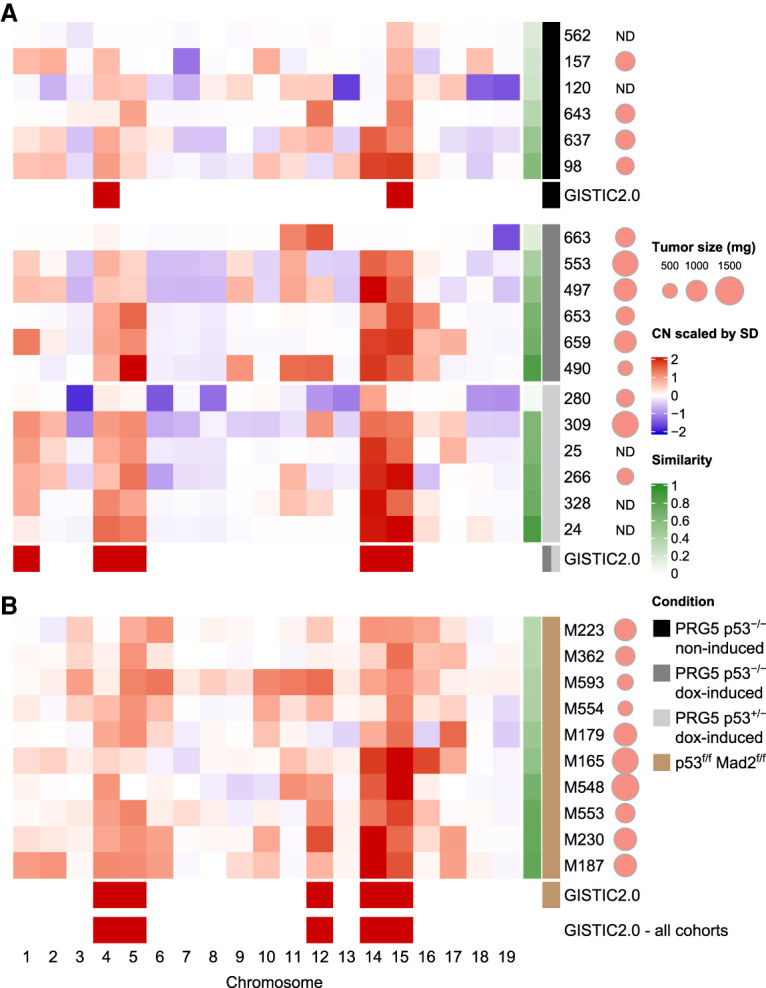
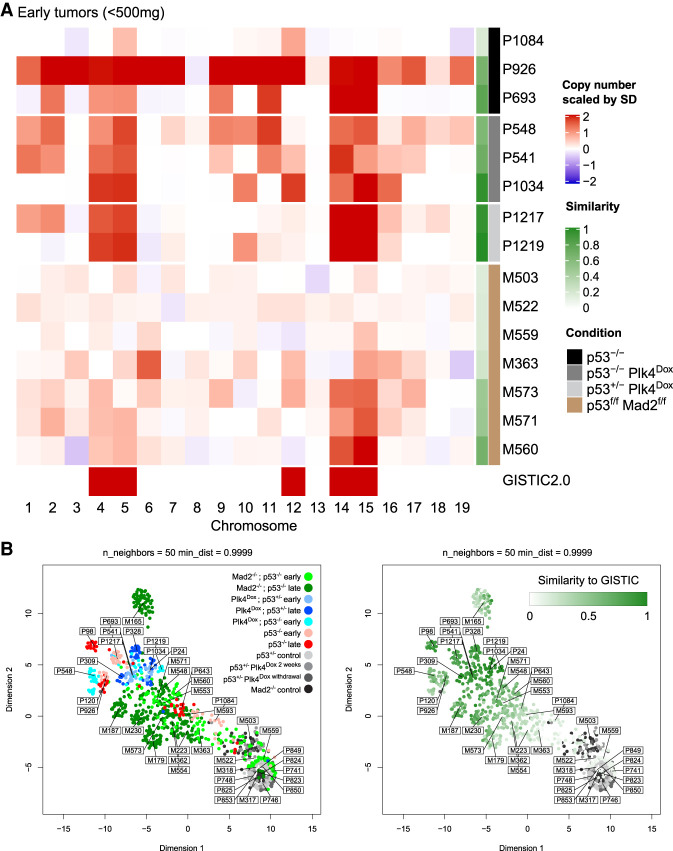
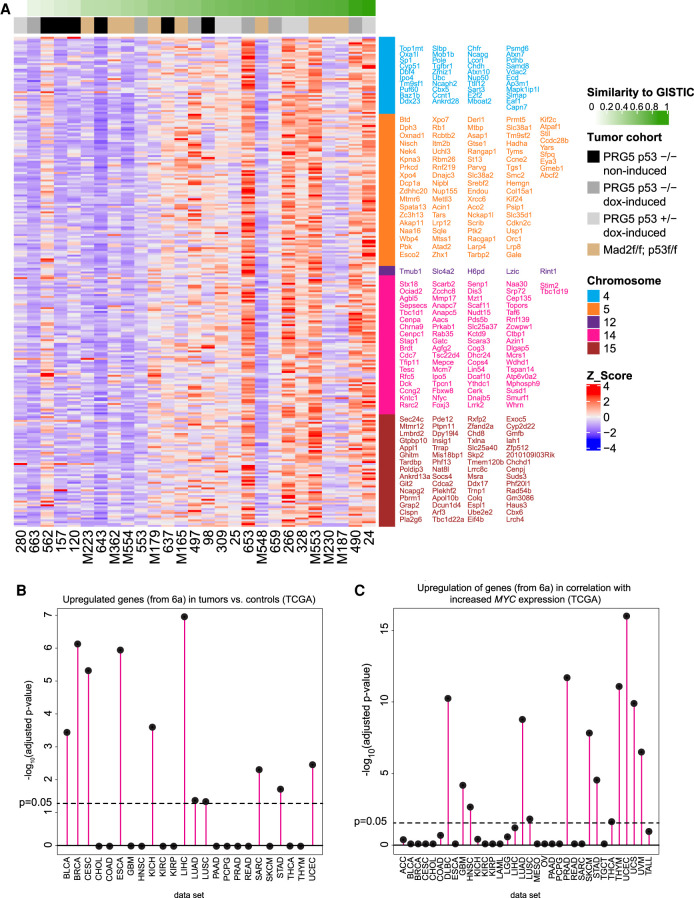
Abnormal numerical and structural chromosome content is frequently found in human cancer. To test the role of aneuploidy in tumor initiation and progression, we generated mice with random aneuploidies by transient induction of polo-like kinase 4 (Plk4), a master regulator of centrosome number. Short-term chromosome instability (CIN) from transient Plk4 induction resulted in formation of aggressive T-cell lymphomas in mice with heterozygous inactivation of one p53 allele and accelerated tumor development in the absence of p53. Transient CIN increased the frequency of lymphoma-initiating cells with a specific karyotype profile, including trisomy of chromosomes 4, 5, 14, and 15 occurring early in tumorigenesis. Tumor development in mice with chronic CIN induced by an independent mechanism (through inactivation of the spindle assembly checkpoint) gradually trended toward a similar karyotypic profile, as determined by single-cell whole-genome DNA sequencing. Overall, we show how transient CIN generates cells with random aneuploidies from which ones that acquire a karyotype with specific chromosome gains are sufficient to drive cancer formation, and that distinct CIN mechanisms can lead to similar karyotypic cancer-causing outcomes.

Keywords: Myc; Plk4; aneuploidy; cancer; chromosome instability; p53.


Figures

Figure 1.
Figure 1.
Transient CIN in mice through induced Plk4 overexpression drives transient aneuploidy. (A) Breeding strategy used to obtain doxycycline-inducible Plk4 mice with centrin-GFP and under different backgrounds of p53 (PRG5 mice). P2 and R2 denote homozygosity for Plk4 and rtTA genes, respectively. (B) Overview of the experimental design using PRG5 mice. (CE) Plk4 mRNA levels (C), measurement of centrin-GFP foci (D), and percent aneuploidy for chromosome 11 using interphase DNA-FISH (E) in thymuses from PRG5 mice before (control), immediately after (2 wk dox), and 1 mo after (4 wk later) doxycycline administration. Mean ± SD of indicated mice per group are presented. P-values determined using one-way ANOVA with Tukey's multiple comparison test. (F,H,J) Heat maps showing DNA copy number using single-cell whole-genome sequencing of cells collected from PRG5+/− mice before (F), immediately after (H), and 1 mo after (J) Plk4 induction. (G,I,K) Analysis of copy number changes of the samples at the left (shown in F,H,J). See the Materials and Methods for details about calculation of the CN (copy number) change score. Statistics below the dot plots indicate the total number and percentage of cells with at least one whole chromosome gain or loss.
Figure 2.
Figure 2.
Transient CIN drives thymic lymphoma in p53-deficient mice. (A,D,G) Survival (Kaplan-Meier) plots of control (noninduced) PRG5 mice and PRG5 mice treated with doxycycline for 2 wk at the age of 30 d (dox 2 wk) with wild-type p53 (A), heterozygous p53 (D), and p53 knockout (G) backgrounds. Comparison of indicated number of mice done using log rank test. (B,E,H) Thymic and nonthymic tumor frequencies of indicated number in PRG5 mice treated with doxycycline for 2 wk at the age of 30 d with wild-type p53 (B), heterozygous p53 (E), and p53 knockout (H) backgrounds. (C,F,I) Distribution of tumor types from indicated number of tumors in PRG5 mice treated with doxycycline for 2 wk at the age of 30 d with wild-type p53 (C), heterozygous p53 (F), and p53 knockout backgrounds (I).
Figure 3.
Figure 3.
Tumors formed following transient CIN have increased tumor-initiating cell burden but share a similar transcription profile. (A,B) Results from T-cell receptor sequencing showing the top 10 T-cell receptor sequences (indicative of T-cell clones) identified in thymic T-cell lymphomas from PRG5 mice in single biopsies (A) and multiregional biopsies (B) as determined using T-cell receptor sequencing. T-cell receptor sequencing allowed the identification of T-cell lymphoma-initiating cells by using the T-cell receptor as an endogenous barcode. A control thymic sample (mouse #624) is presented in A, showing the expected low frequency of each T-cell receptor sequence, indicating there was no selection for a specific T-cell clone. (C) Heat maps showing pairwise Pearson correlation coefficients among samples (tumor single biopsies) using transcript per million (TPM) values as determined using RNA sequencing of the PRG5 mice.
Figure 4.
Figure 4.
CIN accelerates the selection for a specific aneuploidy profile. (A,B) Heat maps showing averaged chromosome DNA copy number changes in late tumors (>500 mg) from noninduced p53−/− PRG5 mice (black), 2-wk doxycycline-treated (at the age of 30 d) p53−/− PRG5 mice (dark gray) and p53+/− PRG5 mice (light gray) (A), and from Lck-Cre+; Mad2f/f; p53f/f mice (brown) (B). Copy number changes of PRG5 mice were determined using whole-genome sequencing. Averaged copy number from single-cell whole-genome sequencing (as shown in Fig. 1D) is shown for tumors from Mad2 mice. Genomic identification of significant targets in cancer (GISTIC 2.0) analysis showing significant (q = 0.01) aneuploidies for each cohort and across all cohorts are presented. The similarity of individual tumors to the GISTIC 2.0 output from across all cohorts is presented in the green heat map (see Supplemental Table S4 for similarity values). Scaled tumor weights are presented. (ND) Not determined.
Figure 5.
Figure 5.
Transient CIN selects for a specific aneuploidy profile early during tumor development. (A) Heat map showing averaged DNA copy number changes in early tumors (<500 mg) from noninduced p53−/− PRG5 mice (black), 2-wk doxycycline-treated (at the age of 30 d) p53−/− PRG5 mice (dark gray) and p53+/− PRG5 mice (light gray), and Lck-Cre+; Mad2f/f; p53f/f mice (brown) as determined using single-cell whole-genome sequencing. Single-cell data of tumors from PRG5 mice are in Supplemental Figure S12, and of Mad2 mice in Supplemental Figure S10. Genomic identification of significant targets in cancer (GISTIC) 2.0 analysis showing significant aneuploidies across all tumors is shown at the bottom. The similarity of individual tumors to the GISTIC 2.0 output is presented in the green heat map. (B, left) Uniform manifold approximation and projection (UMAP) analysis of DNA copy number changes in control (gray shades), p53−/− noninduced PRG5 tumors (red shades), doxycycline-induced PRG5 tumors (blue shades), and Mad2 tumors (green shades). (Right) Embedding of the GISTIC 2.0 similarity score for each sample shown in the UMAP plot at the left. Control samples were not used for the GISTIC 2.0 analysis and appear in gray shades.
Figure 6.
Figure 6.
Acquisition of the aneuploidy-specific profile reshapes gene expression and correlates with increasing c-Myc expression in human cancers. (A) Heat map showing genes from the indicated chromosomes whose expression (RNA) significantly correlated with the similarity index (similarity to the DNA copy number profile as determined by GISTIC from Fig. 4) of terminal tumors from the indicated PRG5 and Mad2 mice. Gene names are color-coded according to chromosome numbers and are sorted from top left to bottom right. See Supplemental Table S5 for a list of genes. (B) Enrichment of the CIN-induced gene expression profile (as shown in A and in Supplemental Table S5) in TCGA tumor cohorts gene lists of significantly up-regulated genes relative to their nontumor controls. (C) Enrichment of the CIN-induced gene expression profile (as shown in A and in Supplemental Table S5) in TCGA cohorts in correlation with MYC expression. A Spearman correlation coefficient between the gene's expression and MYC expression (among all samples) and the posterior probability that the gene is correlated with MYC was calculated. The ranked gene lists were then tested for enrichment with Bioconductor fgsea on the CIN-induced gene expression profile (Supplemental Table S5).

References

    1. Baker DJ, Jin F, Jeganathan KB, van Deursen JM. 2009. Whole chromosome instability caused by Bub1 insufficiency drives tumorigenesis through tumor suppressor gene loss of heterozygosity. Cancer Cell 16: 475–486. 10.1016/j.ccr.2009.10.023 - DOI - PMC - PubMed
    1. Bakker B, Taudt A, Belderbos ME, Porubsky D, Spierings DC, de Jong TV, Halsema N, Kazemier HG, Hoekstra-Wakker K, Bradley A, et al. 2016. Single-cell sequencing reveals karyotype heterogeneity in murine and human malignancies. Genome Biol 17: 115. 10.1186/s13059-016-0971-7 - DOI - PMC - PubMed
    1. Basto R, Brunk K, Vinadogrova T, Peel N, Franz A, Khodjakov A, Raff JW. 2008. Centrosome amplification can initiate tumorigenesis in flies. Cell 133: 1032–1042. 10.1016/j.cell.2008.05.039 - DOI - PMC - PubMed
    1. Ben-David U, Amon A. 2020. Context is everything: aneuploidy in cancer. Nat Rev Genet 21: 44–62. 10.1038/s41576-019-0171-x - DOI - PubMed
    1. Bettencourt-Dias M, Rodrigues-Martins A, Carpenter L, Riparbelli M, Lehmann L, Gatt MK, Carmo N, Balloux F, Callaini G, Glover DM. 2005. SAK/PLK4 is required for centriole duplication and flagella development. Curr Biol 15: 2199–2207. 10.1016/j.cub.2005.11.042 - DOI - PubMed

Publication types