. 2021 Aug 5;8(4):ENEURO.0566-20.2021.
doi: 10.1523/ENEURO.0566-20.2021. Print 2021 Jul-Aug.

Role of NMDA Receptors in Adult Neurogenesis and Normal Development of the Dentate Gyrus

Affiliations

Role of NMDA Receptors in Adult Neurogenesis and Normal Development of the Dentate Gyrus

Ingrid Åmellem et al. eNeuro. .

Abstract

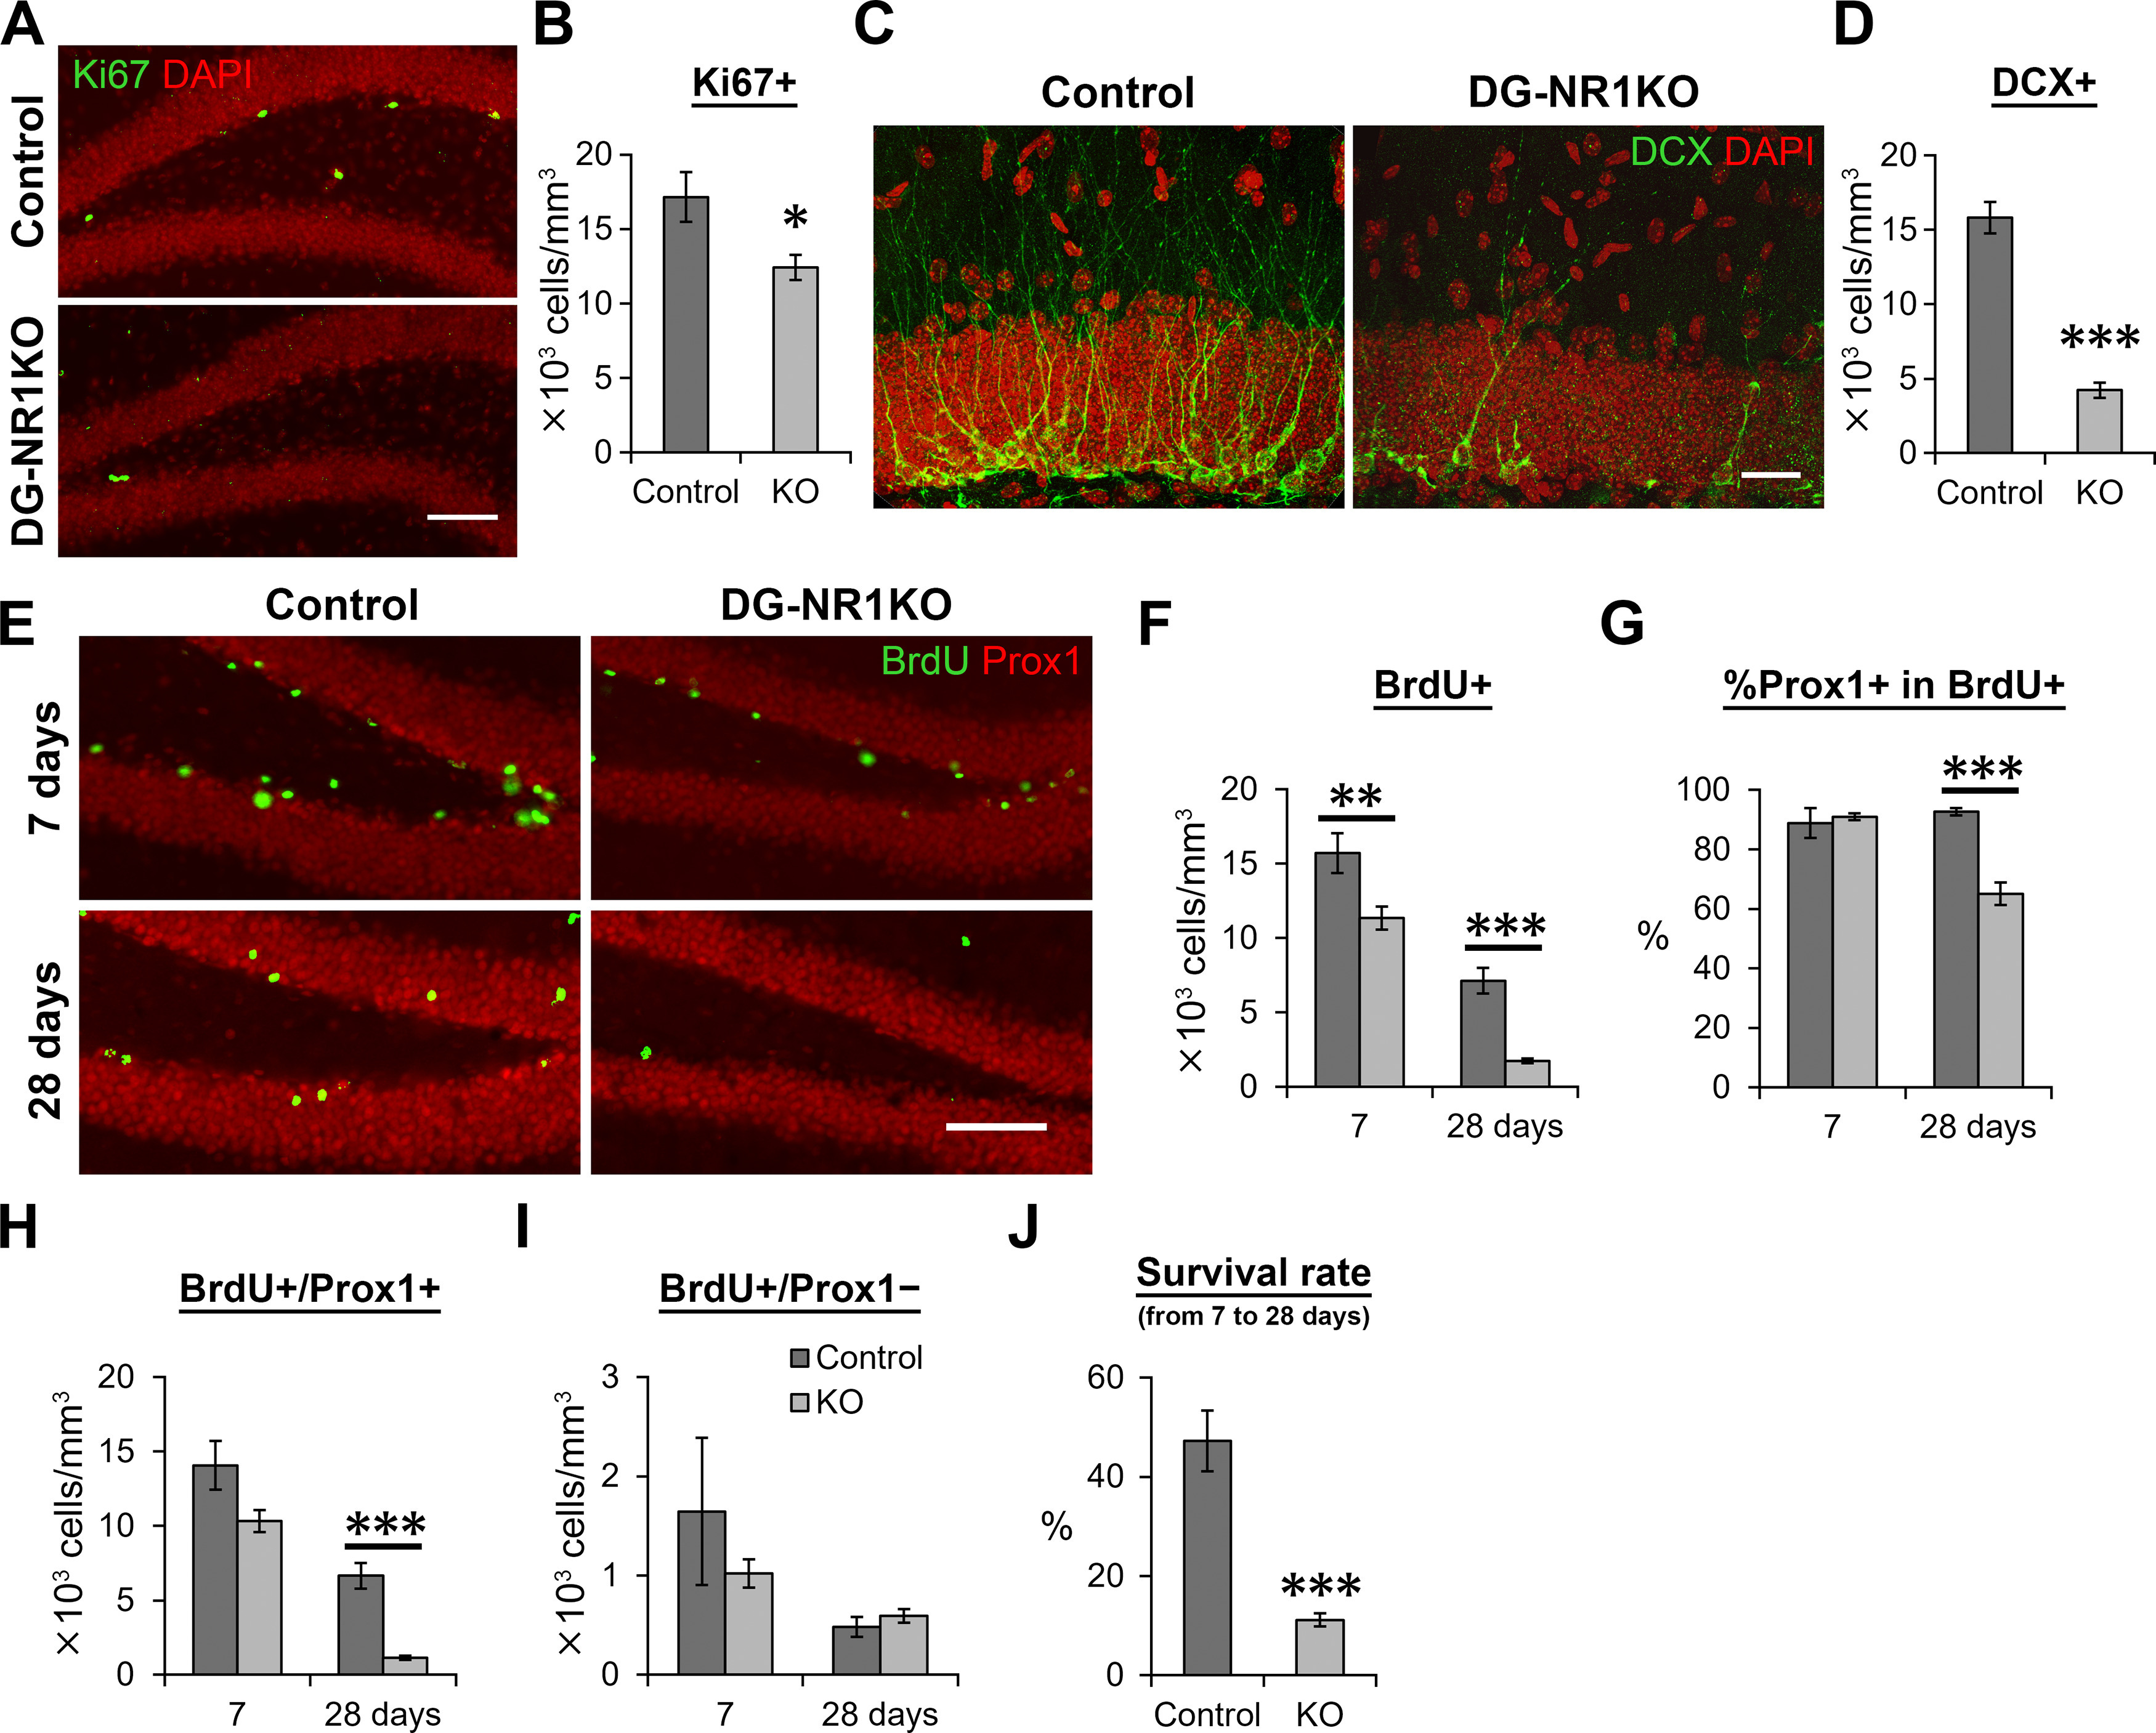
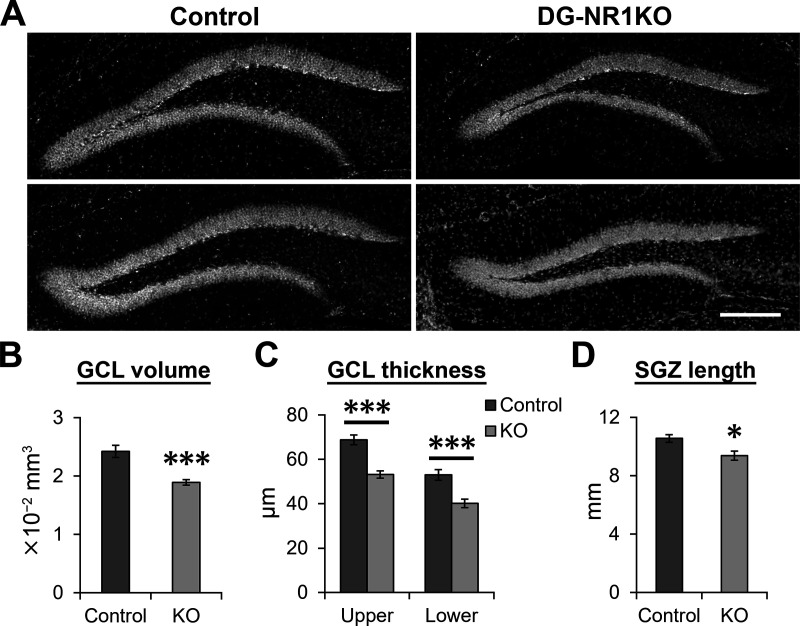
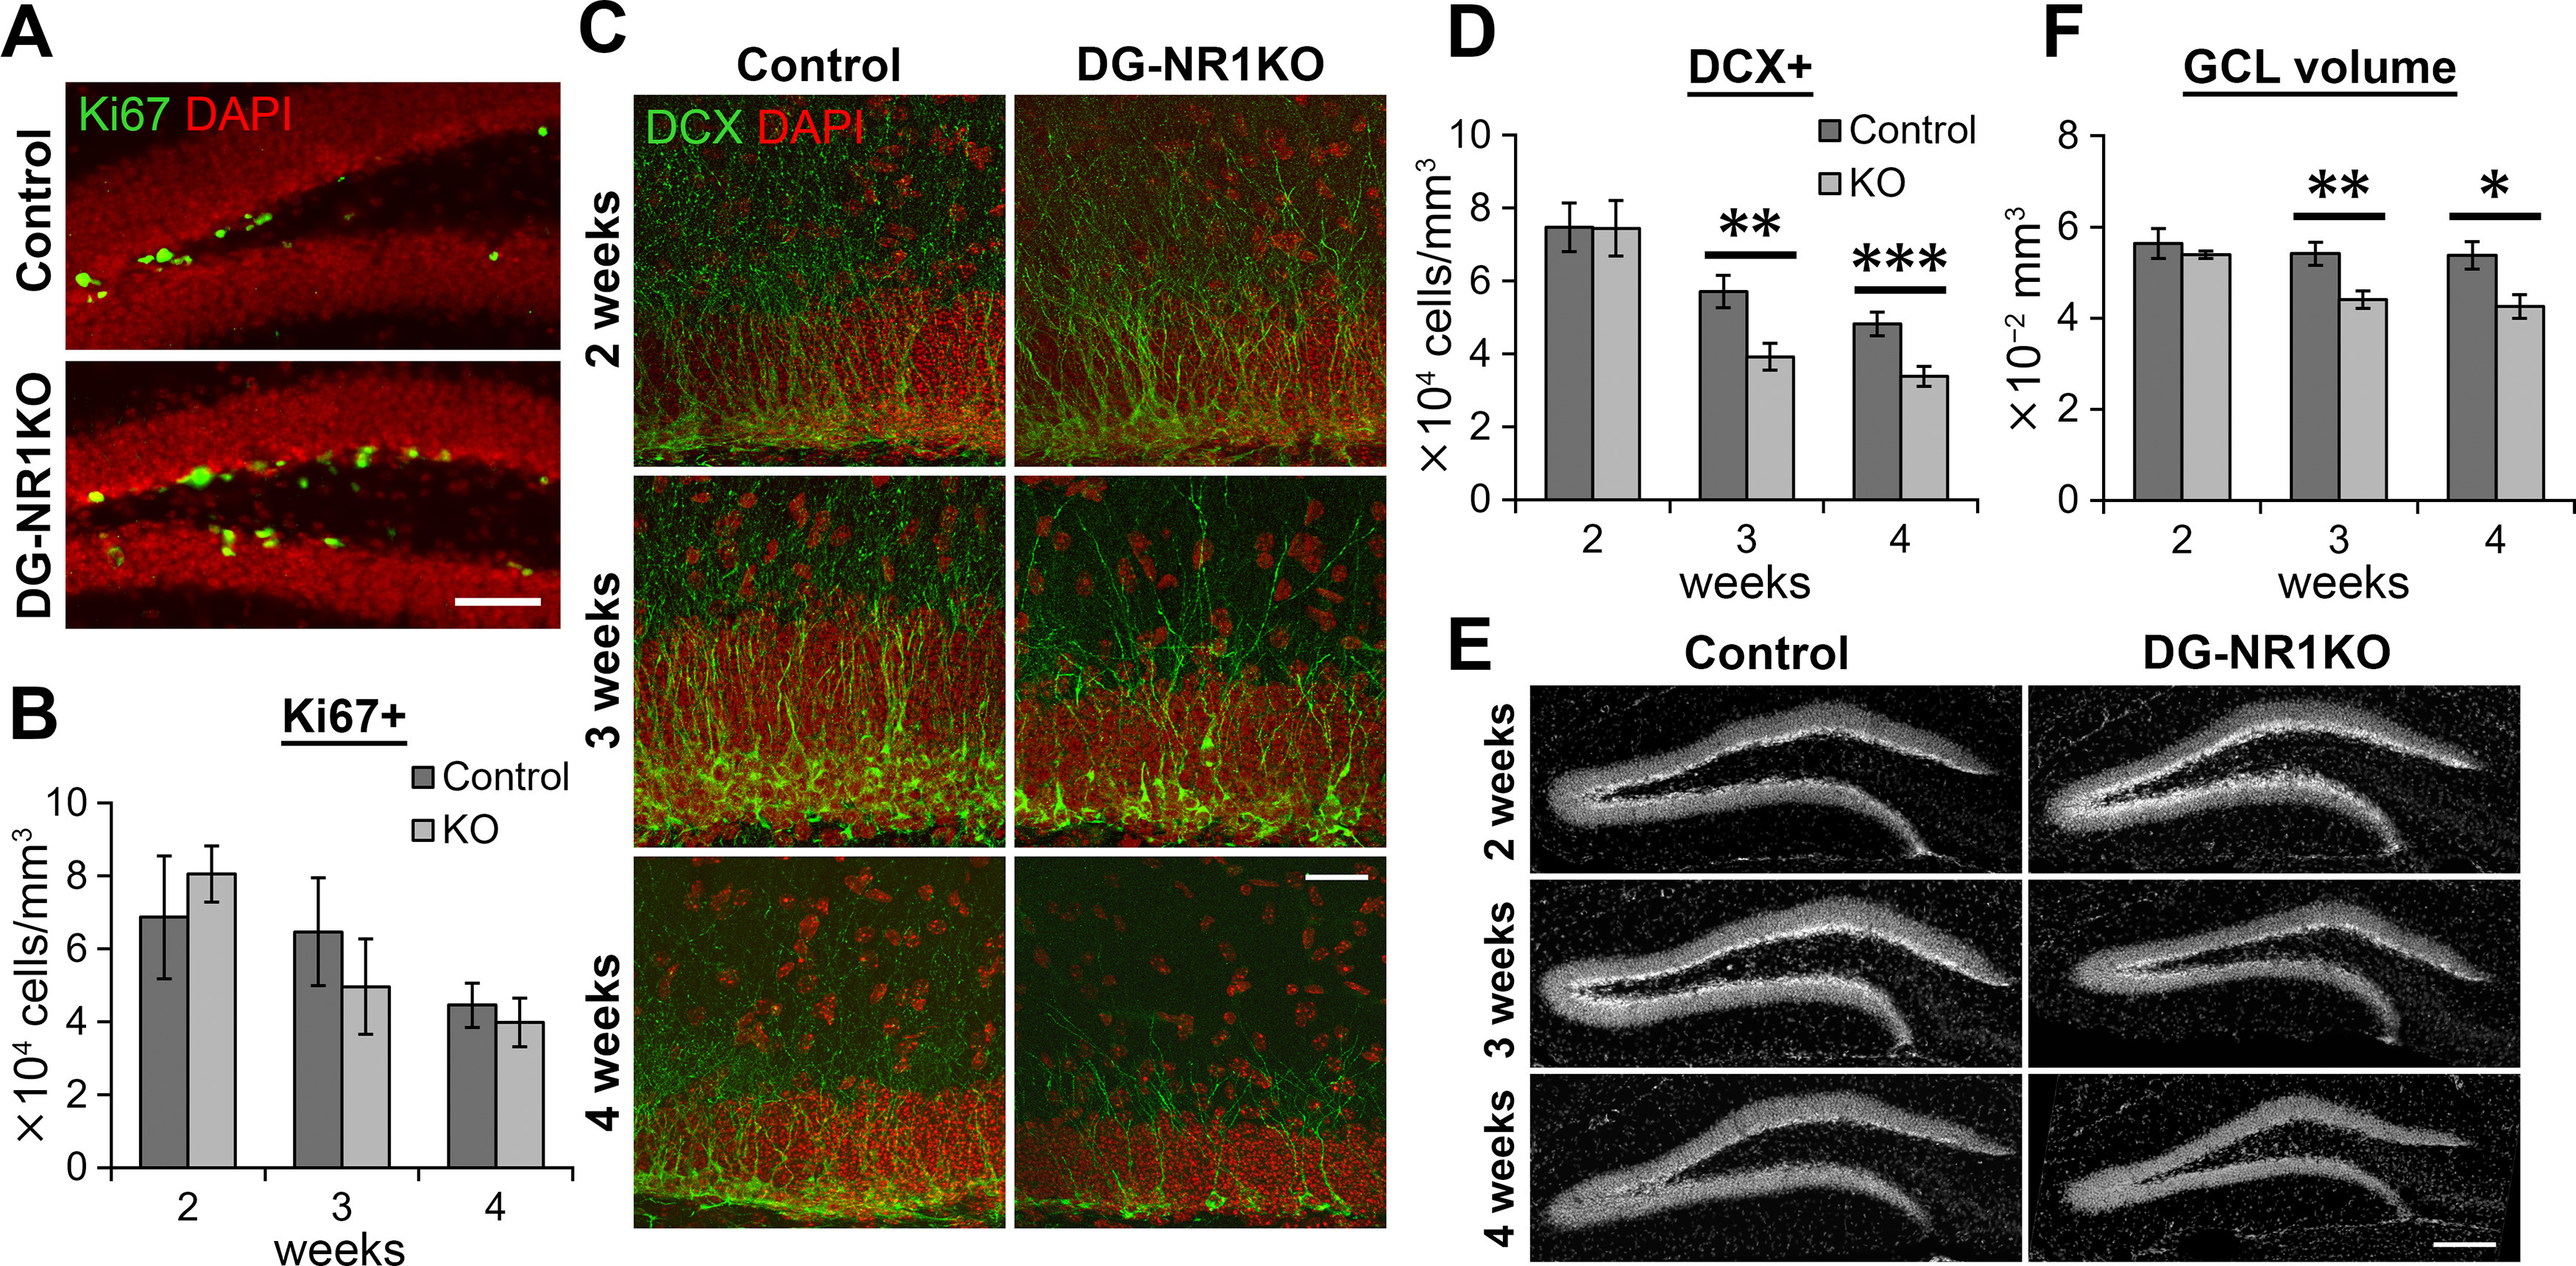
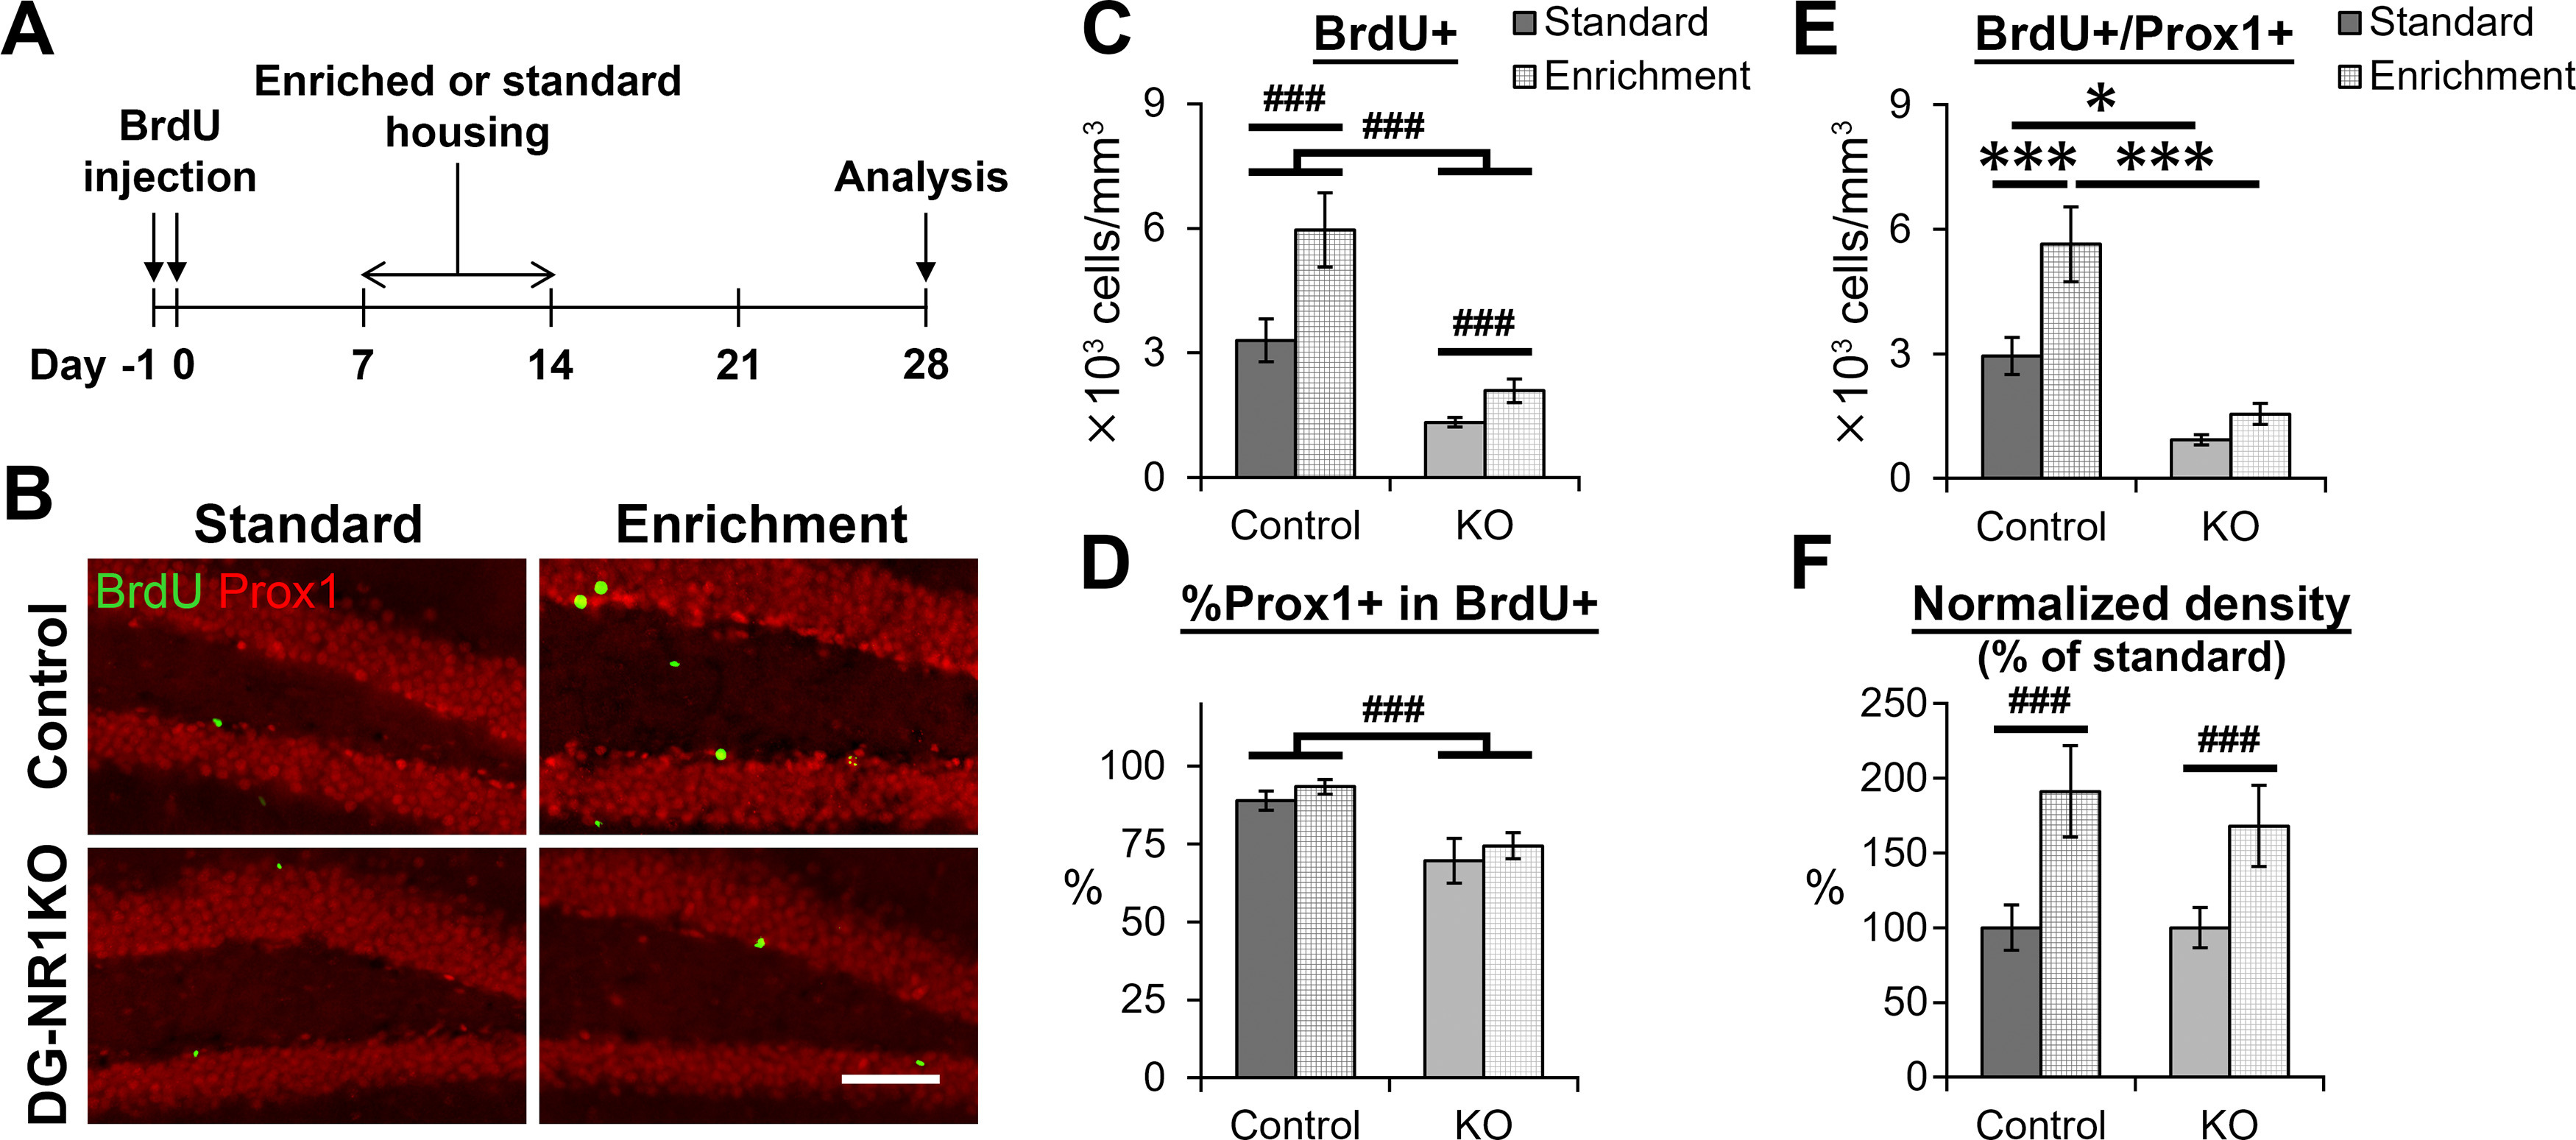
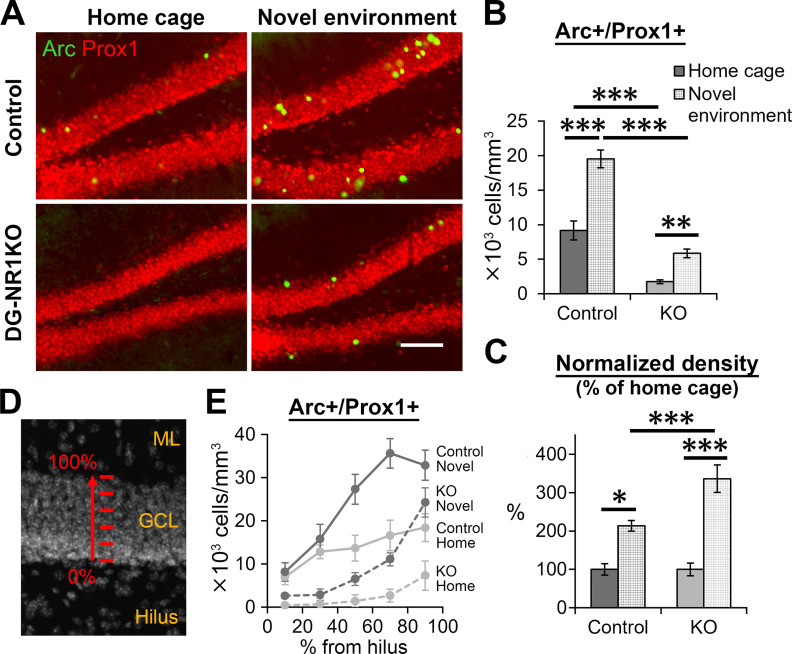
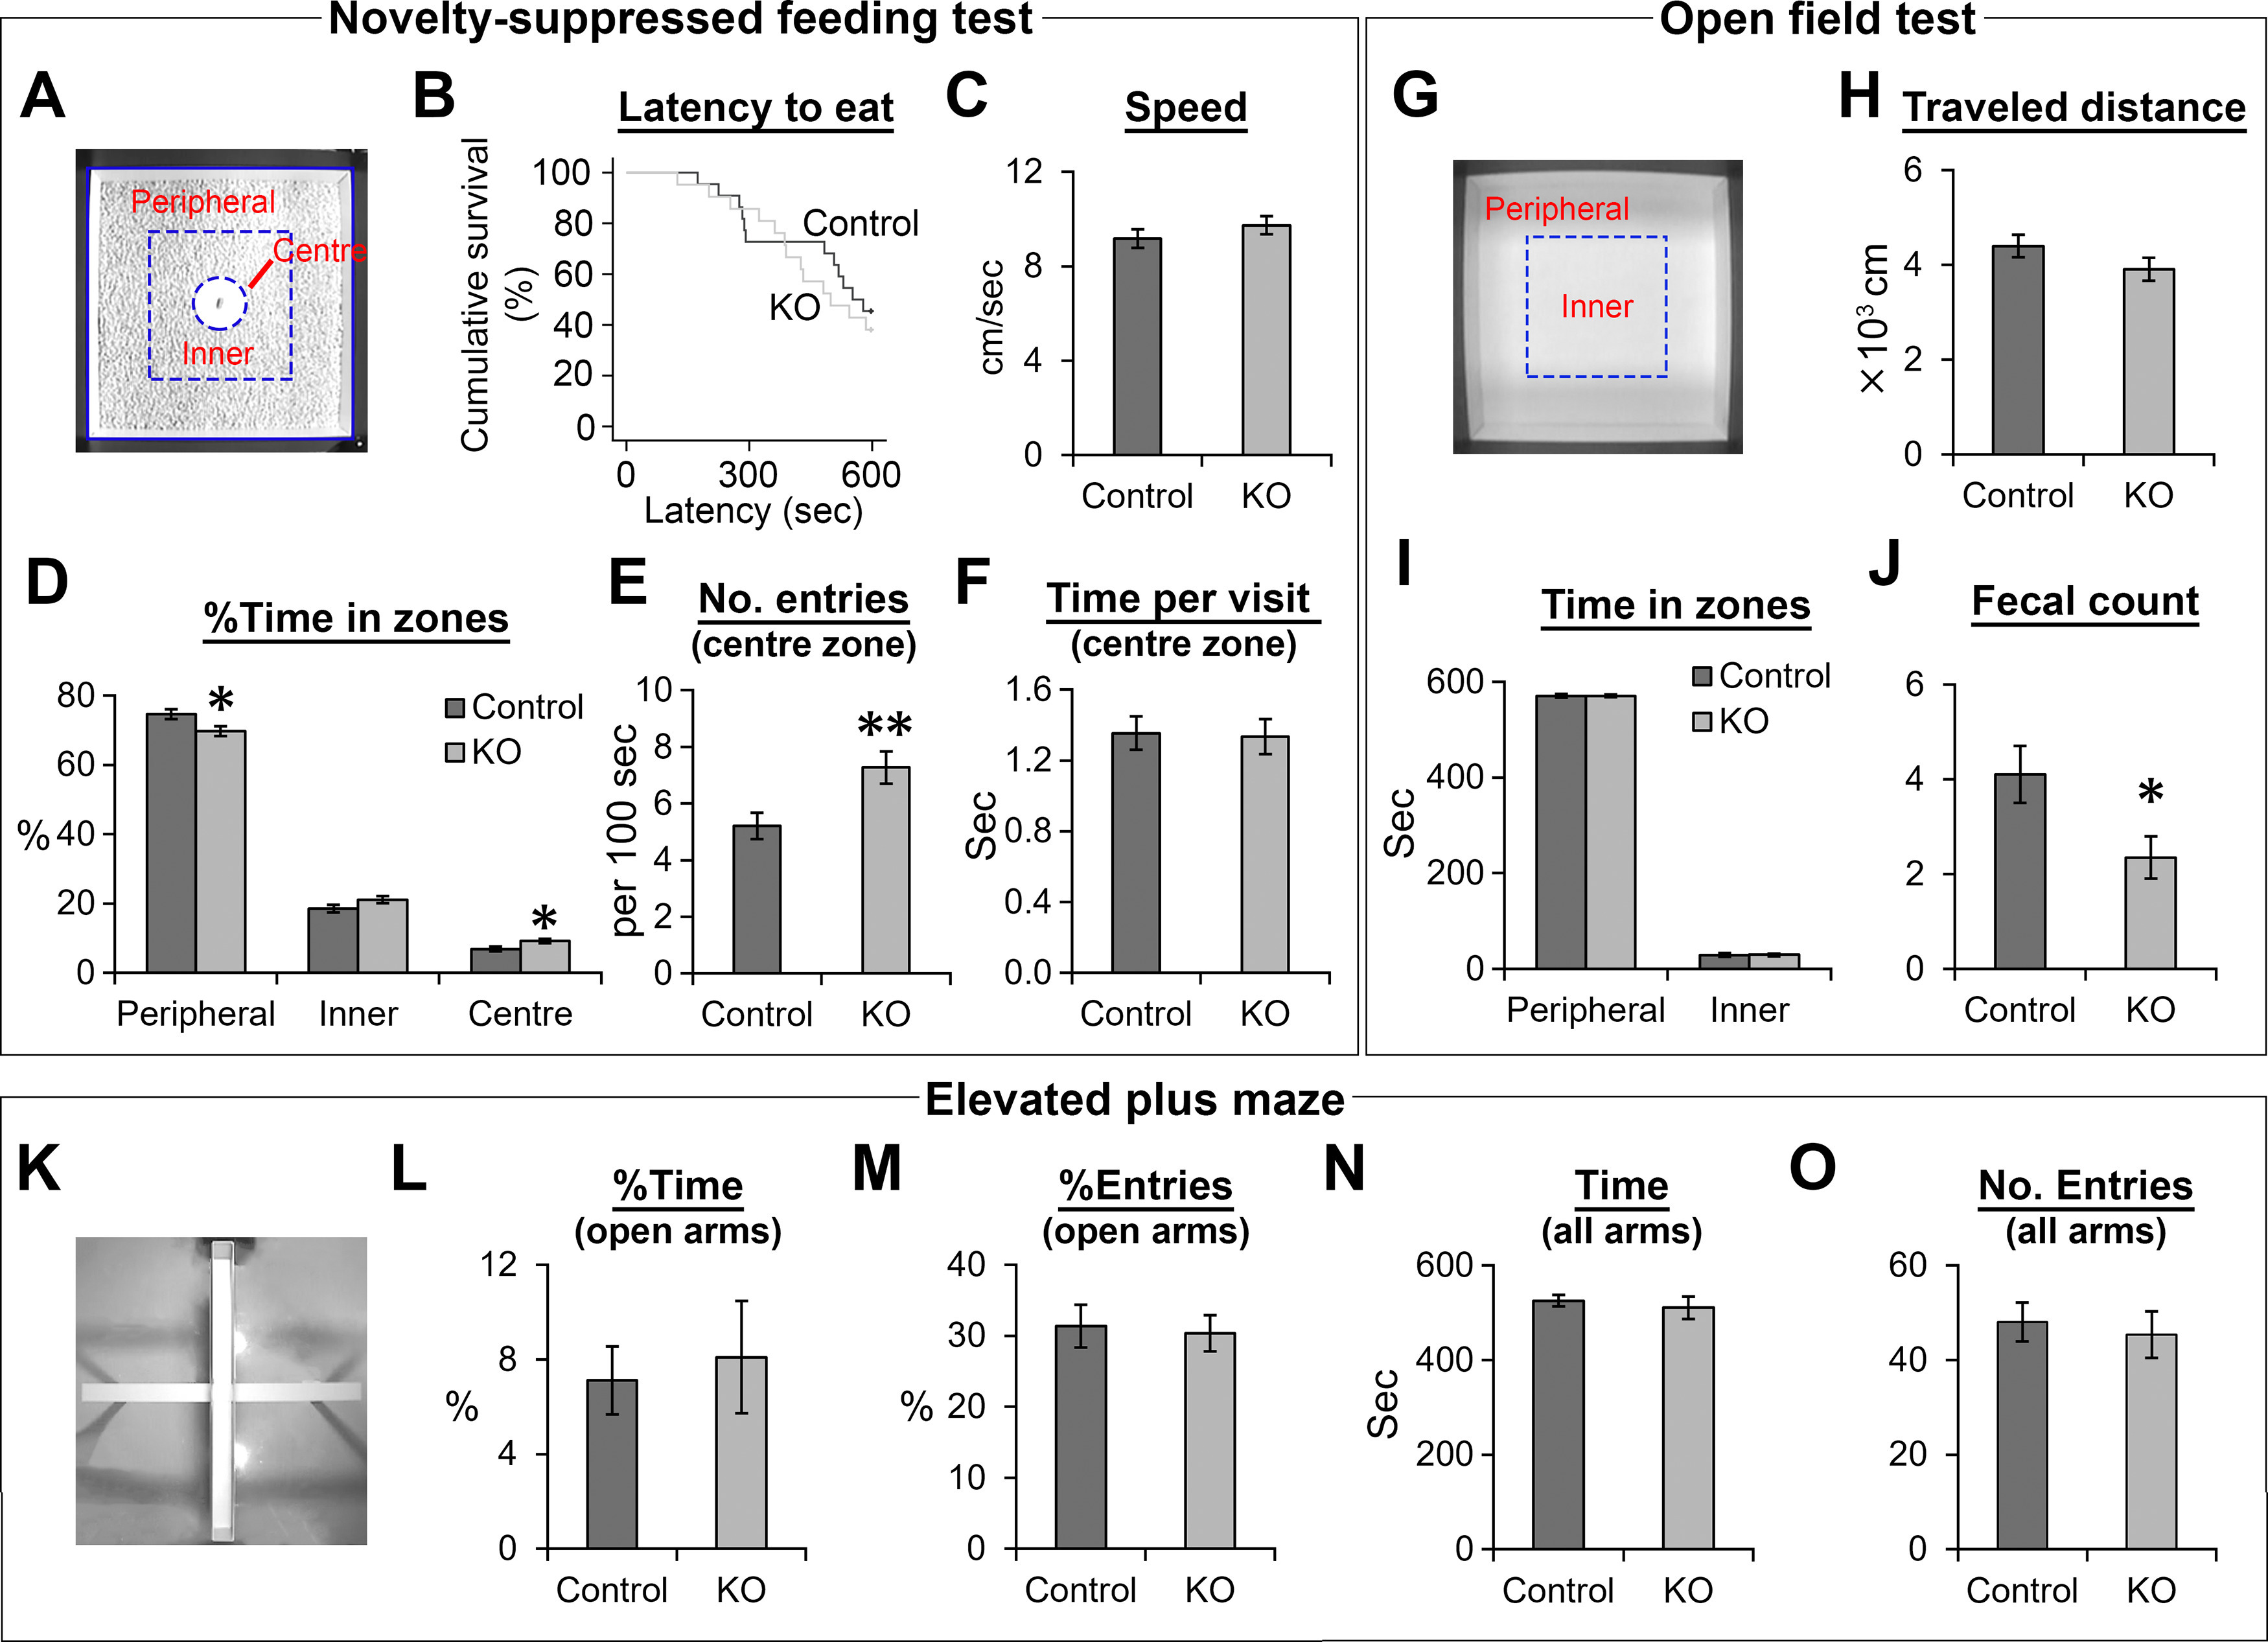
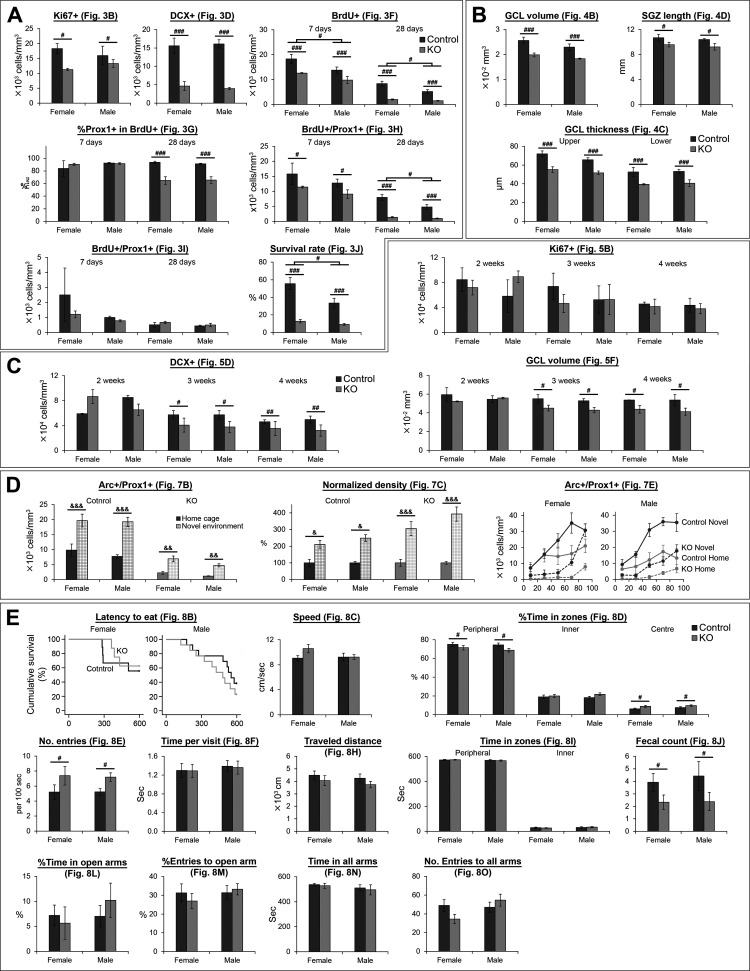
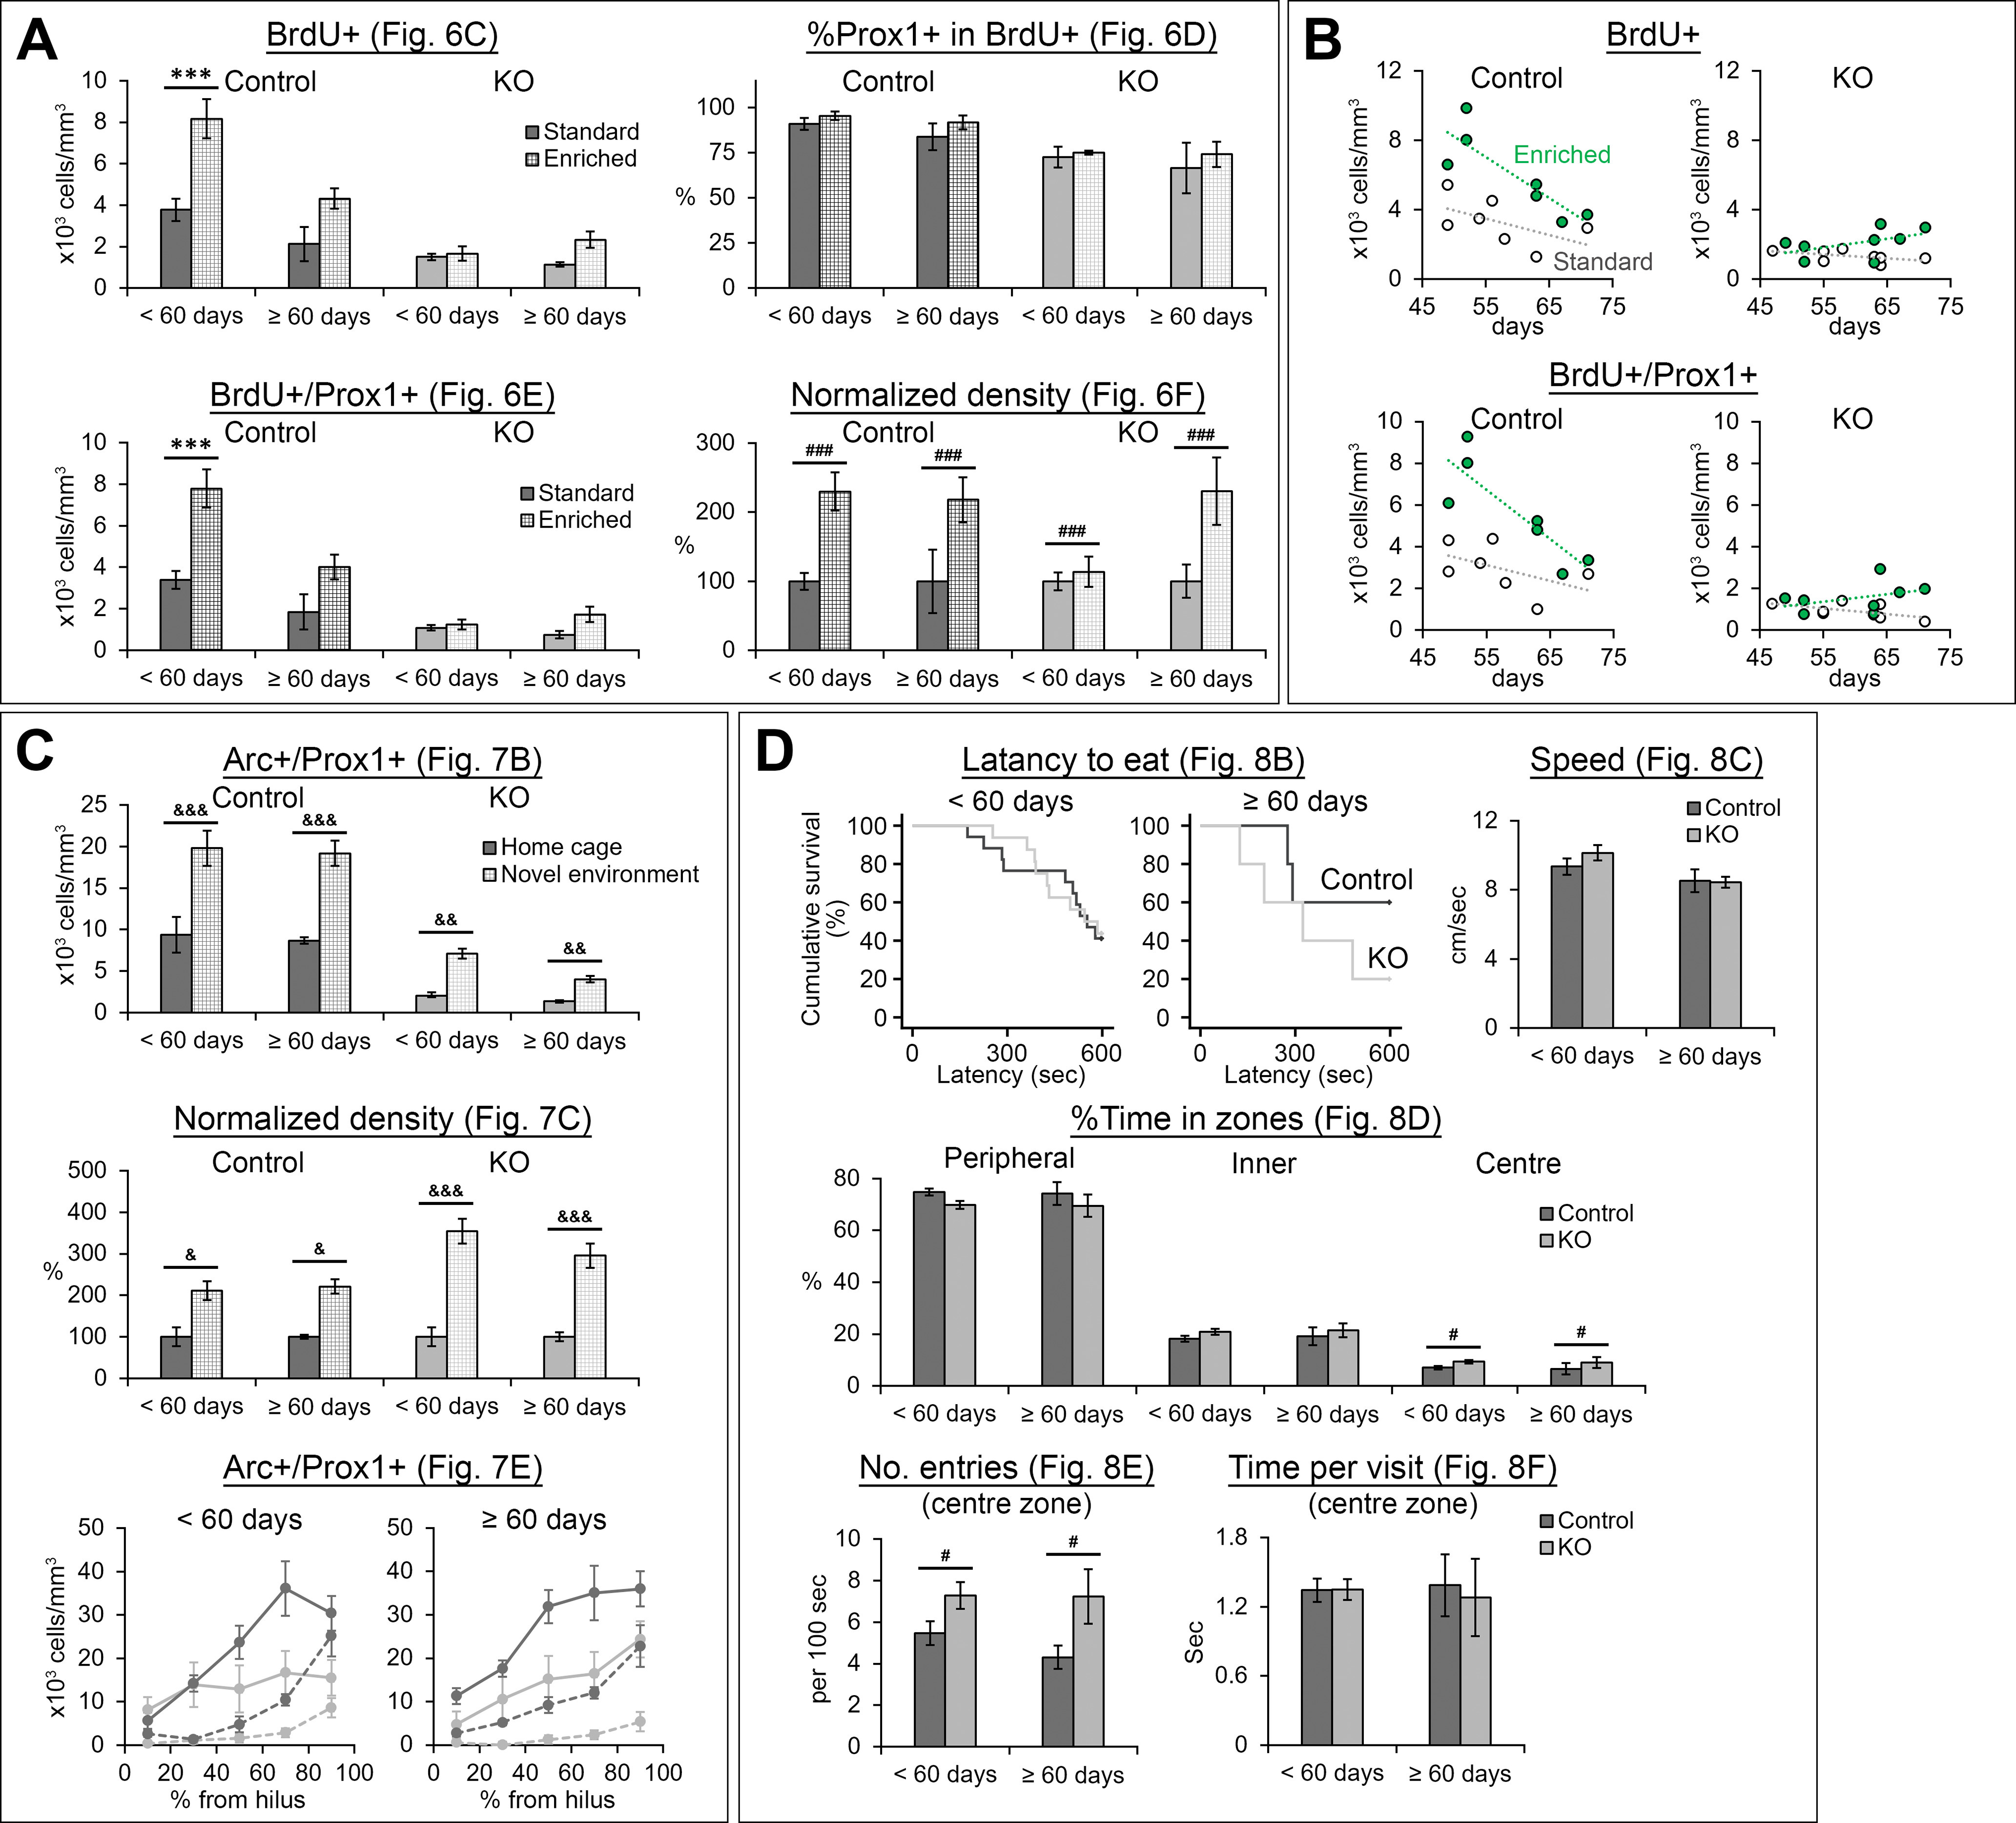
The NMDA receptors are a type of glutamate receptors, which is involved in neuronal function, plasticity and development in the mammalian brain. However, how the NMDA receptors contribute to adult neurogenesis and development of the dentate gyrus is unclear. In this study, we investigate this question by examining a region-specific knock-out mouse line that lacks the NR1 gene, which encodes the essential subunit of the NMDA receptors, in granule cells of the dentate gyrus (DG-NR1KO mice). We found that the survival of newly-generated granule cells, cell proliferation and the size of the granule cell layer are significantly reduced in the dorsal dentate gyrus of adult DG-NR1KO mice. Our results also show a significant reduction in the number of immature neurons and in the volume of the granule cell layer, starting from three weeks of postnatal age. DG-NR1KO mice also showed impairment in the expression of an immediate early gene, Arc, and behavior during the novelty-suppressed feeding and open field test. These results suggest that the NMDA receptors in granule cells have a role in adult neurogenesis in the adult brain and contributes to the normal development of the dentate gyrus.

Keywords: granule cell; hippocampus; neuronal survival; novelty suppressed feeding test; pattern separation.


Figures

Figure 1.
Figure 1.
Specificity of Cre expression. A representative image showing YFP signal in Cre+/− offspring from crossing Pomc-cre+/− and cre-dependent ChR2-YFP reporter lines. Consistent with McHugh et al. (2007), we found dense expression in the dentate gyrus and sparser expression in the arcuate nucleus of the hypothalamus and the habenula. We also noted sparse expression in the optic tract, which McHugh et al. (2007) did not mention, but we can observe it in their figures (McHugh et al., 2007; their Fig. 1A,D). Fluorescence signal in the molecular layer of the dentate gyrus and stratum lucidum of the CA3 area reflects the dendrites and axons of granule cells, respectively. Scale bar: 1 mm.
Figure 2.
Figure 2.
Enriched housing used in this study.
Figure 3.
Figure 3.
Cell proliferation and the survival of new neurons were reduced in the dentate gyrus of adult DG-NR1KO mice. A, Representative images visualizing Ki67+ (green) and DAPI-labeled (red) cells in the dentate gyrus of adult control and DG-NR1KO mice. Scale bar: 75 μm. B, Density of Ki67+ cells in the subgranular zone. C, Representative images showing DCX+ (green) and DAPI-labeled (red) cells in the dentate gyrus of adult control and DG-NR1KO mice. The images were maximum intensity projections of confocal Z stacks and formed by joining two overlapping images containing adjacent areas. Scale bar: 25 μm. D, Density of DCX+ cells. E, Representative images showing BrdU+ (green) and Prox1+ (red) cells in adult control and DG-NR1KO mice on 7 and 28 d after BrdU injections. Scale bar: 75 μm. F, Density of BrdU+ cells in the granule cell layer and subgranular zone. G, Proportion of BrdU+ cells expressing Prox1. H, Density of BrdU+/Prox1+ cells in the granule cell layer. I, Density of BrdU+/Prox1– cells in the granule cell layer. J, Survival rate of BrdU+/Prox1+ cells from 7 to 28 dpi. Density at 28 d after BrdU injection was divided by mean values of density at 7 d; *p < 0.05, **p < 0.01, ***p < 0.005, independent-sample t test, two tailed.
Figure 4.
Figure 4.
Reduced size of the granule cell layer in adult DG-NR1KO mice. A, Representative images showing the granule cell layer visualized by DAPI staining in adult control and DG-NR1KO mice. Scale bar: 150 μm. B, Volume of the granule cell layer (GCL) in adult control and DG-NR1KO mice. Summed volume from three analyzed sections is presented. C, Thickness of the upper and lower blade of granule cell layer in adult control and DG-NR1KO mice. D, Length of the subgranular zone (SGZ) in adult control and DG-NR1KO mice; *p < 0.05, ***p < 0.005, independent-sample t test, two tailed.
Figure 5.
Figure 5.
Neurogenesis was impaired in the dentate gyrus of postnatal, developing DG-NR1KO mice. A, Representative images showing Ki67+ (green) and DAPI-labeled (red) cells in the dentate gyrus of four-week-old control and DG-NR1KO mice. Scale bar: 60 μm. B, Density of Ki67+ cells in the subgranular zone in two-, three-, and four-week-old control and DG-NR1KO mice. C, Representative images showing DCX+ (green) and DAPI-labeled (red) cells in the dentate gyrus of two-, three-, and four-week-old control and DG-NR1KO mice. The images were maximum intensity projections of confocal Z stacks. Scale bar: 25 μm. D, Density of DCX+ cells in the granule cell layer of two-, three-, and four-week-old control and DG-NR1KO mice. E, Representative images showing the granule cell layer visualized by DAPI staining in two-, three-, and four-week-old control and DG-NR1KO mice. Scale bar: 150 μm. F, Volume of the granule cell layer (GCL) in two-, three-, and four-week-old control and DG-NR1KO mice. Summed volume from six analyzed sections is presented; *p < 0.05, **p < 0.01, ***p < 0.005, independent-sample t test, two tailed.
Figure 6.
Figure 6.
Exposure to an enriched environment increases the survival of newborn neurons in DG-NR1KO mice. A, Experimental timeline. B, Representative images showing BrdU+ (green) and Prox1+ (red) cells in the dentate gyrus of adult control and DG-NR1KO mice with or without exposure to the enriched environment. Scale bar: 60 μm. C, Density of BrdU+ cells in the dentate gyrus of adult control and DG-NR1KO mice with or without exposure to the enriched environment. D, Proportion of BrdU+ cells expressing Prox1. E, Density of BrdU+/Prox1+ cells in the granule cell layer of adult control and DG-NR1KO mice with or without exposure to the enriched environment. F, Normalized density of BrdU+/Prox1+ cells in the granule cell layer of adult control and DG-NR1KO mice with or without exposure to the enriched environment. Density of each mouse was divided by a mean value of mice without exposure to the enriched environment in the same genotype; *p < 0.05, ***p < 0.005, Tukey’s HSD test (performed because of significant genotype × housing interaction in two-way ANOVA); ###p < 0.005, the main effect of genotype or housing (without significant interaction).
Figure 7.
Figure 7.
Impairment in novelty-induced Arc gene expression in granule cells of DG-NR1KO mice. A, Representative images showing Arc+ (green) and Prox1+ (red) expressing cells in the dentate gyrus of adult control and DG-NR1KO mice, which stayed in their home cage or were exposed to a novel environment. Scale bar: 75 μm. B, Density of Arc+/Prox1+ cells in the granule cell layer of adult control and DG-NR1KO mice with or without exposure to the novel environment. C, Normalized density of Arc+/Prox1+ cells in the granule cell layer of adult control and DG-NR1KO mice with or without exposure to the novel environment. Density of each mouse was divided by a mean value of mice without exposure to the novel environment in the same genotype. D, Depth categories divided along the thickness of the granule cell layer. The granule cell layer (GCL) was divided into five 20%-thickness segments, with 0% starting at the border to the hilus and 100% at the border to the molecular layer (ML). E, Density distribution of Arc+/Prox1+ cells along depth; *p < 0.05, **p < 0.01, ***p < 0.005, Tukey’s HSD test.
Figure 8.
Figure 8.
The DG-NR1KO mice display higher tendency to explore the center of an open field during a novelty-suppressed feeding test and show higher fecal counts in an open field test. A, A square open field used in a novelty-suppressed feeding test. Division of the open field into the peripheral, inner and center zone. B, Survival graph for latency to consume food for adult control and DG-NR1KO mice. C–F, Behavioral measurements in the novelty-suppressed feeding test for adult control and DG-NR1KO mice. G, A square open field used in an open field test. Division of the square open field into the peripheral and inner zone. H–J, Behavioral measurements in the open field test for adult control and DG-NR1KO mice. K, An elevated plus maze. L–O, Behavioral measurements in the elevated plus maze for adult control and DG-NR1KO mice; *p < 0.05, **p < 0.01, independent-sample t test, two tailed.
Figure 9.
Figure 9.
Graphs showing data from female and male mice separately. Data corresponding to Figures 3 (A), 4 (B), 5 (C), 7 (D), and 8 (E) are shown separately for females and males. Statistical results are summarized in Table 1-Table 14; #p < 0.05, ##p < 0.01, ###p < 0.005, the main effect of genotype or sex (without significant interaction); &p < 0.05, &&p < 0.01, &&&p < 0.005, Tukey’s HSD test (home cage vs NE including both sexes together and performed each genotype separately; performed because of significant genotype × exposure interaction).
Figure 10.
Figure 10.
Graphs showing data from <60- and ≥60-d-old mice separately. Data corresponding to Figures 6 (A), 7 (C), and 8 (D) are shown separately for <60- and ≥60-d-old mice. B, Relationship of the densities of BrdU+ and BrdU+/Prox1+ cells with the age of mice at the time of the first BrdU injection. Statistical results are summarized in Table 15-Table 26; ***p < 0.005, Tukey’s HSD test, performed because of significant genotype × housing interaction in two-way ANOVA; #p < 0.05, ###p < 0.005, the main effect of genotype, &p < 0.05, &&p < 0.01, &&&p < 0.005, Tukey’s HSD test (home cage vs novel environment including both age groups together and performed separately for each genotype; performed because of significant genotype × exposure interaction).

References

    1. Åmellem I, Suresh S, Chang CC, Tok SSL, Tashiro A (2017) A critical period for antidepressant-induced acceleration of neuronal maturation in adult dentate gyrus. Transl Psychiatry 7:e1235. - PMC - PubMed
    1. Bannerman DM, Bus T, Taylor A, Sanderson DJ, Schwarz I, Jensen V, Hvalby Ø, Rawlins JN, Seeburg PH, Sprengel R (2012) Dissecting spatial knowledge from spatial choice by hippocampal NMDA receptor deletion. Nat Neurosci 15:1153–1159. 10.1038/nn.3166 - DOI - PMC - PubMed
    1. Bear MF, Cooper LN, Ebner FF (1987) A physiological basis for a theory of synapse modification. Science 237:42–48. 10.1126/science.3037696 - DOI - PubMed
    1. Bruel-Jungerman E, Davis S, Rampon C, Laroche S (2006) Long-term potentiation enhances neurogenesis in the adult dentate gyrus. J Neurosci 26:5888–5893. 10.1523/JNEUROSCI.0782-06.2006 - DOI - PMC - PubMed
    1. Cameron HA, Woolley CS, McEwen BS, Gould E (1993) Differentiation of newly born neurons and glia in the dentate gyrus of the adult rat. Neuroscience 56:337–344. 10.1016/0306-4522(93)90335-d - DOI - PubMed

Publication types

Substances

LinkOut - more resources