. 2021 Jul 15;12(1):4333.
doi: 10.1038/s41467-021-24650-3.

Routine sub-2.5 Å cryo-EM structure determination of GPCRs

Affiliations

Routine sub-2.5 Å cryo-EM structure determination of GPCRs

Radostin Danev et al. Nat Commun. .

Abstract

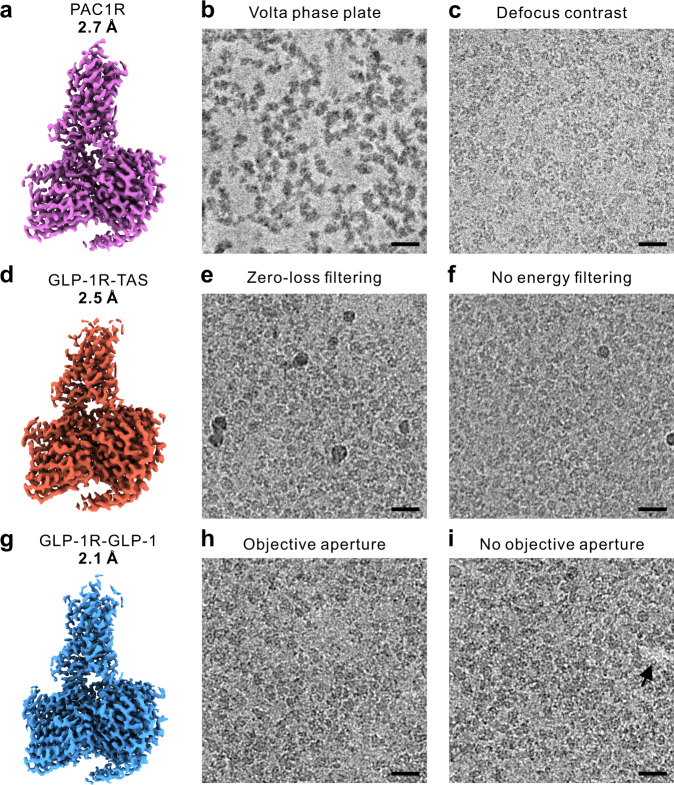
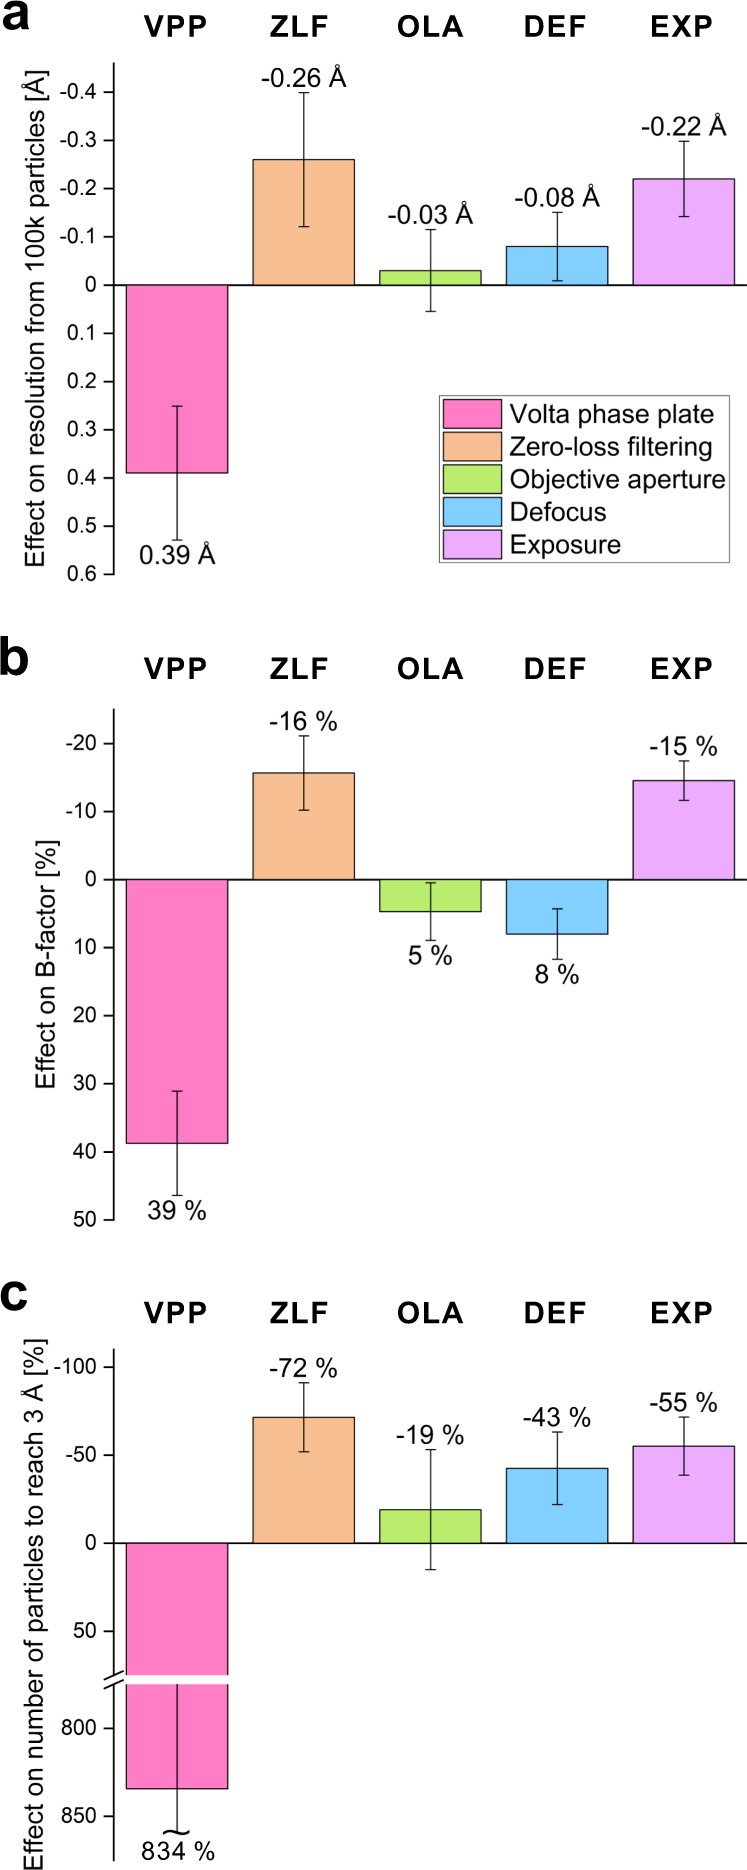
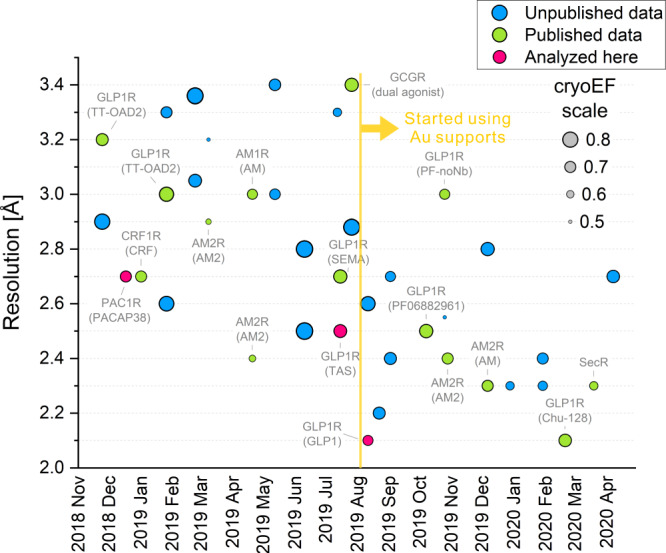
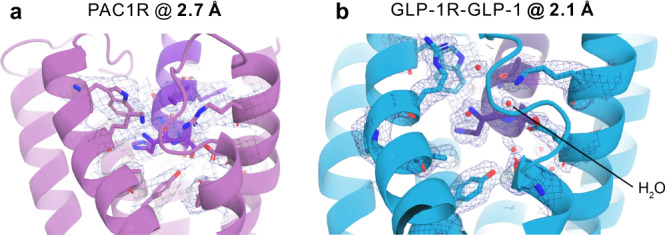
Cryo-electron microscopy (cryo-EM) of small membrane proteins, such as G protein-coupled receptors (GPCRs), remains challenging. Pushing the performance boundaries of the technique requires quantitative knowledge about the contribution of multiple factors. Here, we present an in-depth analysis and optimization of the main experimental parameters in cryo-EM. We combined actual structural studies with methods development to quantify the effects of the Volta phase plate, zero-loss energy filtering, objective lens aperture, defocus magnitude, total exposure, and grid type. By using this information to carefully maximize the experimental performance, it is now possible to routinely determine GPCR structures at resolutions better than 2.5 Å. The improved fidelity of such maps enables the building of better atomic models and will be crucial for the future expansion of cryo-EM into the structure-based drug design domain. The optimization guidelines given here are not limited to GPCRs and can be applied directly to other small proteins.


Conflict of interest statement

The authors declare no competing interests.

Figures

Fig. 1
Fig. 1. 3D maps and representative micrographs from class B GPCR datasets used for the evaluation of experimental parameters.
a PACAP38:PAC1R:Gs (PAC1R) dataset collected in part with the Volta phase plate (4032 micrographs) (b), and in part with defocus phase contrast (3617 micrographs) (c). d Taspoglutide:GLP-1R:Gs (GLP-1R-TAS) dataset acquired partially with zero-loss energy filtering (5508 micrographs) (e), and partially without energy filtering (3251 micrographs) (f). g GLP-1:GLP-1R:Gs (GLP-1R-GLP-1) dataset acquired in part with a 100 μm objective lens aperture (3003 micrographs) (h), and in part without an aperture (2736 micrographs) (i). Scale bars 20 nm.
Fig. 2
Fig. 2. Effect of the experimental parameters on the three main performance measures.
The graphs summarize the performance effects of the Volta phase plate (VPP), zero-loss filtering (ZLF), objective lens aperture (OLA), higher defocus (DEF), and higher exposure (EXP). In all plots, an upward bar indicates an improvement in performance. a Effect of the experimental parameters on the resolution from 100 k particles expressed as the difference in Å (from Table 2). b Effect on the B-factor expressed as the change in % from the B-factor without the device, low DEF or low EXP to the B-factor with the device, high DEF or high EXP (from Table 2). c Effect on the number of particles to reach 3 Å resolution expressed as the change in % from the number of particles without the device, low DEF or low EXP to the number of particles with the device, high DEF or high EXP (from Table 2). Error bars represent the standard error of each value estimated from the B-factor linear fits through 7 ≤ n ≤ 9 independent 3D reconstructions from random particle subsets of varying size (Supplementary Fig. 1a–e).
Fig. 3
Fig. 3. Resolution history of our cryo-EM GPCR reconstructions.
Over the year and a half period shown in the plot, there is a general trend towards better resolution with a significant improvement in August 2019, when the sample supports were switched from holey carbon films to gold foil grids. The size of each dot represents the cryo-EM efficiency quantity (cryoEF, see values in the legend) that estimates the uniformity of the particle orientation distribution. A value of ~0.5 represents an angular distribution that is barely sufficient for producing a usable 3D map and a value of 1 corresponds to an ideal uniform distribution. Published results are annotated and the three datasets analyzed in this study are highlighted in pink.
Fig. 4
Fig. 4. Illustration of the atomic modeling benefits from improved map resolution.
Cartoon representation of the N-terminal portion of the agonist peptides PACAP38 and GLP-1 bound to their respective receptors. The cryo-EM density maps are drawn at 5-sigma as a blue mesh and highlight the ability to more accurately model side chain and water positions at a higher spatial resolution. a N terminus of the PACAP38 peptide (purple) bound to the PAC1 receptor (pink) at 2.7 Å resolution. There were no reliably detectable water molecule densities in this region of the map. b N terminus of the GLP-1 peptide (dark purple) bound to GLP-1 receptor (light blue) at 2.1 Å resolution. Several water molecule densities were identified and modeled inside the binding pocket of the receptor where they facilitate the interaction with the ligand.

References

    1. Danev R, Yanagisawa H, Kikkawa M. Cryo-electron microscopy methodology: current aspects and future directions. Trends Biochem. Sci. 2019;44:837–848. doi: 10.1016/j.tibs.2019.04.008. - DOI - PubMed
    1. Cianfrocco MA, Kellogg EH. What could go wrong? a practical guide to single-particle Cryo-EM: from biochemistry to atomic models. J. Chem. Inf. Model. 2020;60:2458–2469. doi: 10.1021/acs.jcim.9b01178. - DOI - PMC - PubMed
    1. Anderson AC. The process of structure-based drug design. Chem. Biol. 2003;10:787–797. doi: 10.1016/j.chembiol.2003.09.002. - DOI - PubMed
    1. Armstrong, J. D., Hubbard, R. E., Farrell, T. & Maiguashca, B. Structure-based Drug Discovery: An Overview. (Royal Society of Chemistry, 2006).
    1. Tan YZ, et al. Addressing preferred specimen orientation in single-particle cryo-EM through tilting. Nat. Methods. 2017;14:793–796. doi: 10.1038/nmeth.4347. - DOI - PMC - PubMed

Publication types

MeSH terms