. 2021 Jul 15;4(1):846.
doi: 10.1038/s42003-021-02372-y.

Function-adaptive clustered nanoparticles reverse Streptococcus mutans dental biofilm and maintain microbiota balance

Affiliations

Function-adaptive clustered nanoparticles reverse Streptococcus mutans dental biofilm and maintain microbiota balance

Fatemeh Ostadhossein et al. Commun Biol. .

Abstract

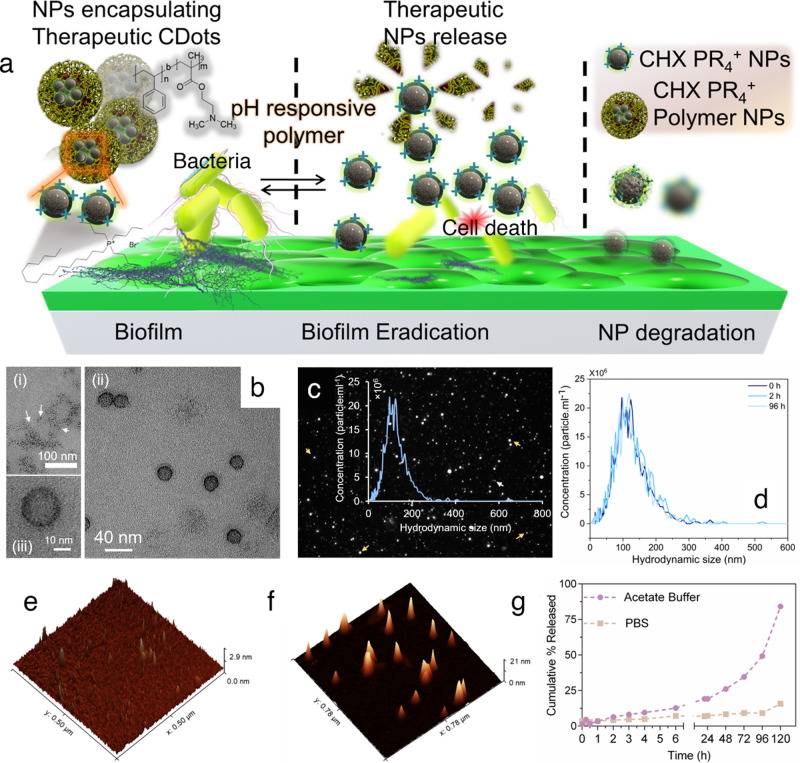
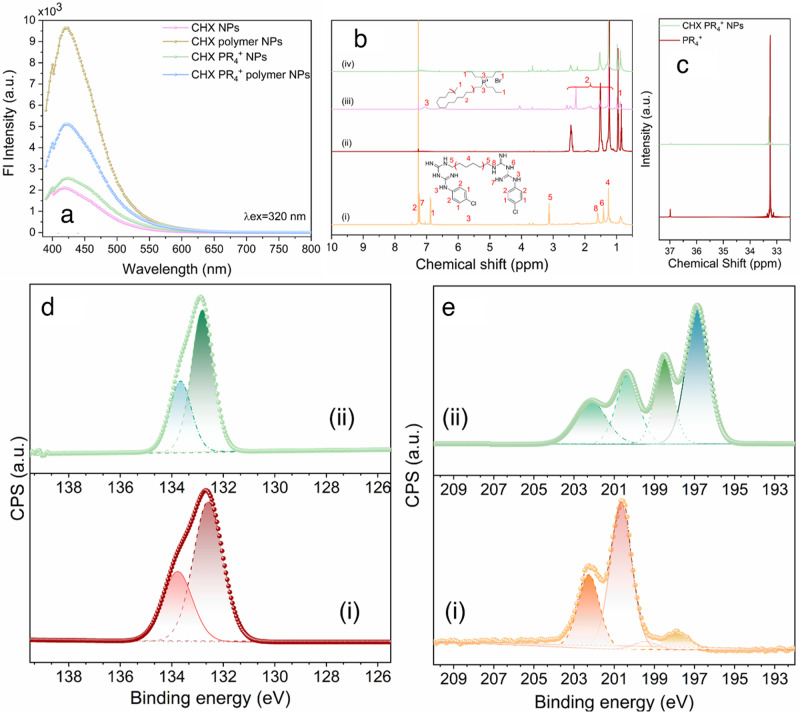
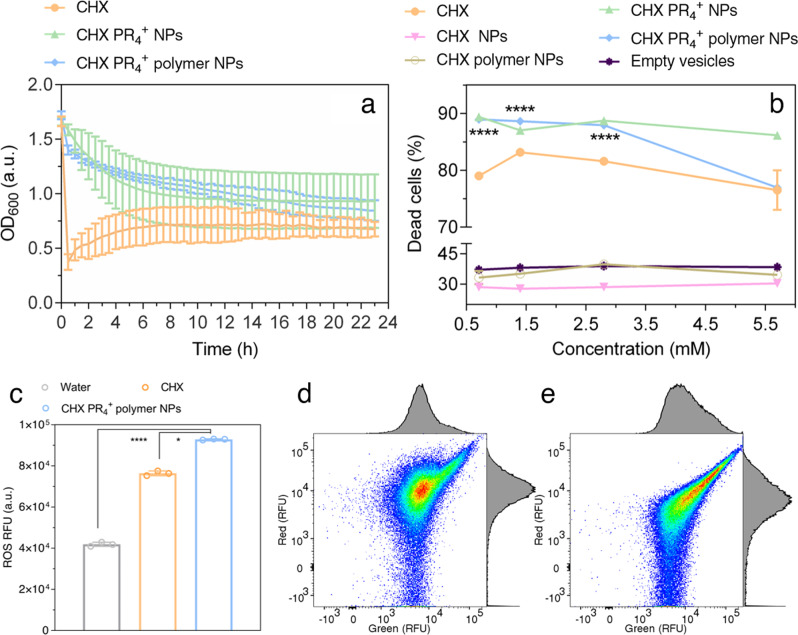
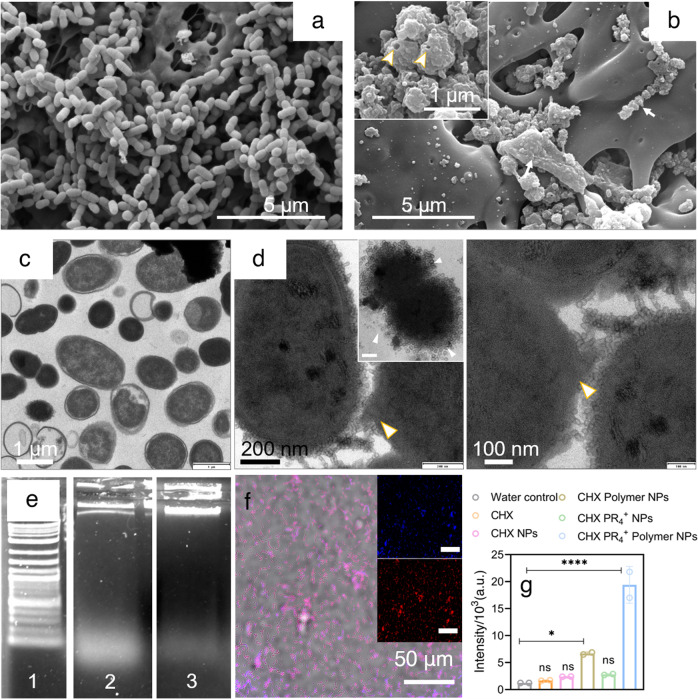
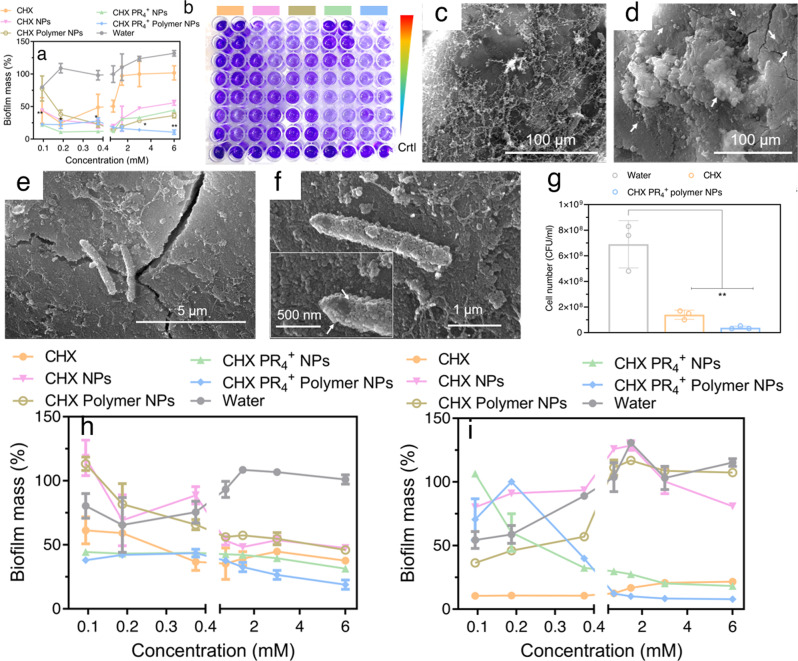
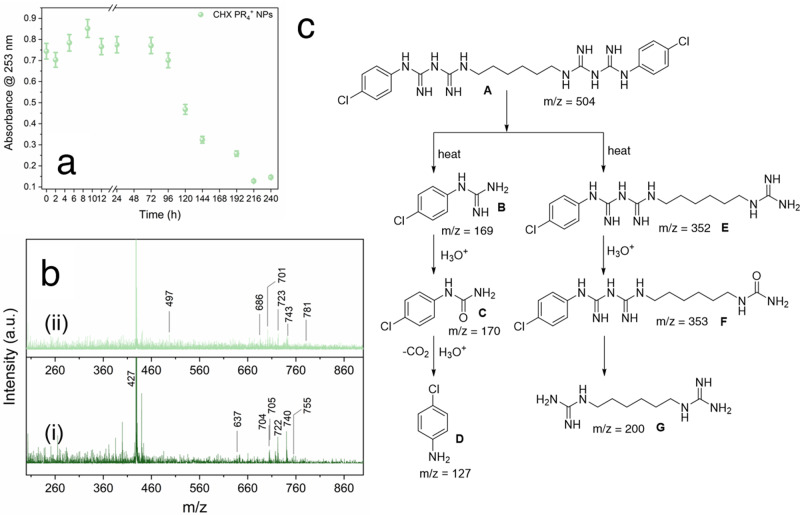
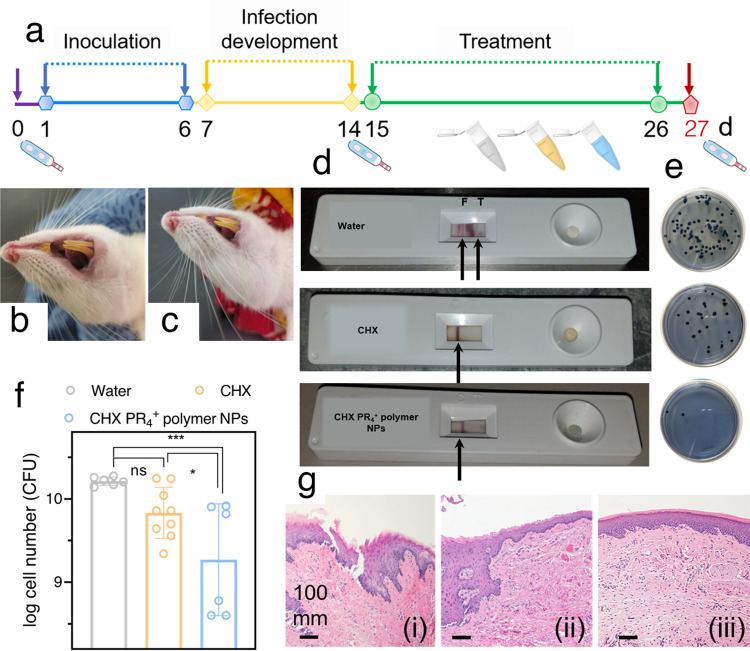
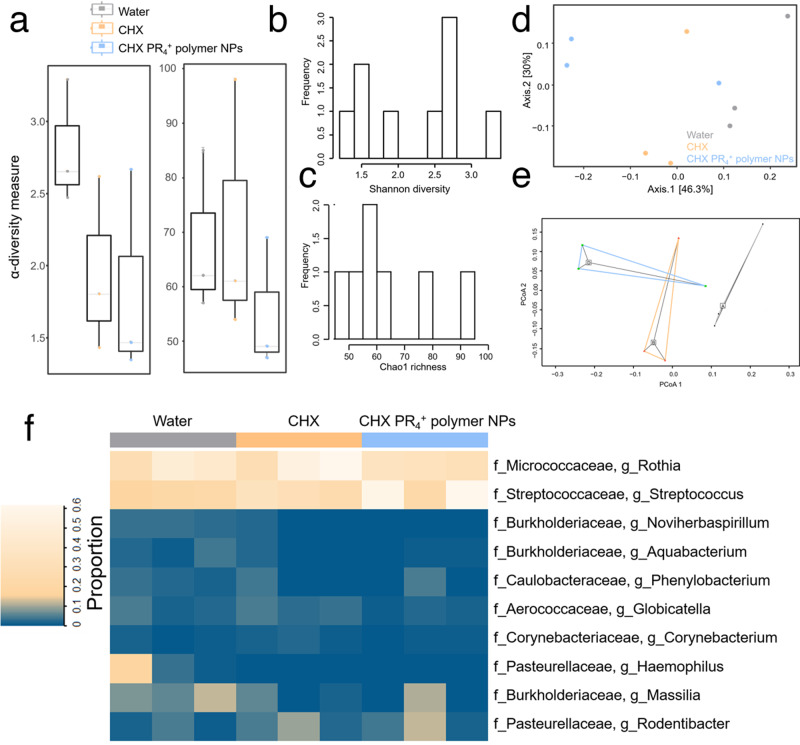
Dental plaques are biofilms that cause dental caries by demineralization with acidogenic bacteria. These bacteria reside inside a protective sheath which makes any curative treatment challenging. We propose an antibiotic-free strategy to disrupt the biofilm by engineered clustered carbon dot nanoparticles that function in the acidic environment of the biofilms. In vitro and ex vivo studies on the mature biofilms of Streptococcus mutans revealed >90% biofilm inhibition associated with the contact-mediated interaction of nanoparticles with the bacterial membrane, excessive reactive oxygen species generation, and DNA fragmentation. An in vivo examination showed that these nanoparticles could effectively suppress the growth of S. mutans. Importantly, 16S rRNA analysis of the dental microbiota showed that the diversity and richness of bacterial species did not substantially change with nanoparticle treatment. Overall, this study presents a safe and effective approach to decrease the dental biofilm formation without disrupting the ecological balance of the oral cavity.


Conflict of interest statement

D.P. is the founder or co-founder of three university-based start-ups. None of these entities, however, supported this work. All other authors declare no competing interests.

Figures

Fig. 1
Fig. 1. Design and characterization of nanoparticles.
a Schematic representation of the action of NPs as antibiofilm agents. The inherently antibiofilm CDots functionalized with phosphonium ions were encapsulated in a pH-responsive diblock copolymer. At low pH, the shell will open to release the therapeutic load leading to the eradication of the dental biofilm, the zoomed region represents the wrapping of smaller CDots in the diblock copolymer, the NP degradation is represented as faded particles; b transmission electron microscopic image of (i) bare CHX PR4+ NPs, (ii) and (iii) polymer-wrapped CDots (CHX PR4+ polymer NPs); c Hydrodynamic distribution of CHX PR4+ polymer NPs measured by ZetaView, arrows point to NPs; d hydrodynamic size stability over time; AFM height variation e before and f after wrapping the CHX PR4+ NPs in the polymer; g pH-dependent release profile.
Fig. 2
Fig. 2. Characterization of chemical properties of NPs.
a Fluorescence emission spectra of the NPs with and without polymer wrapping with λexcitation=320nm. The signal from the CDots is preserved and enhanced when wrapped in the polymer shell; b 1H NMR spectra of (i) CHX, (ii) CHX NPs, (iii) PR4+ compound, and (iv) CHX PR4+ NPs and the corresponding assignments; c 31P NMR spectra comparing the phosphonium compound and CHX PR4+ NPs; d XPS spectra in the P-binding region of (i) phosphonium compound (PR4+) and (ii) CHX PR4+ NPs, which showed similar peaks; e XPS spectra in the Cl-binding region for (i) chlorhexidine (CHX) and (ii) CHX PR4+ NPs, which showed noticeable changes in the chemical binding.
Fig. 3
Fig. 3. The efficacy of NPs against the planktonic form of S. mutans.
a Turbidity time-kill assay for CHX, CHX PR4+ NPs, and CHX PR4+ polymer NPs showing a decreasing trend (n = 3); b the quantitative live–dead fluorescence assay for various formulations, n = 3, two-way ANOVA vs. CHX, p value < 0.0001 is indicated with ****; c ROS assay comparing the fluorescence intensities after the treatment with various formulations, ordinary one-way ANOVA, n = 3, p values < 0.1 and 0.001 are indicated by * and ****, respectively ; Error bar represents mean ± SD; d, e membrane potential measurements are determined by the ratio of red: green fluorescence in flow cytometry. The ratiometric parameters were 467 for d control and 204 for e treatment with CHX PR4+ polymer NPs.
Fig. 4
Fig. 4. Antibacterial mechanism governing cell death.
SEM images of planktonic S. mutans treated with a water and b CHX PR4+ polymer NPs with noticeable damage to the membrane and loss of cell morphology; arrows indicate the NPs attached to the bacterial membrane; TEM images of c control, water-treated, and d CHX PR4+ polymer NP-treated S. mutans. The arrow indicates the damaged membrane, and the arrow in the inset figure indicates the NPs on the bacterial outer membrane; e downstream damage to S. mutans as a result of treatment with NPs as investigated with a DNA gel electrophoresis assay, 1: ladder, 2: CHX, and 3: CHX PR4+ polymer NP treatment; f confocal images from a TUNEL assay of CHX PR4+ polymer NP treatment, scale bar 50 μm. All the scale bars are 50 µm. Blue is the nuclear stain, and red indicates the TUNEL-positive cells. g The TUNEL assay red channel intensity as measured by plate reader. Ordinary one-way ANOVA w.r.t. water, p values < 0.1 and 0.0001 are indicated by * and ****, respectively. Error bar represents mean ± SD.
Fig. 5
Fig. 5. Antibiofilm properties of CHX PR4+ polymer NPs against mature biofilms (48-h old).
Biofilm a dispersion and b the corresponding plate digital photographs of the wells; the top-most well is the control with the colors on the top representing sample ID, the wedge gradient indicates decreasing concentrations. Here, two-way ANOVA was performed, and p values < 0.1, and 0.01 are indicated by * and **, respectively. Biofilm and EPS inhibition for biofilms grown on human tooth c control (water-treated) and d NP-treated samples. The images were acquired at the same magnification; e few surviving bacteria in the treated sample and f the attachment of the NPs to the bacteria are represented in the higher magnification and pointed by arrows; g the colony count assay from experiment (g), n = 3, ordinary one-way ANOVA, p value < 0.01 is indicated with **, biofilm h dispersion and i inhibition as measured by the fluorescent resazurin assay. Error bar represents mean ± SD.
Fig. 6
Fig. 6. Biodegradation of CHX PR4+ NPs in artificial saliva tracked for consecutive 10 days.
a The measured absorbance of CHX PR4+ NPs at 253 nm; b mass spectra of (i) CHX PR4+ NPs in saliva and (ii) degraded CHX PR4+ NPs; c the proposed scheme for the degradation pathway concluded from the mass spectrometry results.
Fig. 7
Fig. 7. The in vivo efficacy of the NPs in a rat model of the dental biofilm.
a Timeline of the in vivo animal treatment, the treatments (water, CHX, and CHX PR4+ polymer NPs) are represented in the centrifuge tubes; the dental hygiene in the animal model b before treatment and c after treatment with NPs; d the outcomes of the in vivo S. mutans detection kit; the results were positive for the water-treated group and negative for CHX- and CHX PR4+ polymer NP-treated groups; e the cultivable bacteria collected from the harvested animals’ teeth. Bacitracin-modified mitis salivarius agar plates, which can specifically grow S. mutans, have been employed here. f The collective results from the plate count assay of the cultivable bacteria after obtaining their jaws (n = 3 biological replicates); ordinary one-way ANOVA, p value < 0.1 and 0.001 are indicated by * and ***, respectively. Error bar represents mean ± SD. g H&E histological analyses of gingiva for (i) control, (ii) CHX, and (iii) CHX PR4+ polymer NP groups. The scale bars are all indicating 100 nm.
Fig. 8
Fig. 8. The assessment of the oral microflora of the rats (n = 3 per group) treated with various formulations.
a Shannon α-diversity index and Chao 1 richness index for different groups; b Shannon α-diversity index and c Chao 1 richness normal distribution test; d PCA ordination plot of the oral microbiota in various groups, where the distance between each point indicates the difference between those samples; e Bray–Curtis principal coordinate analysis (PCoA), which indicates the β-diversity in each group; the analysis revealed that there are no significant differences among the groups based on their Bray–Curtis distances, and the PERMANOVA and ANOSIM tests have p value > 0.05 and in both cases; f the heatmap indicates the bacterial taxa found in all samples according to treatment type, and there are no significant differences in the proportions of each genus among the groups.

References

    1. Koo H, Allan RN, Howlin RP, Stoodley P, Hall-Stoodley L. Targeting microbial biofilms: current and prospective therapeutic strategies. Nat. Rev. Microbiol. 2017;15:740. - PMC - PubMed
    1. Kolenbrander PE, Palmer RJ, Periasamy S, Jakubovics NS. Oral multispecies biofilm development and the key role of cell–cell distance. Nat. Rev. Microbiol. 2010;8:471–480. - PubMed
    1. Flemming H-C, et al. Biofilms: an emergent form of bacterial life. Nat. Rev. Microbiol. 2016;14:563. - PubMed
    1. Pitts NB, et al. Dental caries. Nat. Rev. Dis. Prim. 2017;3:17030. - PubMed
    1. Batoni G, Maisetta G, Esin S. Antimicrobial peptides and their interaction with biofilms of medically relevant bacteria. Biochim. Biophys. Acta. 2016;1858:1044–1060. - PubMed

Publication types

MeSH terms