. 2021 Aug;7(8):1026-1036.
doi: 10.1038/s41477-021-00963-5. Epub 2021 Jul 15.

The Taxus genome provides insights into paclitaxel biosynthesis

Affiliations

The Taxus genome provides insights into paclitaxel biosynthesis

Xingyao Xiong et al. Nat Plants. 2021 Aug.

Abstract

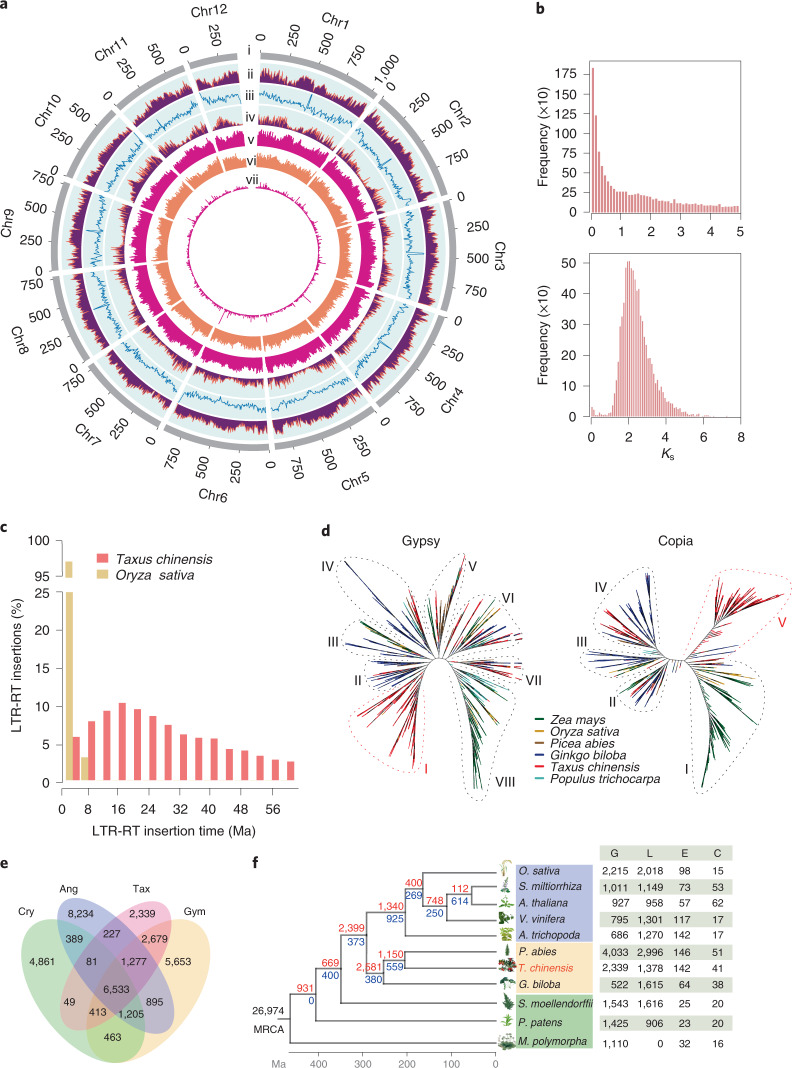
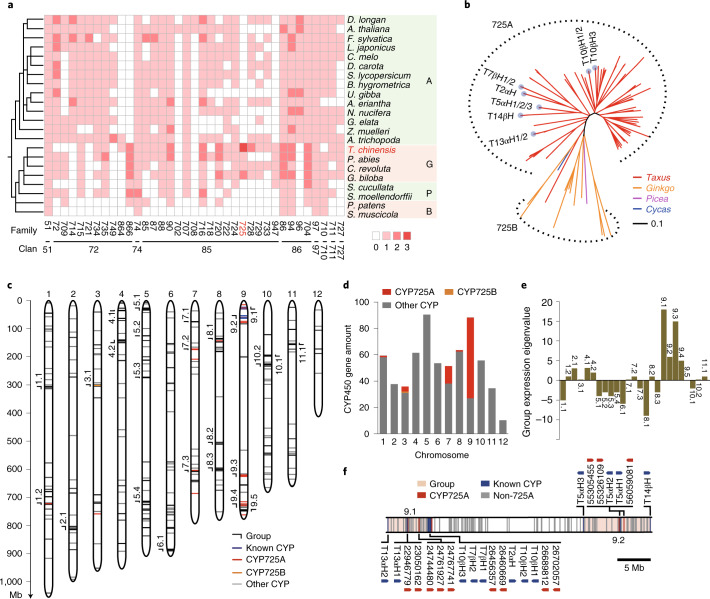
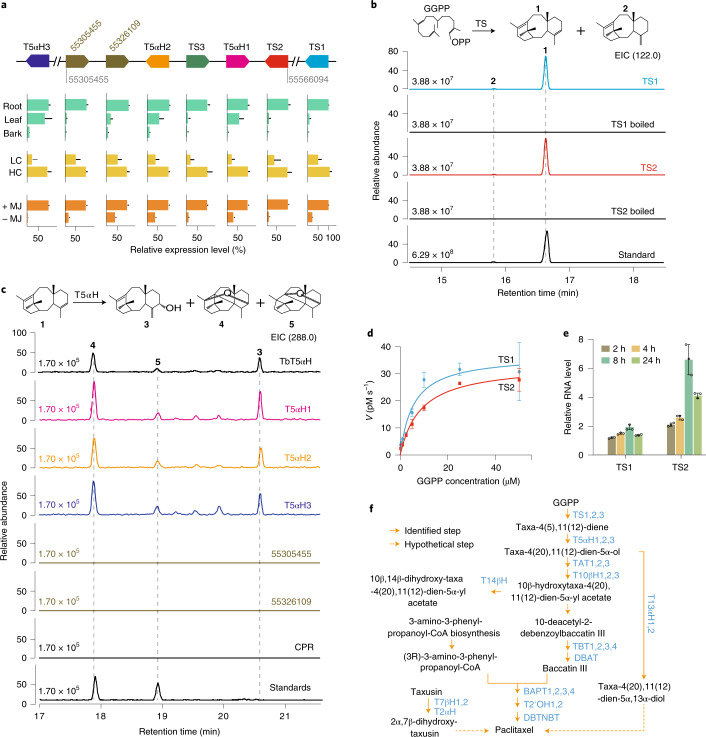
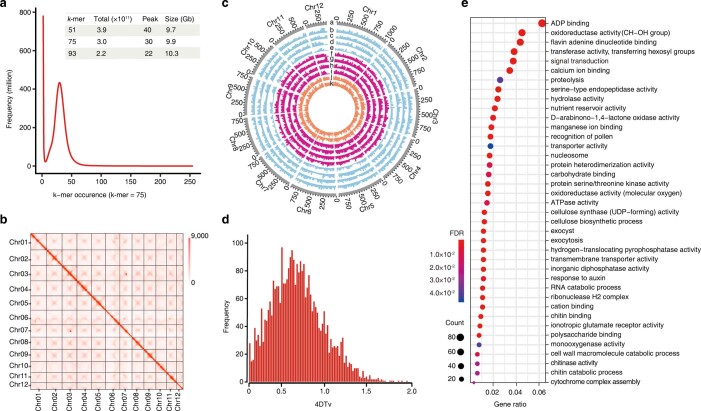
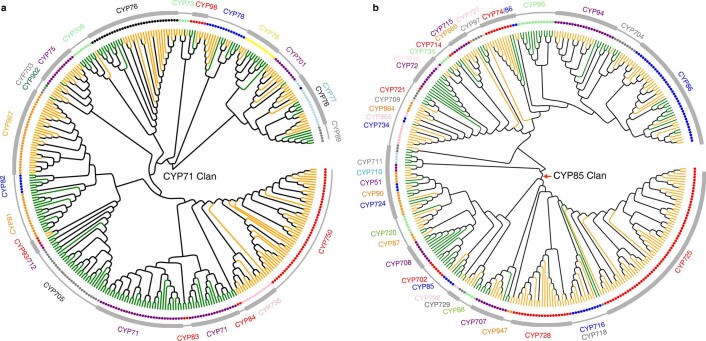
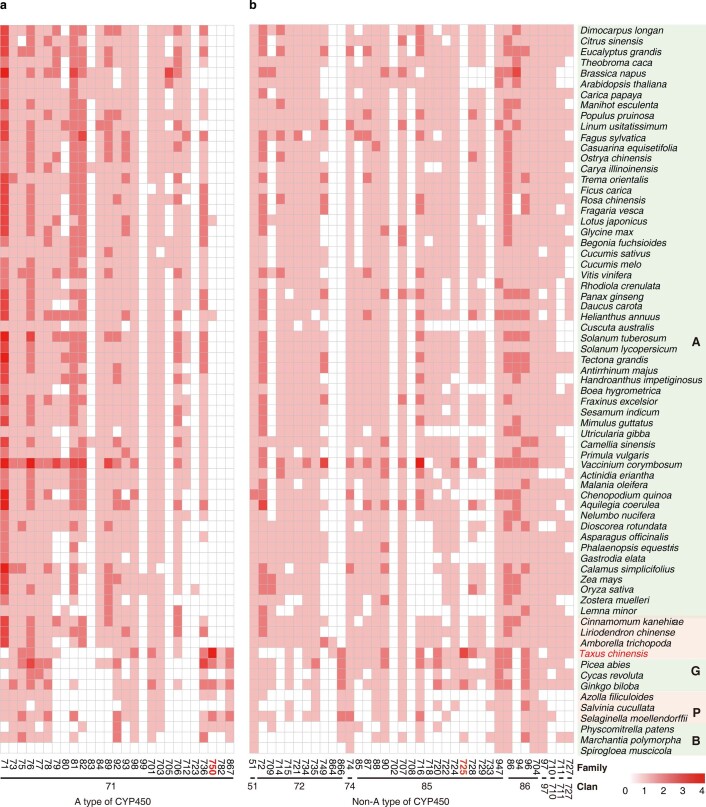
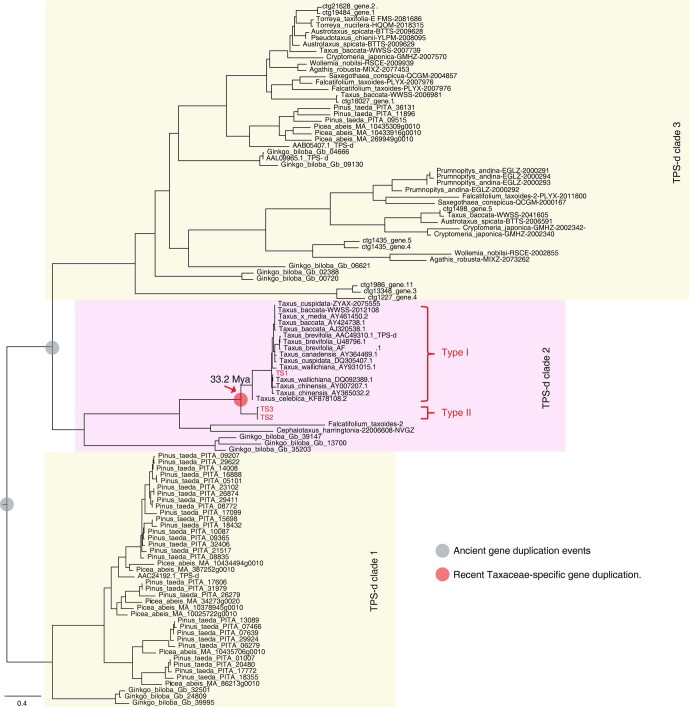
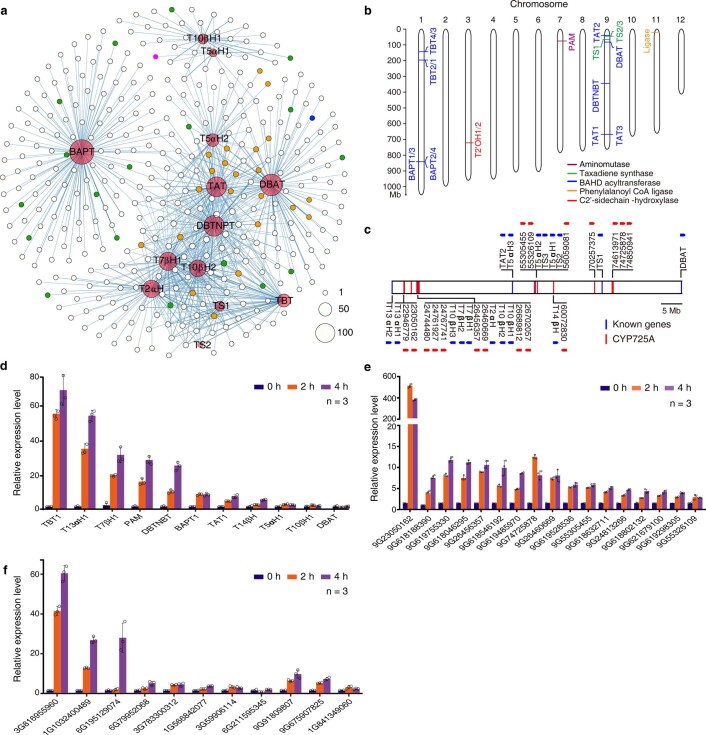
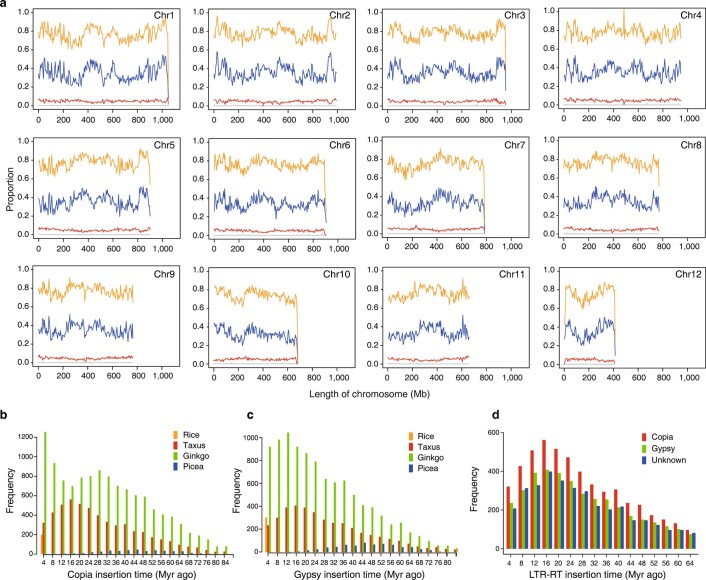
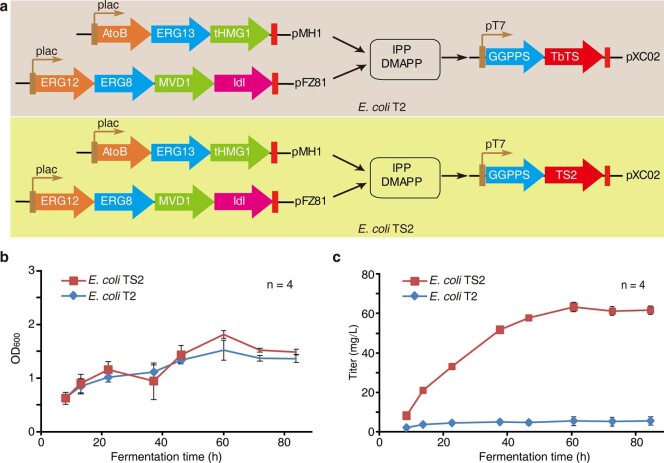
The ancient gymnosperm genus Taxus is the exclusive source of the anticancer drug paclitaxel, yet no reference genome sequences are available for comprehensively elucidating the paclitaxel biosynthesis pathway. We have completed a chromosome-level genome of Taxus chinensis var. mairei with a total length of 10.23 gigabases. Taxus shared an ancestral whole-genome duplication with the coniferophyte lineage and underwent distinct transposon evolution. We discovered a unique physical and functional grouping of CYP725As (cytochrome P450) in the Taxus genome for paclitaxel biosynthesis. We also identified a gene cluster for taxadiene biosynthesis, which was formed mainly by gene duplications. This study will facilitate the elucidation of paclitaxel biosynthesis and unleash the biotechnological potential of Taxus.


Conflict of interest statement

The authors declare no competing interests.

Figures

Fig. 1
Fig. 1. Genomic features of T. chinensis var. mairei.
a, Genomic landscape of the 12 assembled pseudochromosomes. Track i represents the length of the pseudochromosomes (Mb); ii–iv represent repeat element density, GC content and distribution of gene density, respectively; and v–vii show the distribution of Ty3/Gypsy, Ty1/Copia and unknown LTRs, respectively. These metrics are calculated in 5 Mb windows. b, WGD analysis based on the substitution rate distribution of paralogues. Top, histogram of the Ks distribution from Taxus paralogues based on an all-to-all blast to total genes. Bottom, Ks distribution of paralogues based on syntenic analysis. The Ks values were calculated using the YN model in KaKs_calculator. c, Expansions and diverse sets of LTR elements in the Taxus genome. The histogram shows distributions of insertion times calculated for LTRs in Taxus and rice, using mutation rates (per base year) of 7.3 × 10−10 for Taxus and 1.8 × 10−8 for rice. The LTR-retrotransposon (LTR-RT) insertions of T. chinensis var. mairei and Oryza sativa are shown as columns in different colours. d, Heuristic maximum likelihood trees of Ty3/Gypsy (shown as Gypsy) and Ty1/Copia (shown as Copia) from six plant species. The two trees were constructed from amino acid sequence similarities within the reverse transcriptase domains of Gypsy and Copia from six plant species. Gypsy elements are divided into eight families (I–VIII), and Copia contains five families (I–V). The representative plants are shown as coloured lines. e, Venn diagram for orthologous protein-coding gene clusters in cryptogam (Cry), angiosperm (Ang), gymnosperm (Gym) and T. chinensis var. mairei (Tax). The cryptogams include M. polymorpha, Physcomitrella patens subsp. patens and Selaginella moellendorffii. The angiosperms include Amborella trichopoda, V. vinifera, Arabidopsis thaliana, Salvia miltiorrhiza and O. sativa. The gymnosperms include Picea abies and Ginkgo biloba. The number in each sector of the diagram represents the total number of genes across the four comparisons. f, Evolution analysis of gene families in Taxus and selected plants. The red numbers on the branches of the phylogenetic tree indicate the number of expanded gene families, and the blue numbers refer to the number of constricted gene families. The supposed most recent common ancestor (MRCA) contains 26,974 gene families. G, L, E and C in the table at right represent the number of gains, losses, expansions and constrictions in the gene families among 11 plant species.
Fig. 2
Fig. 2. Evolution and genomic architecture of Taxus CYP450s.
a, Phylogenomic analysis of the non-A-type CYP450s in the representative plant species. A, angiosperms; G, gymnosperms; P, pteridophytes; B, bryophytes. The colour of each block is based on the number of genes in each family, and 0, 1, 2 and 3 indicate that this number ranges from 0, 1–10, 10–50 and 50–100 genes, respectively. b, Phylogenetic analysis of the CYP725 subfamily in T. chinensis var. mairei (Taxus), Ginkgo biloba (Ginkgo), Picea abies (Picea) and C. revolute (Cycas). The dotted outline shows the gene spheres of the CYP725A and CYP725B subfamilies. The light blue dots on the ends of the phylogenetic branches represent the known paclitaxel pathway CYP725A genes and their homologues. The neighbour-joining tree was constructed by Interactive Tree Of Life (iTOL) software. The evolutionary distances were analysed by the p-distance method, and the branch lengths were scaled by the bar. c, Distribution of CYP450 genes on the 12 pseudochromosomes in Taxus. Each short line on the pseudochromosomes represents a CYP450 gene. CYP725As, CYP725Bs and the other CYP450s are marked by red, orange and grey lines, respectively. The known CYP450s in the paclitaxel biosynthesis pathway (known CYP) are shown in blue. The CYP450 groups (≥7 CYP450 genes and ≤5.26 Mb of gene spacing between two adjacent CYP450s) are labelled outside of the corresponding positions on the pseudochromosomes. d, Histogram of the number of CYP450 genes on each pseudochromosome. The CYP725 genes (shown in red and orange) were mainly distributed on pseudochromosome 9, while the other CYPs (shown in grey) were distributed randomly on 12 pseudochromosomes. The y axis represents the number of CYP450 genes. e, Group-based gene expression profiles in response to methyl jasmonate (MeJA) treatment. RNA sequencing analysis was performed with the low-paclitaxel-yielding cell line (LC) treated with 100 μM MeJA for 4 h. The expression of the gene group was calculated by the sum of the expression levels of each CYP450, and each upregulated and downregulated CYP450 was calculated as 1 and −1, respectively, on the basis of their reads per kilobase per million reads values. f, Map of CYP725As located in groups 9.1 and 9.2. The ranges of the gene groups on pseudochromosome 9 are marked in pink. CYP725As and the other genes are marked by red and grey vertical lines, respectively. The known CYP450s in the paclitaxel biosynthesis pathway (known CYP) are shown in blue. The arrows show gene orientations.
Fig. 3
Fig. 3. Functional identification of the paclitaxel biosynthesis gene cluster.
a, Genomic architecture and expression pattern of the taxadiene cluster. The arrows indicate the relative positions and directions of the genes in the cluster. Here, 55305455 and 55566094 indicate the starting and ending positions of the cluster on pseudochromosome 9. The two unknown CYP725A genes are represented by their gene starting positions (55326109 and 55305455). TS1 and T5αH3 are located at 72105619–72109598 and 49866845–49868629 bp on chromosome 9, respectively. The relative expression levels of taxadiene cluster genes in Taxus are based on their reads per kilobase per million reads values. The expression levels of genes with high sequence similarity were distinguished on the basis of sequencing read counts of the exons that include different bases, and adjusting the alignment threshold to no mismatch. RNA-seq datasets are from roots, leaves and bark of male plants (shown in green); two T. chinensis var. mairei half-sib cell lines, HC and LC (shown in yellow); and MeJA-treated LC (+MJ) and MeJA-untreated LC (−MJ) (shown in orange). The data are shown as means ± s.d. (n = 3 biologically independent samples). b, Analysis of TS activity in vitro. The purified recombinant TS1-His and TS2-His were incubated with the substrate GGPP overnight at 32 °C. The reaction products were analysed by GC–MS. TS catalyses GGPP to produce a major product (taxa-4(5),11(12)-diene (1)) and a minor product (taxa-4(20),11(12)-diene (2)), while boiled TSs have no TS activity. m/z 122 is a characteristic ion of taxadienes. The taxadiene confirmed by NMR analysis was used as a reference standard (Standard). EIC, extracted ion chromatograms; OPP, pyrophosphoric acid. c, Analysis of the activity of T5αH and two unknown CYP725As in vitro. The in vitro enzyme assay was carried out with the purified taxadiene substrate and yeast microsomes, each including one of the six CYPs (T5αH1, T5αH2, T5αH3, TbT5αH, 55326109 or 55305455) and CPR. T5αH1/2/3 can produce three oxygenated taxadiene products (5(12)-oxa-3(11)-cyclotaxane (3), 5(11)-oxa-3(11)-cyclotaxane (4) and taxa-4(20),11(12)-dien-5α-ol (5)), whereas no catalytic compounds were observed for 55326109, 55305455 and CPR. T. brevifolia taxadiene 5-α-hydroxylase (TbT5αH), shown to have taxadiene 5-α-hydroxylase activity, was used as a positive control. d, Kinetic evaluation of GGPP oxidation catalysed by TS1 (blue circles) and TS2 (red rectangles). The x axis indicates the substrate GGPP concentration, while the y axis shows the velocity (V) of enzymatic reaction. Km = 5.5 ± 1.6 μM (TS1), Km = 8.6 ± 1.5 μM (TS2), kcat = 1705 s−1 (TS1) and kcat = 3282 s−1 (TS2). The data are shown as means ± s.d. (n = 3 biologically independent samples). e, Quantitative real-time PCR analysis of the transcription levels of TS1 and TS2 in the Taxus cell line LC treated with 100 μM MeJA for the indicated times. The relative gene expression levels are represented as the average fold change (2−ΔΔCt). The Taxus actin 1 gene (7G702435613) was used as an internal reference. The data are shown as means ± s.d. (n = 3 biologically independent samples). f, Biosynthesis pathway of paclitaxel in T. chinensis var. mairei. The solid arrows indicate the identified steps in the paclitaxel pathway, whereas the dashed arrows show the hypothetical steps. The compounds in the pathway are shown in black and the catalytic enzymes are shown in blue. T5αH, taxadiene 5-α-hydroxylase; T13αH, taxane 13-α-hydroxylase; TAT, taxadien-5-α-ol O-acetyltransferase; T10βH, taxane 10-β-hydroxylase; T14βH, taxoid 14-β-hydroxylase; T2αH, taxoid 2-α-hydroxylase; T7βH, taxoid 7-β-hydroxylase; TBT, 2-α-hydroxytaxane 2-O-benzoyltransferase; DBAT, 10-deacetylbaccatinIII 10-O-acetyltransferase; BAPT, baccatin III amino phenylpropanoyl-13-O-transferase; DBTNBT, 3′-N-debenzoyl-2′-deoxytaxol N-benzoyl transferase. Source data
Extended Data Fig. 1
Extended Data Fig. 1. The Taxus genomic features to complement Fig. 1.
a, Genome size estimation of T. chinensis var. mairei based on k-mer distribution. The X-axis represents the occurrence of k-mers, and the Y-axis represents the frequency. The k-mer values for different genome sizes are shown in the inner table. b, Genome-wide all-by-all Hi-C interaction. The heat map shows Hi-C interactions under a resolution of 2 Mb. Darker red pixels indicate higher contact probabilities. The number on the scale bar indicates the number of links after logarithmic analysis. c, Genomic landscape of the twelve pseudochromosomes. Track a represents the length of the pseudochromosomes (Mb); b, c, d, and e show the expression of tissue-specific genes in the bark of stem, root, strobili and leaf from the male Taxus plant, respectively; f, g, h, and i show the expression of tissue-specific genes in the bark of stem, root, strobilus and leaf from the female Taxus plant, respectively; j and k display high- and low- producing paclitaxel cell lines, respectively. d, Whole genome duplication (WGD) analysis based on the substitution rate distribution of paralogs. The 4DTv values of paralogs were calculated using KaKs_calculator with the YN model. The X-axis is the value of fourfold synonymous third-codon transversions (4DTv) for paralogous pairs in the Taxus genome, and the Y-axis represents the frequency. e, Gene Ontology (GO) enrichment for gene families with significant expansion. GO enrichment analysis of a subset of 142 gene families with significant expansion (p < 0.05); FDRs were adjusted for multiple testing. The size and color of dots indicate the number of genes and false discovery rate (FDR), respectively. The X-axis represents the gene ratio, and the GO terms are listed on the Y axis.
Extended Data Fig. 2
Extended Data Fig. 2. Phylogenic analysis of A-type and non-A-type CYP450 families.
a, Phylogenic analysis of A-type CYP450 families. The green and orange branches indicate the sequences from Arabidopsis and T. chinensis var. mairei, respectively. The dots represent CYP450 genes. The outermost circle indicates the CYP450 gene family. b, Phylogenic analysis of non-A-type CYP450 families. The green and orange branches indicate the sequences from Arabidopsis and T. chinensis var. mairei, respectively. The dots represent CYP450 genes. The outermost circle indicates the CYP450 gene family.
Extended Data Fig. 3
Extended Data Fig. 3. Heat map of the number of CYP450 genes in 69 representative plant species.
Each CYP450 gene family of A-type (a) and non-A-type (b) is represented as a square, with the red color representing the number of genes in the corresponding family. The depth of the red color is divided into five levels, namely, 0, 1, 2, 3, and 4, which correspond to 0, 1–10, 10–50, 50–100, and more than 100 genes, respectively. The family or clan name of CYP450 genes is marked below the heat map. A, Angiosperms; G, Gymnosperms; P, Pteridophytes; and B, Bryophytes.
Extended Data Fig. 4
Extended Data Fig. 4. Gene expression in response to MeJA treatment in the Taxus cell line.
Group-based gene expression profiles in response to MeJA treatment. RNA sequencing analysis was performed with the Taxus cell line treated with 100 μM MeJA or 0.5% EtOH solution for 0, 2, 4, and 8 h. The expression of the gene group was calculated by summing the expression levels of each CYP450. Each upregulated and downregulated CYP450 was calculated as 1 and −1, respectively, based on their FPKM (Fragments Per Kilobase of transcript per Million mapped reads) values.
Extended Data Fig. 5
Extended Data Fig. 5. Phylogenetic analysis of trehalose-6-phosphate synthase d subfamily (TPS-d) genes from different plants.
The tree is generated from amino acid sequences by the maximum-likelihood method with 100 bootstraps. Ancient gene duplication events are indicated as gray dots, while the more recent Taxaceae-specific gene duplication is shown as a red dot. The TS1/2/3 genes in T. chinensis var. mairei are highlighted in red.
Extended Data Fig. 6
Extended Data Fig. 6. The characteristic of gene expression and location related to the paclitaxel biosynthesis in T. chinensis var. mairei.
a, Co-expression net of paclitaxel biosynthesis genes. The genes with a Pearson correlation coefficient value above 0.75 are displayed on the net. The known paclitaxel biosynthesis genes, CYP725s, CYP450s, and the remaining genes are represented as red, orange, green, and white dots, respectively. The purple and blue dots show the two novel CYP725A genes, 55305455 and 55326109, respectively. The size of the dot correlates with the gene number. b, Genomic location of the annotated genes known to be involved in paclitaxel biosynthesis, except for CYP450s. The different colors of the short lines indicate the different types of annotated genes and their homologs in the paclitaxel pathway; the short purple, green, blue, orange, and red lines correspond to aminomutase, taxadiene synthase, BAHD acyltransferase, ligase, and C2’-sidechain-hydroxylase. c, Defined genes and 18 novel CYP725As on chromosome 9. The known genes in the paclitaxel biosynthesis pathway (known genes) are marked by blue lines, while the unknown CYP725As are shown in red lines. The arrows show gene orientations. d-f, The relative transcript abundance of the eleven defined paclitaxel biosynthetic genes (d), the sixteen CYP725A candidates (e), and the eight TFs and three BAHD acyltransferase genes (f) in MeJA-induced Taxus cell lines by quantitative real-time PCR (qPCR) analysis. The relative gene expression levels are represented as the average fold change (2-ΔΔCt). The Taxus actin 1 gene (7G702435613) was used as an internal reference. Error bars indicate standard errors from three independent biological replicates. Source data
Extended Data Fig. 7
Extended Data Fig. 7. The LTR features related to Fig. 1.
a, Distribution of repeats and LTR on the chromosomes. The lines indicate different elements (Orange: repeats; Blue: Gypsy; Red, Copia; Grey: Unknown LTR). Each point on the line represents the proportion of the component in the 5 Mb window. b and c, Comparison of distributions of LTR insertion times in different species. The histogram shows the distributions of insertion times calculated for Copia (b) and Gypsy (c) in Taxus, ginkgo, picea, and rice. The different colors of the columns represent the Copia and Gypsy insertions of the four plants. d, Comparison of insertion-time distributions of different LTR elements in the Taxus. The histogram shows the distributions of the insertion times calculated for the Taxus LTR elements (Gypsy, Copia, and an unknown type).
Extended Data Fig. 8
Extended Data Fig. 8. Comparison of the two types of TS on the production of taxadiene in E. coli.
a, Taxadiene-producing E. coli T2 (harboring pMH1, pFZ81, and pXC02) was constructed by coexpressing nine genes (AtoB, ERG13, tHMG1, ERG12, ERG8, MVD1, IdI, GGPPS, and TbTS) in E. coli, while E. coli TS2 was generated by replacing TbTS with TS2 in E. coli T2; b, The cell concentrations of the strains E. coli T2 and TS2 were measured by OD600 at set intervals (at 8, 13, 22, 37, 46, 60, 72 and 84 hours); c, The titers of taxadiene produced by E. coli T2 and TS2 in shaking flasks. TbTS, a T. brevifolia taxadiene synthase that shares 98.42 % amino acid sequence identity with TS1, represents type I TSs, while TS2, sharing 77 % protein sequence identity with TS1, represents type II TSs. Error bars show standard error (n = 4 independent biological replicates).

Comment in

References

    1. Christenhusz M, et al. A new classification and linear sequence of extant gymnosperms. Phytotaxa. 2010;19:55–70. doi: 10.11646/phytotaxa.19.1.3. - DOI
    1. Hao DC, Xiao PG, Huang B, Ge GB, Yang L. Interspecific relationships and origins of Taxaceae and Cephalotaxaceae revealed by partitioned Bayesian analyses of chloroplast and nuclear DNA sequences. Plant Syst. Evol. 2008;276:89–104. doi: 10.1007/s00606-008-0069-0. - DOI
    1. Wani MC, Taylor HL, Wall ME, Coggon P, McPhail AT. Plant antitumor agents. VI. Isolation and structure of Taxol, a novel antileukemic and antitumor agent from Taxus brevifolia. J. Am. Chem. Soc. 1971;93:2325–2327. doi: 10.1021/ja00738a045. - DOI - PubMed
    1. Sabzehzari M, Zeinali M, Naghavi MR. Alternative sources and metabolic engineering of Taxol: advances and future perspectives. Biotechnol. Adv. 2020;43:107569. doi: 10.1016/j.biotechadv.2020.107569. - DOI - PubMed
    1. Nicolaou KC, et al. Total synthesis of Taxol. Nature. 1994;367:630–634. doi: 10.1038/367630a0. - DOI - PubMed