. 2021 Sep;24(9):1256-1269.
doi: 10.1038/s41593-021-00889-3. Epub 2021 Jul 15.

The basal ganglia control the detailed kinematics of learned motor skills

Affiliations

The basal ganglia control the detailed kinematics of learned motor skills

Ashesh K Dhawale et al. Nat Neurosci. 2021 Sep.

Abstract

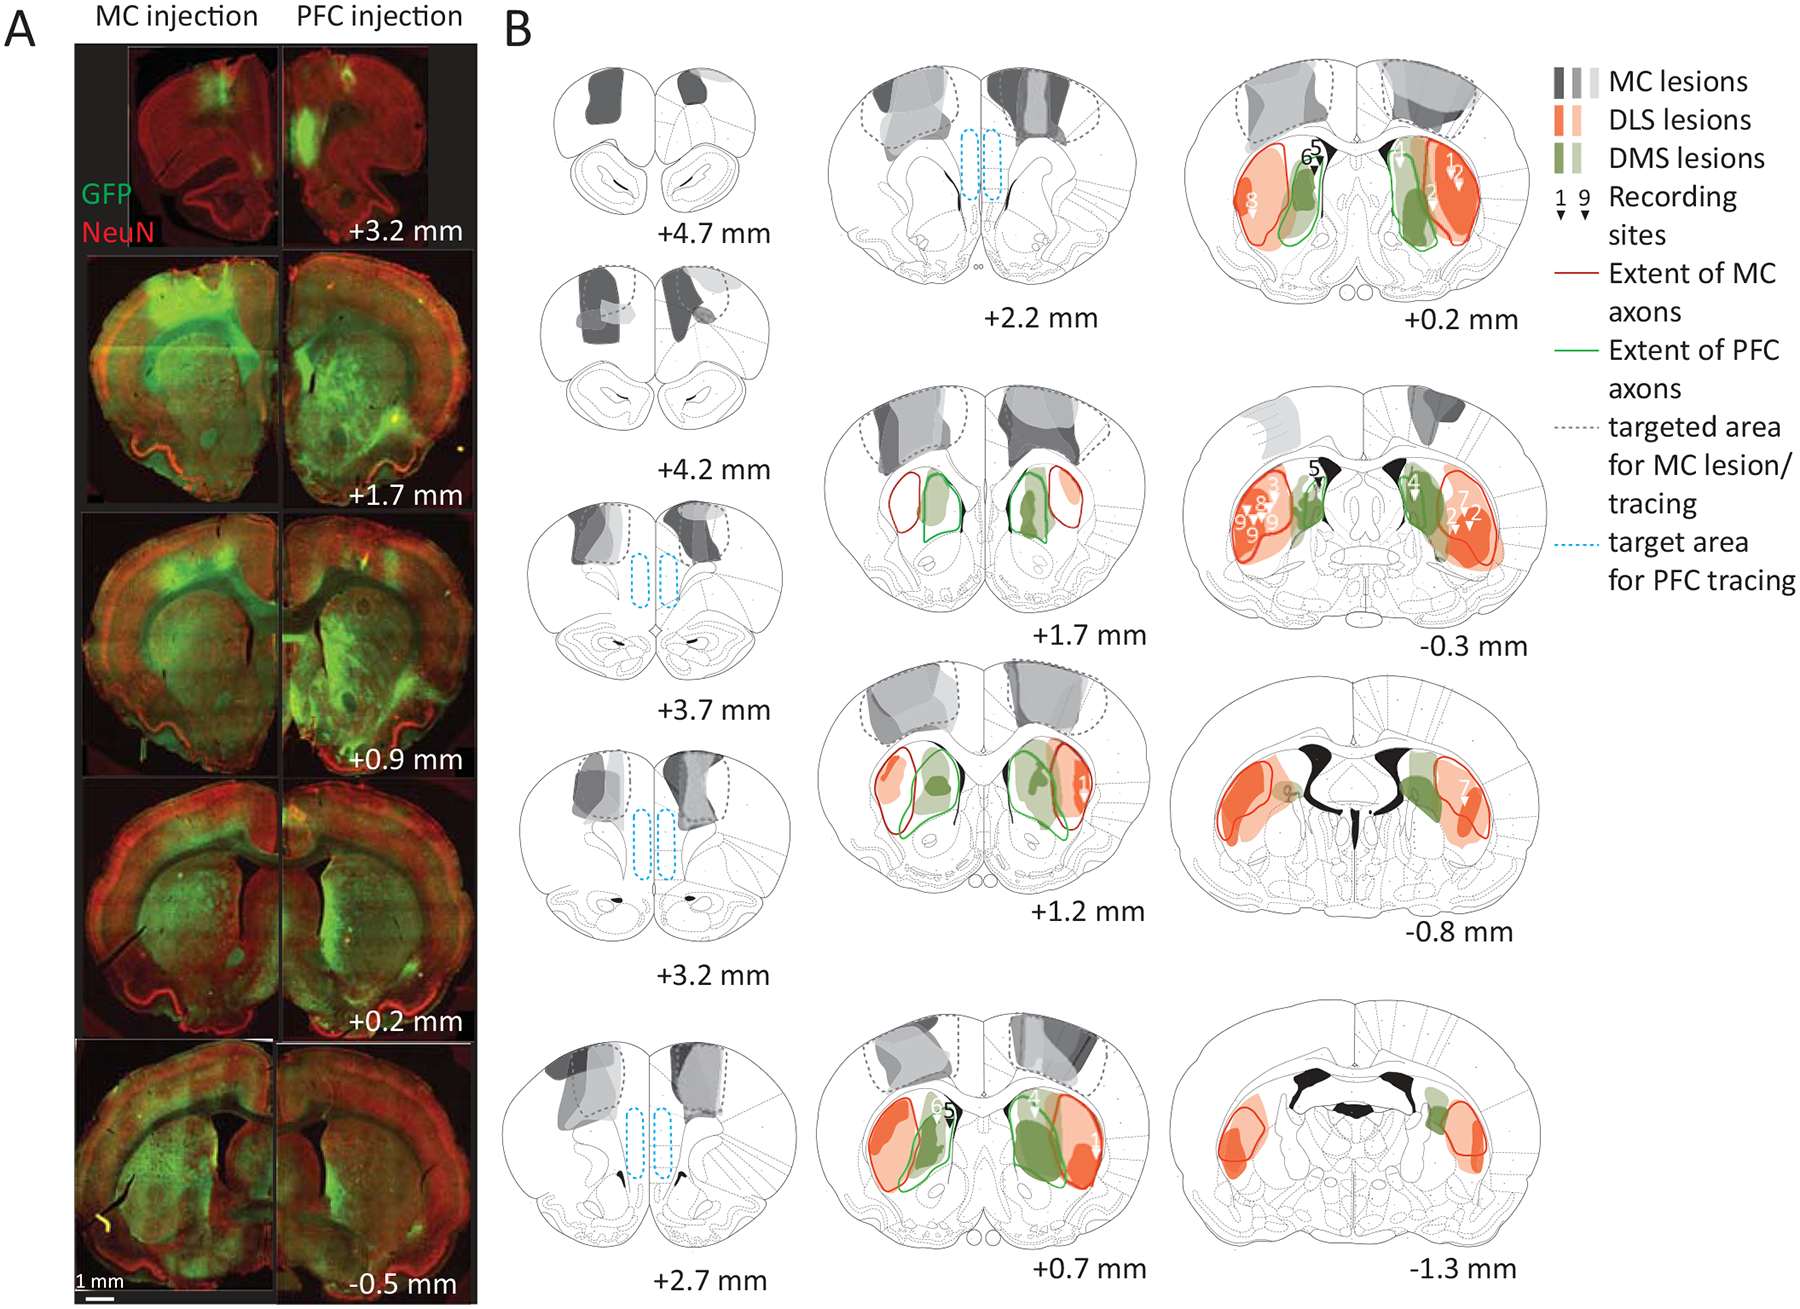
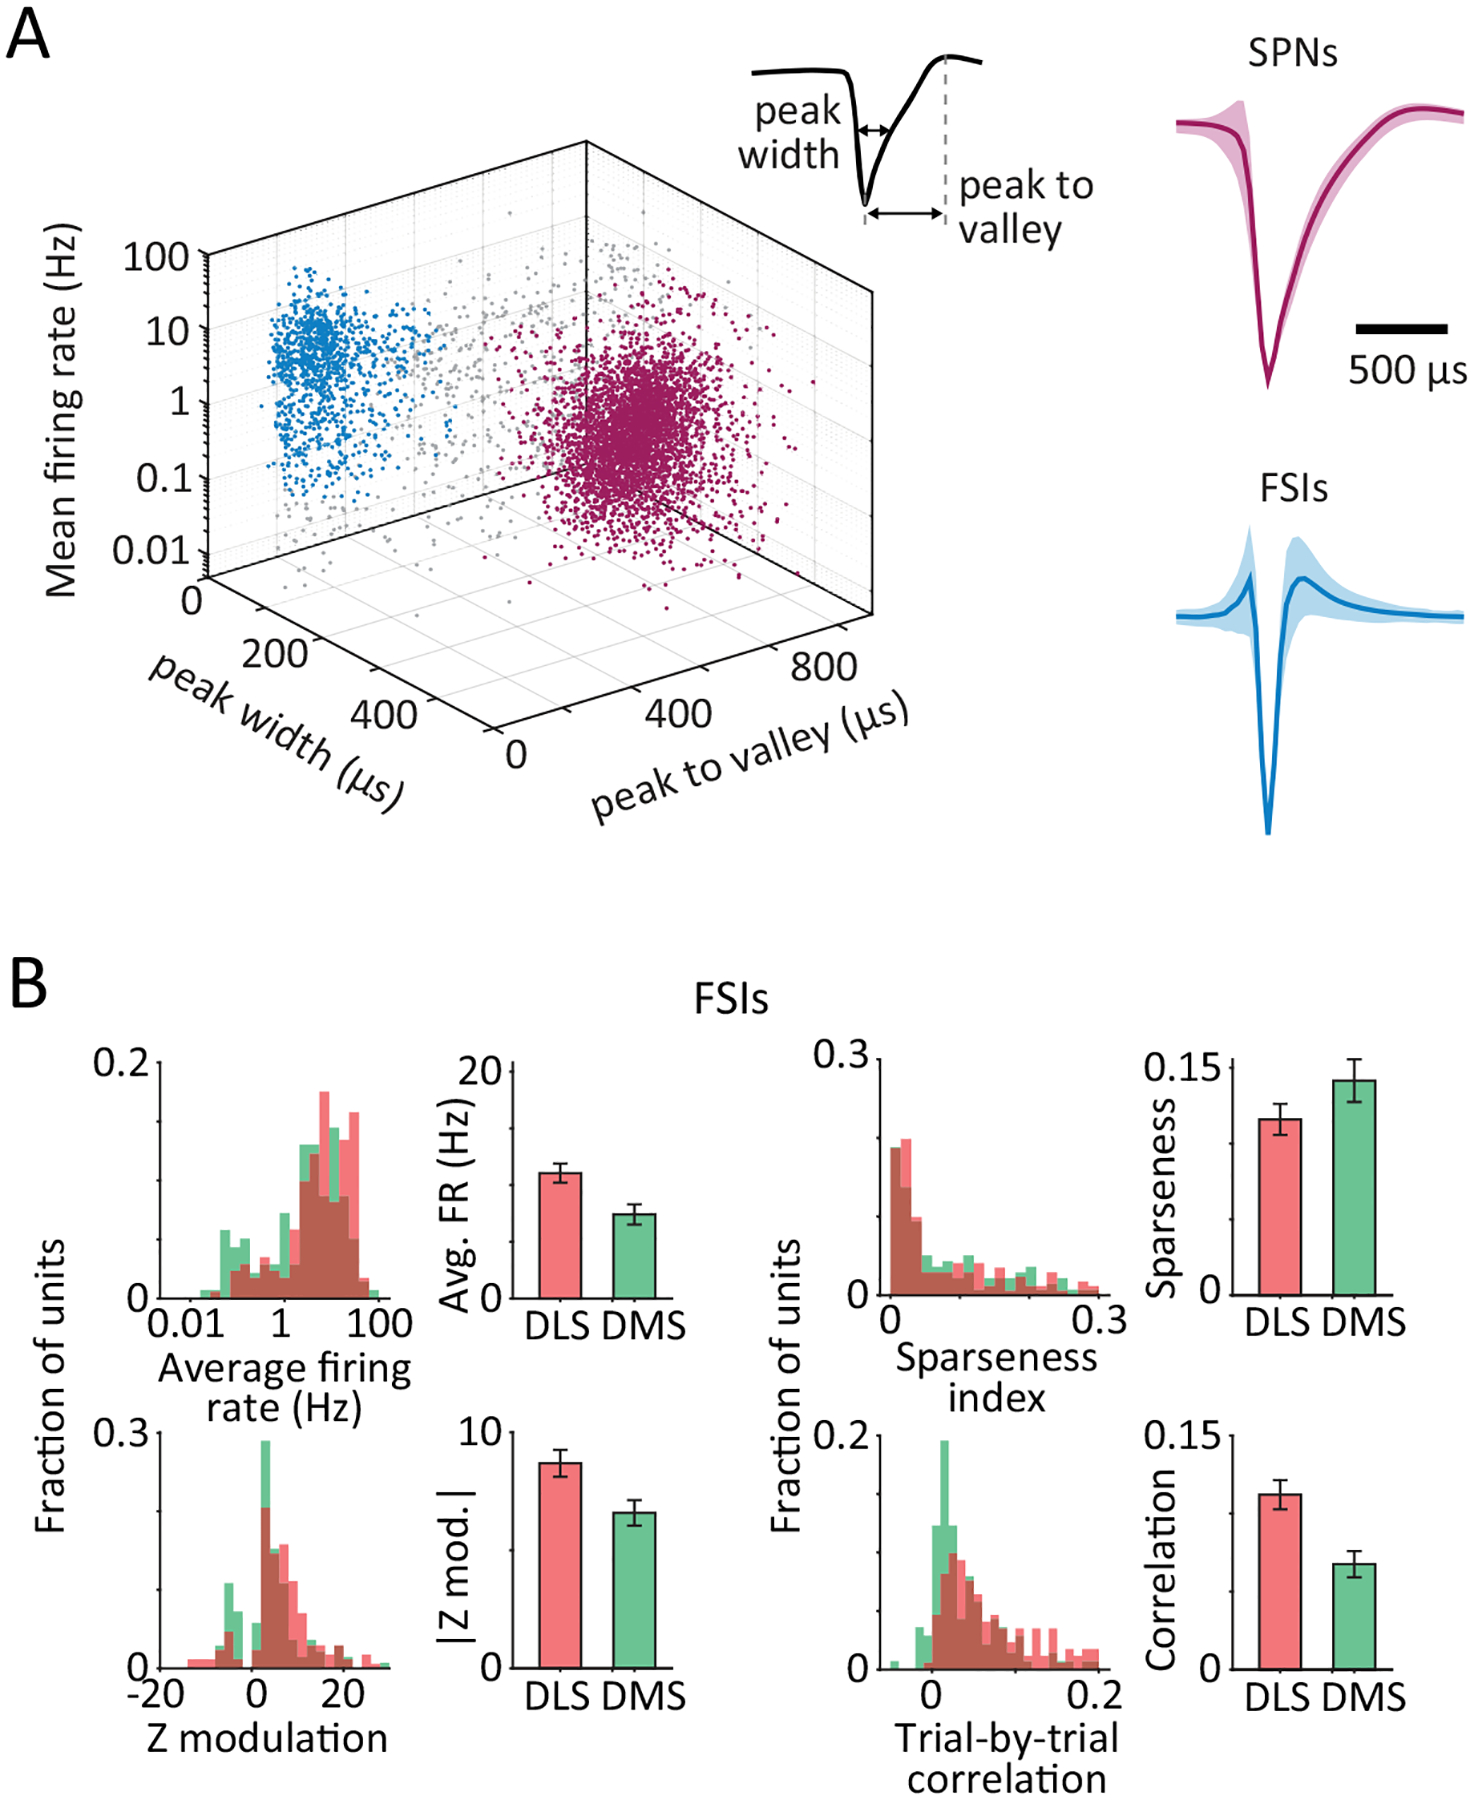
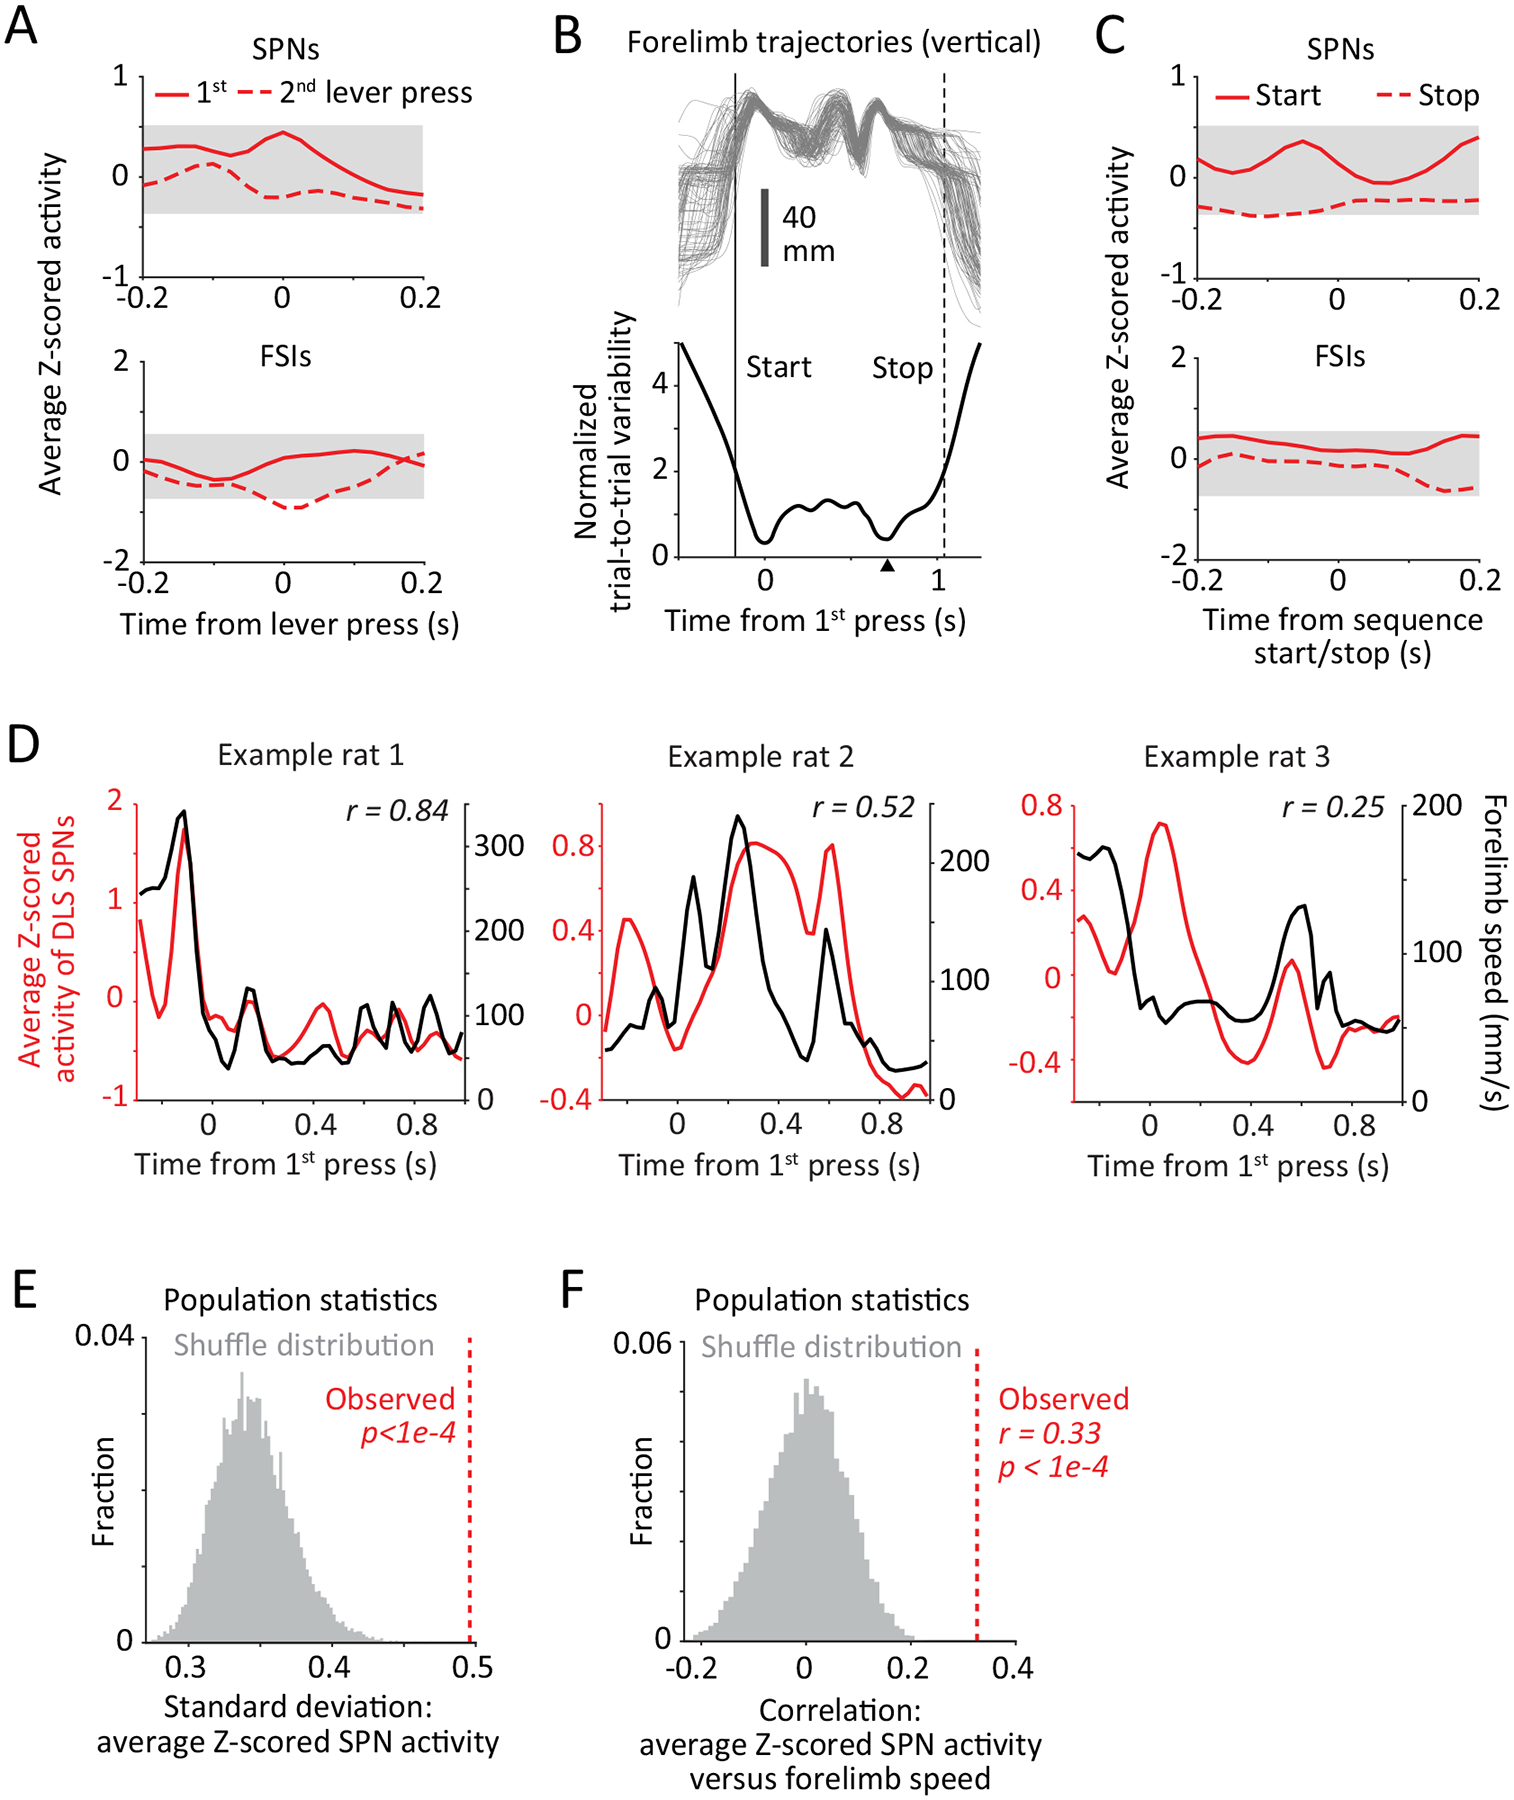
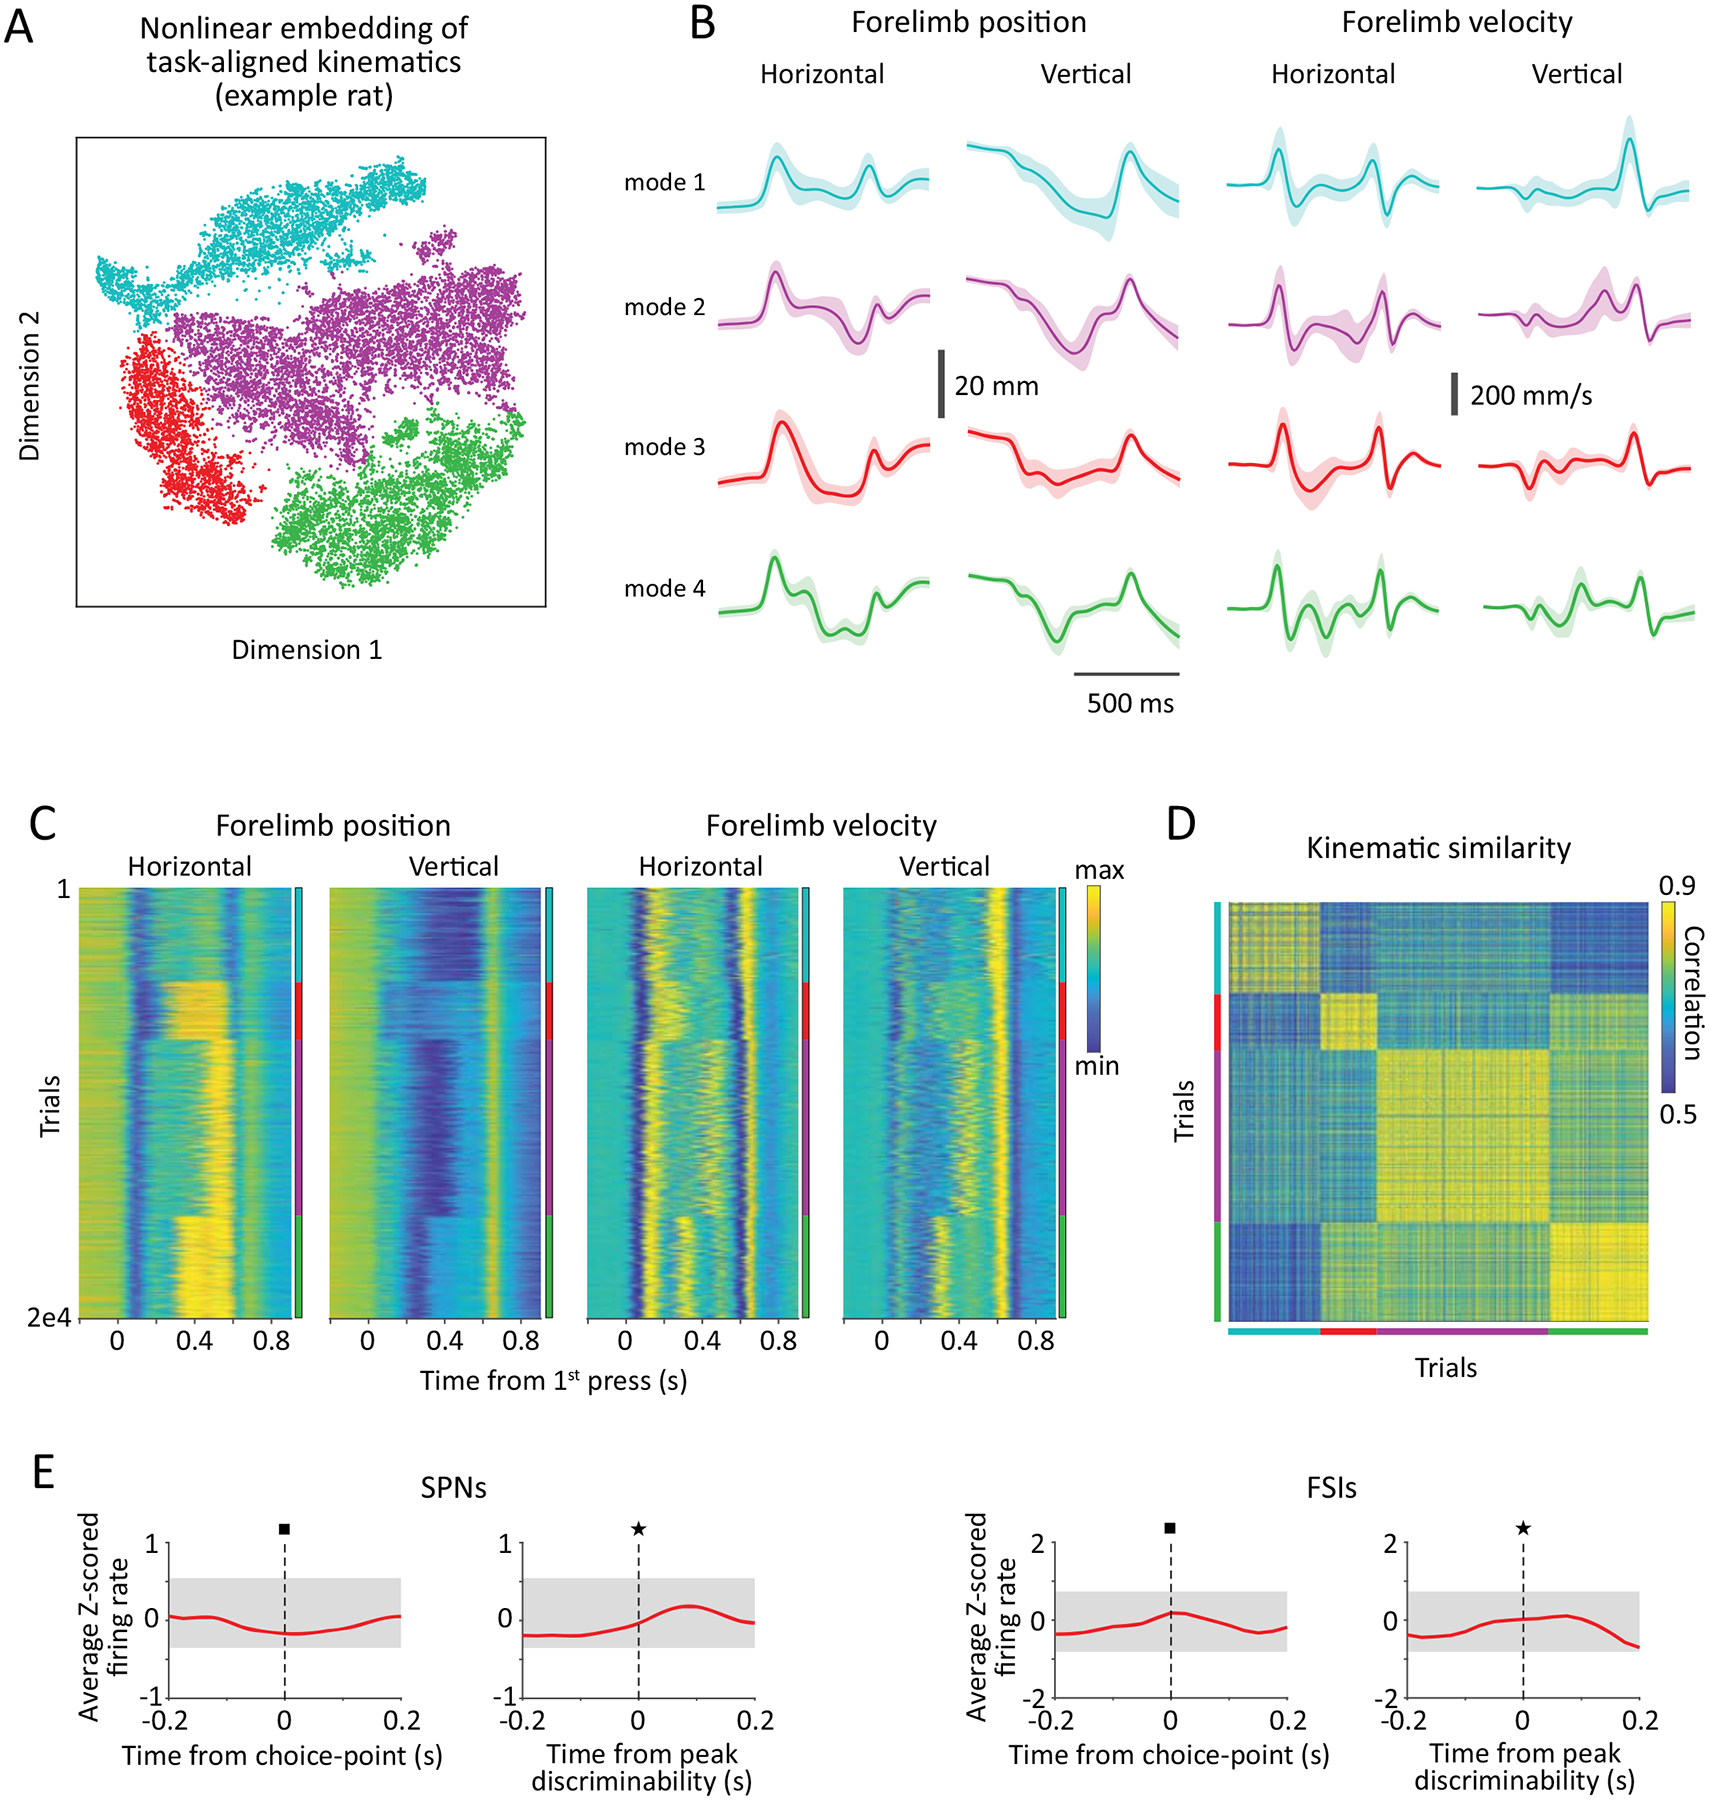
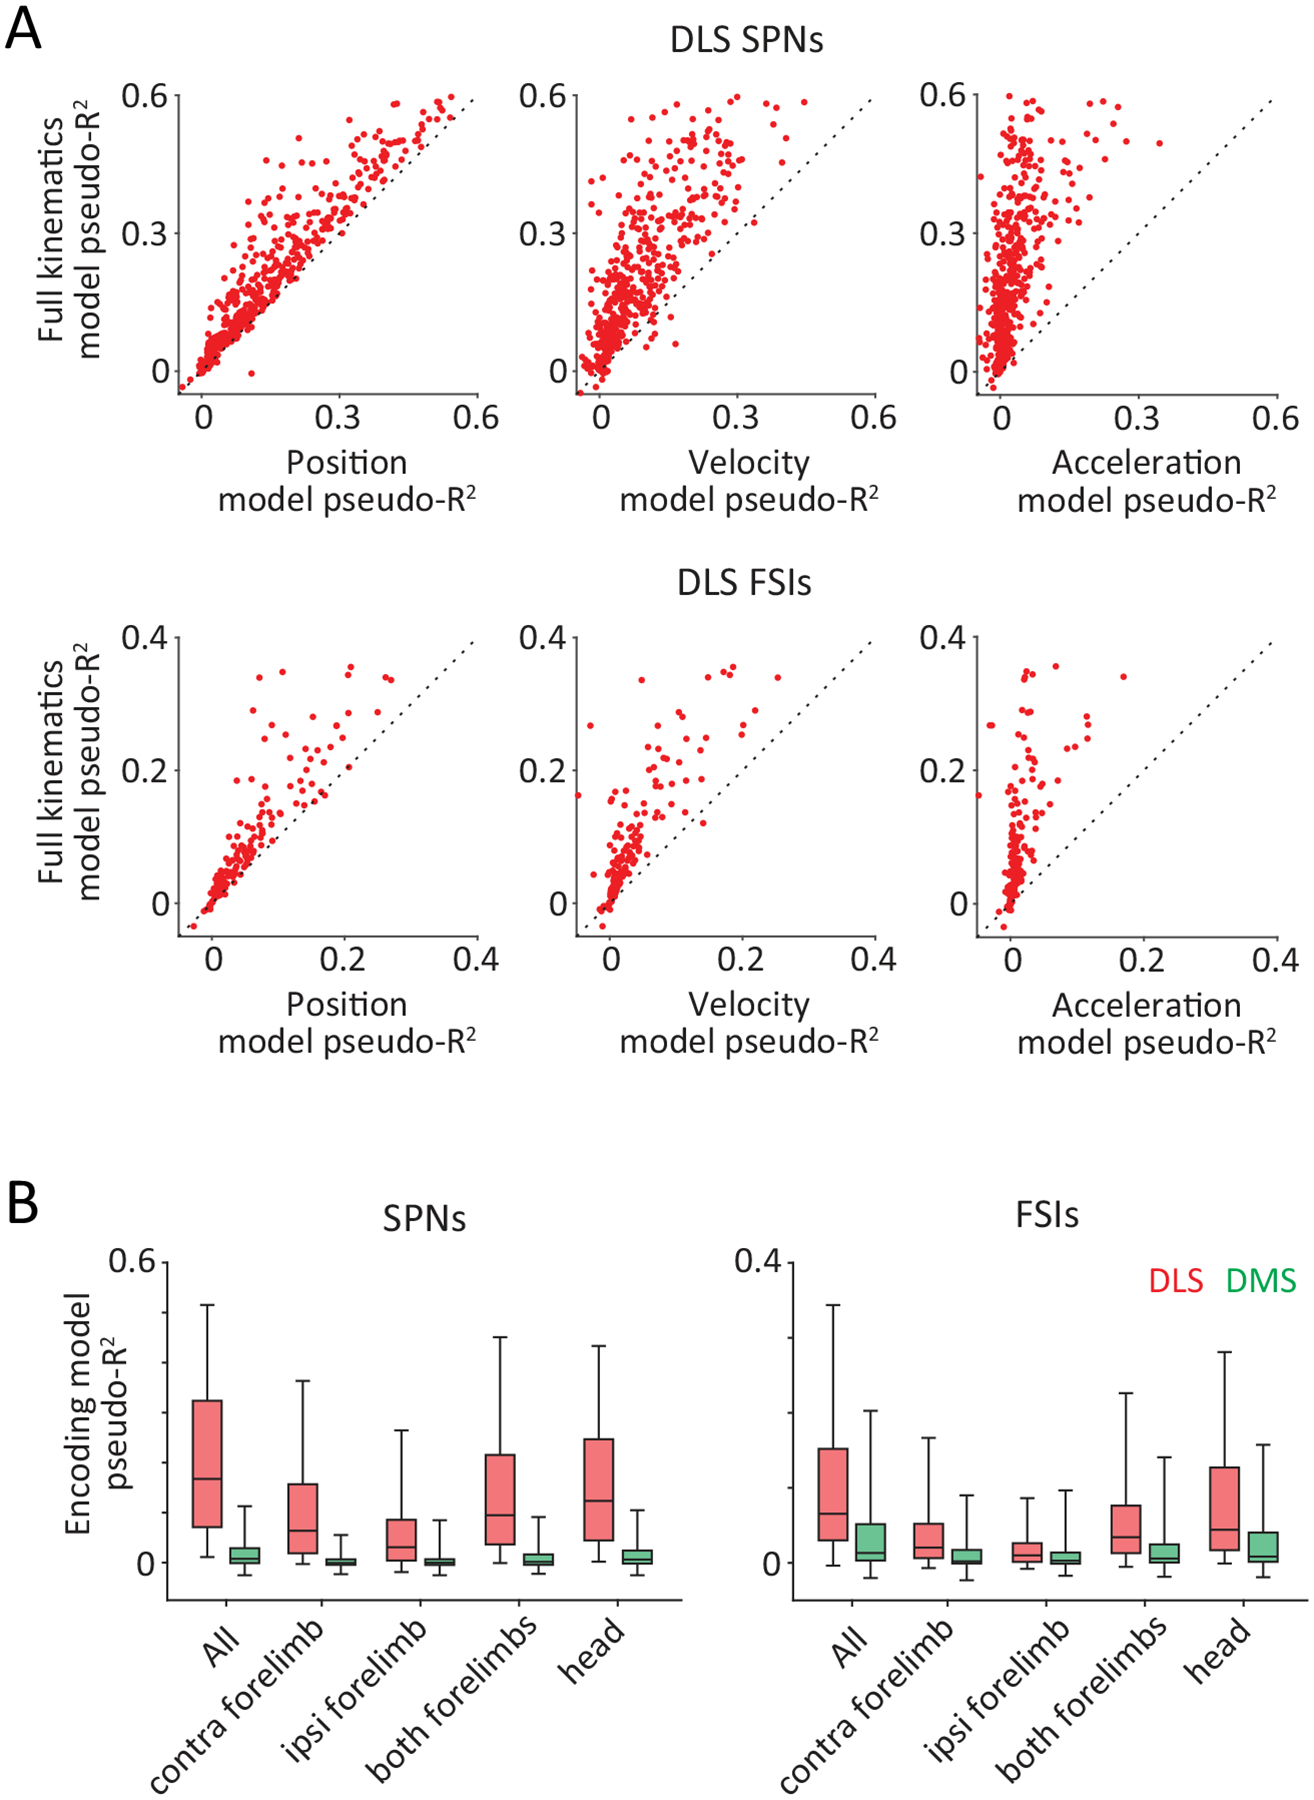
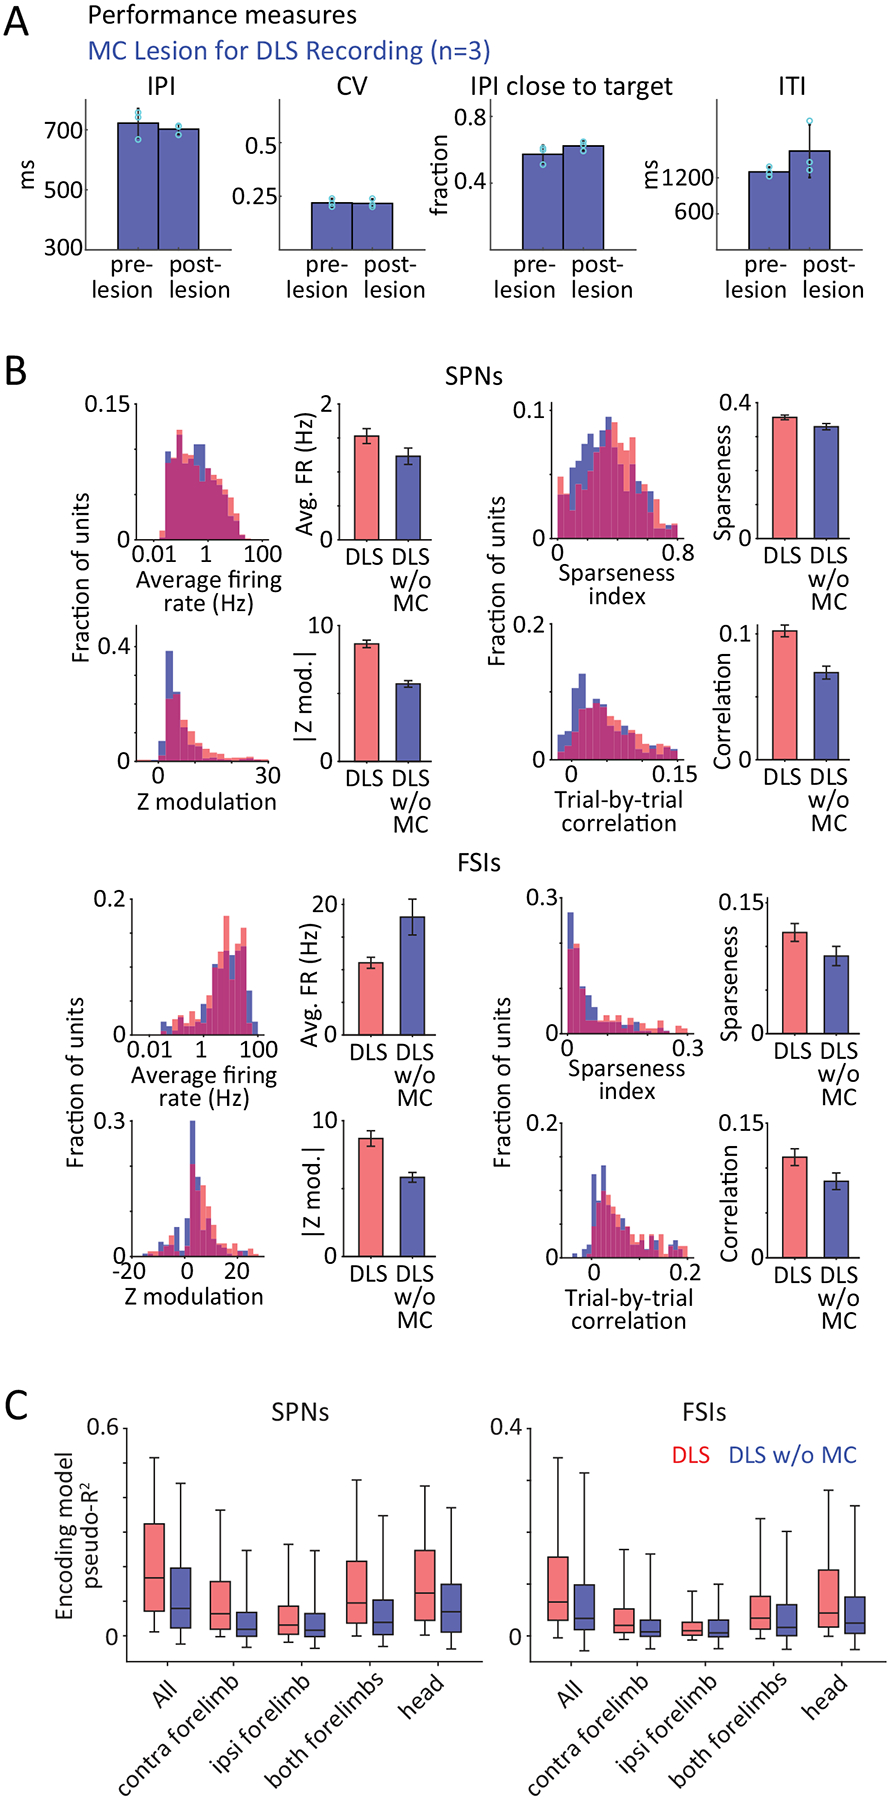
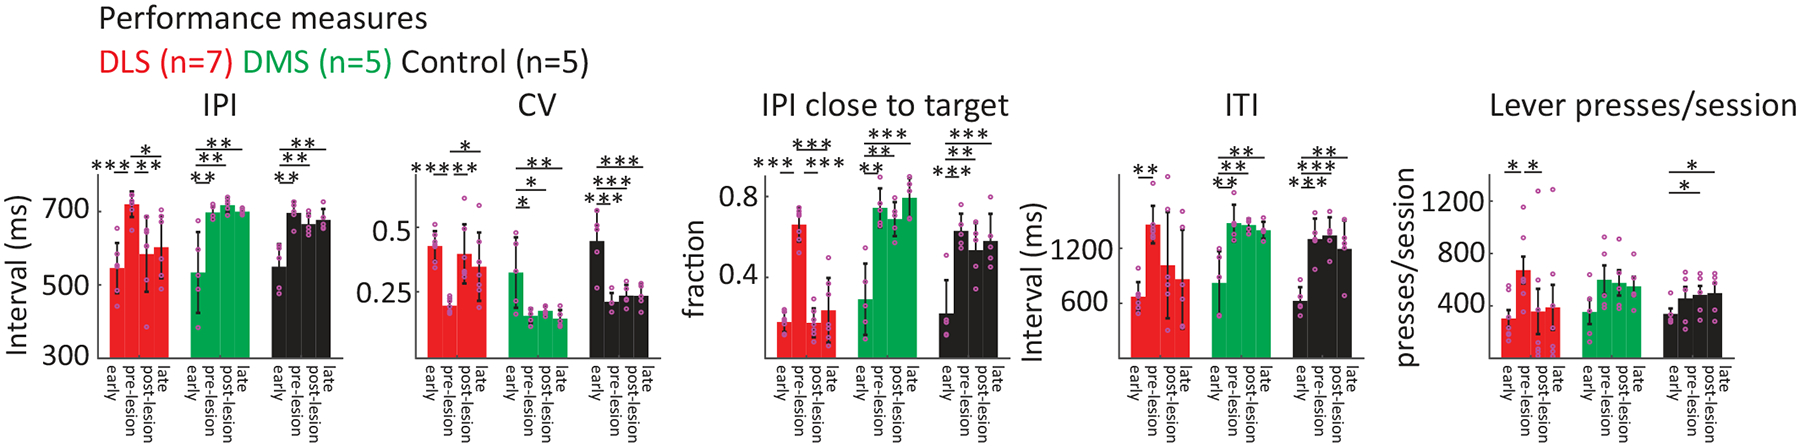
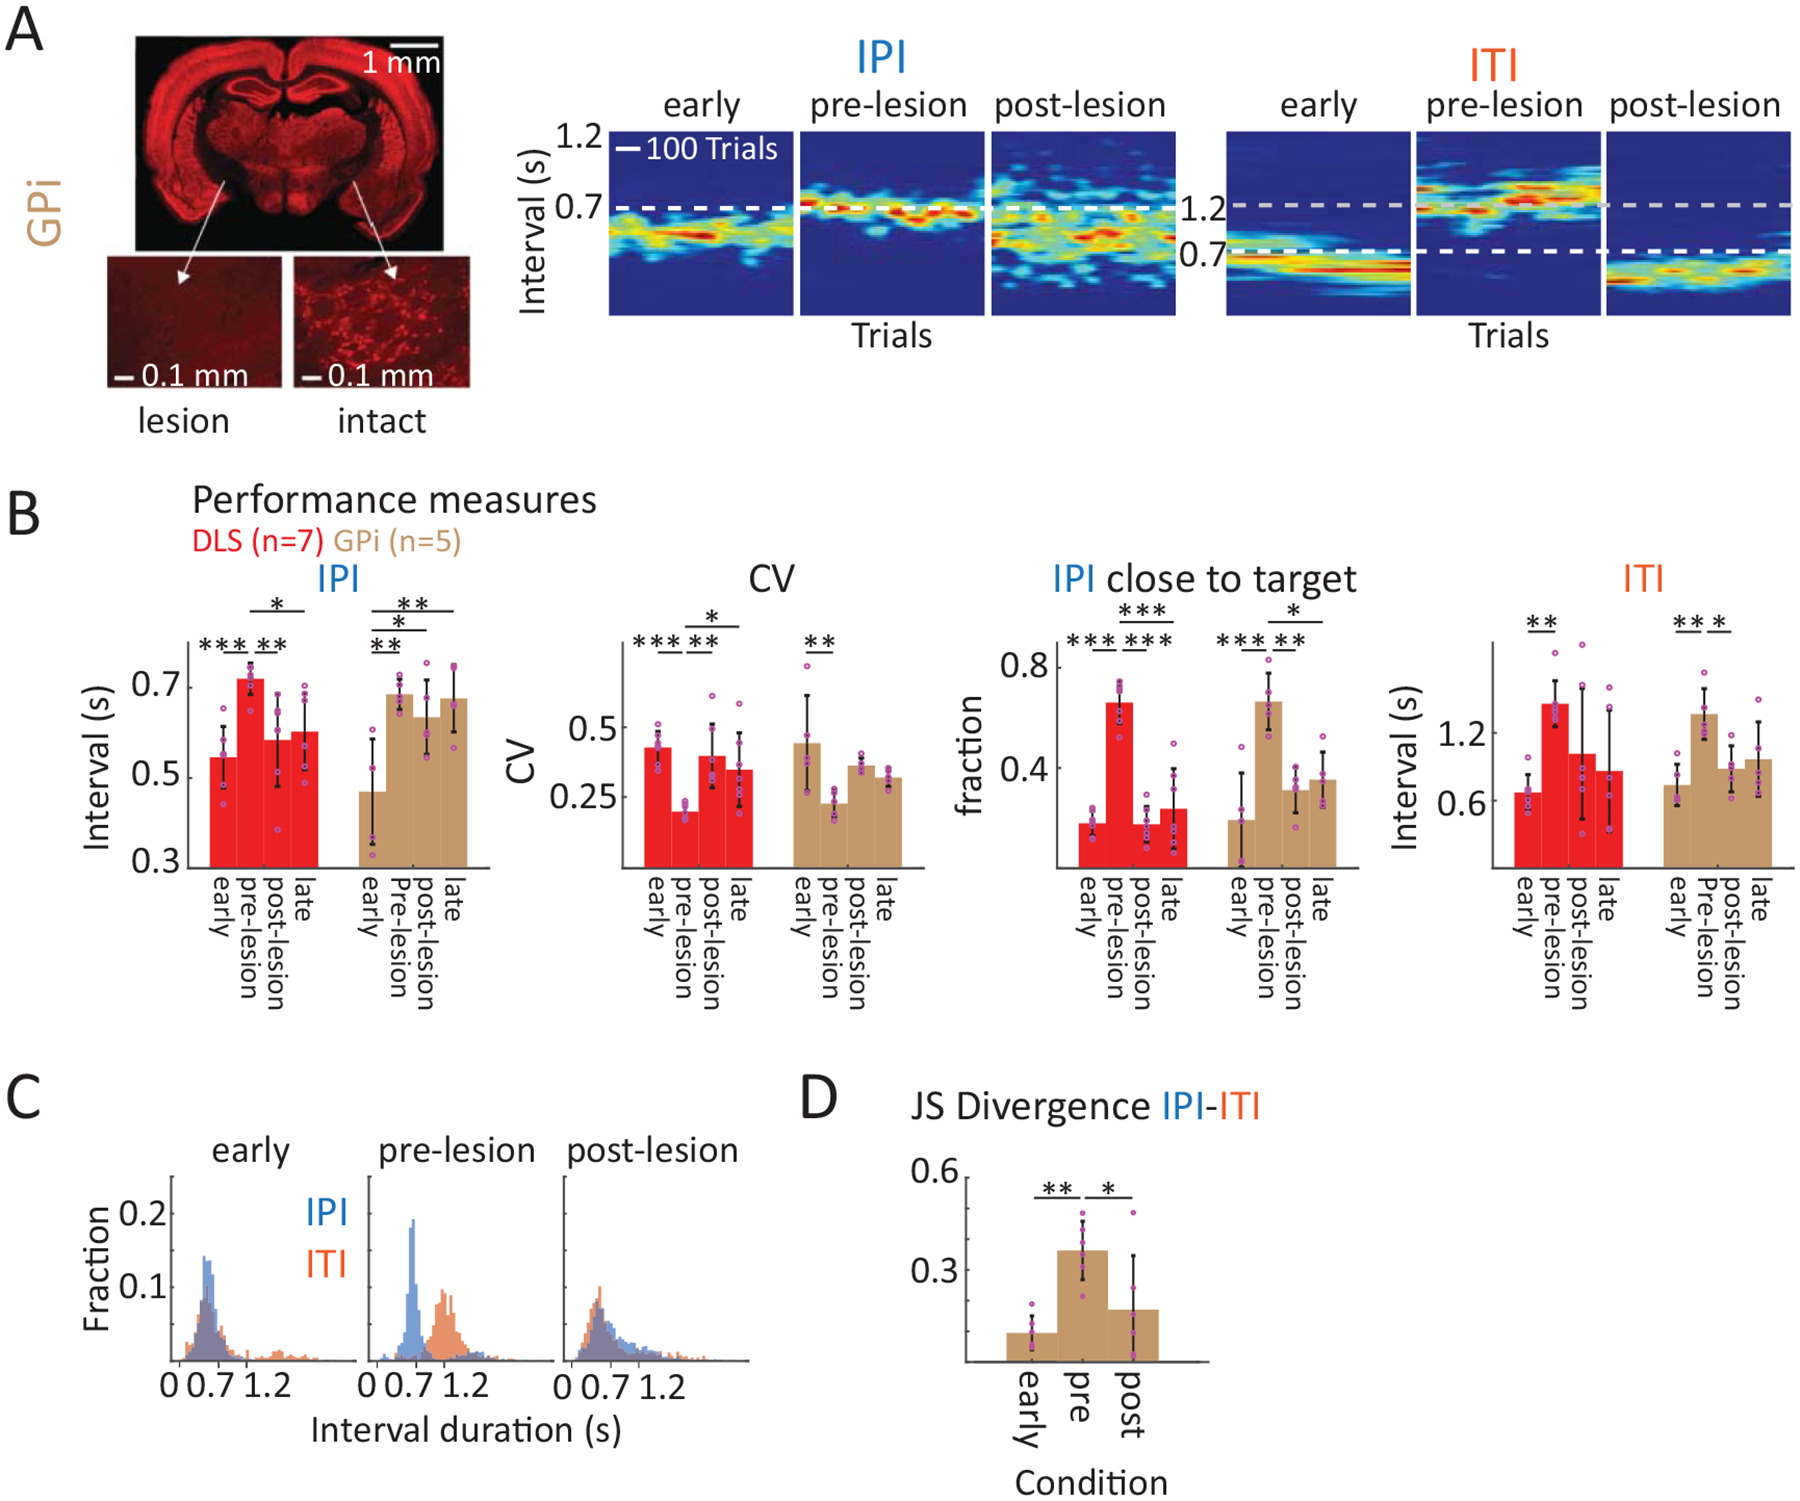
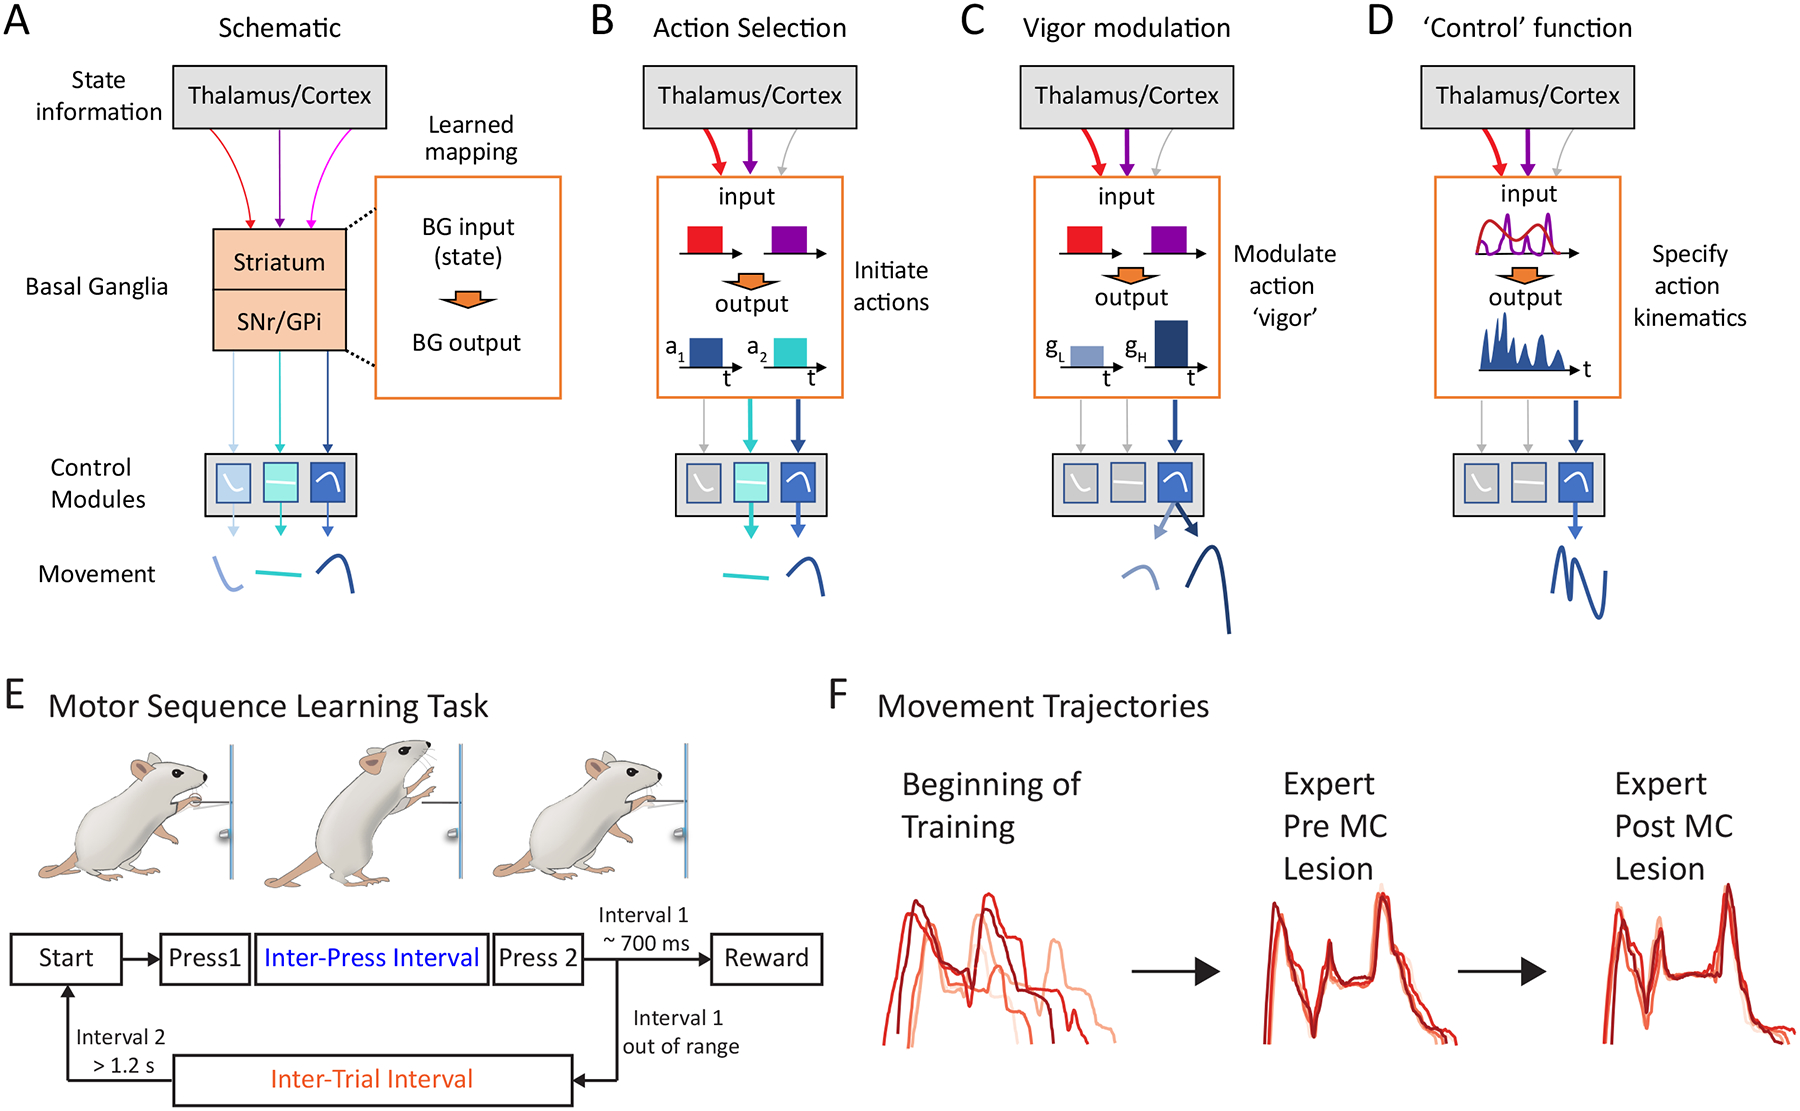
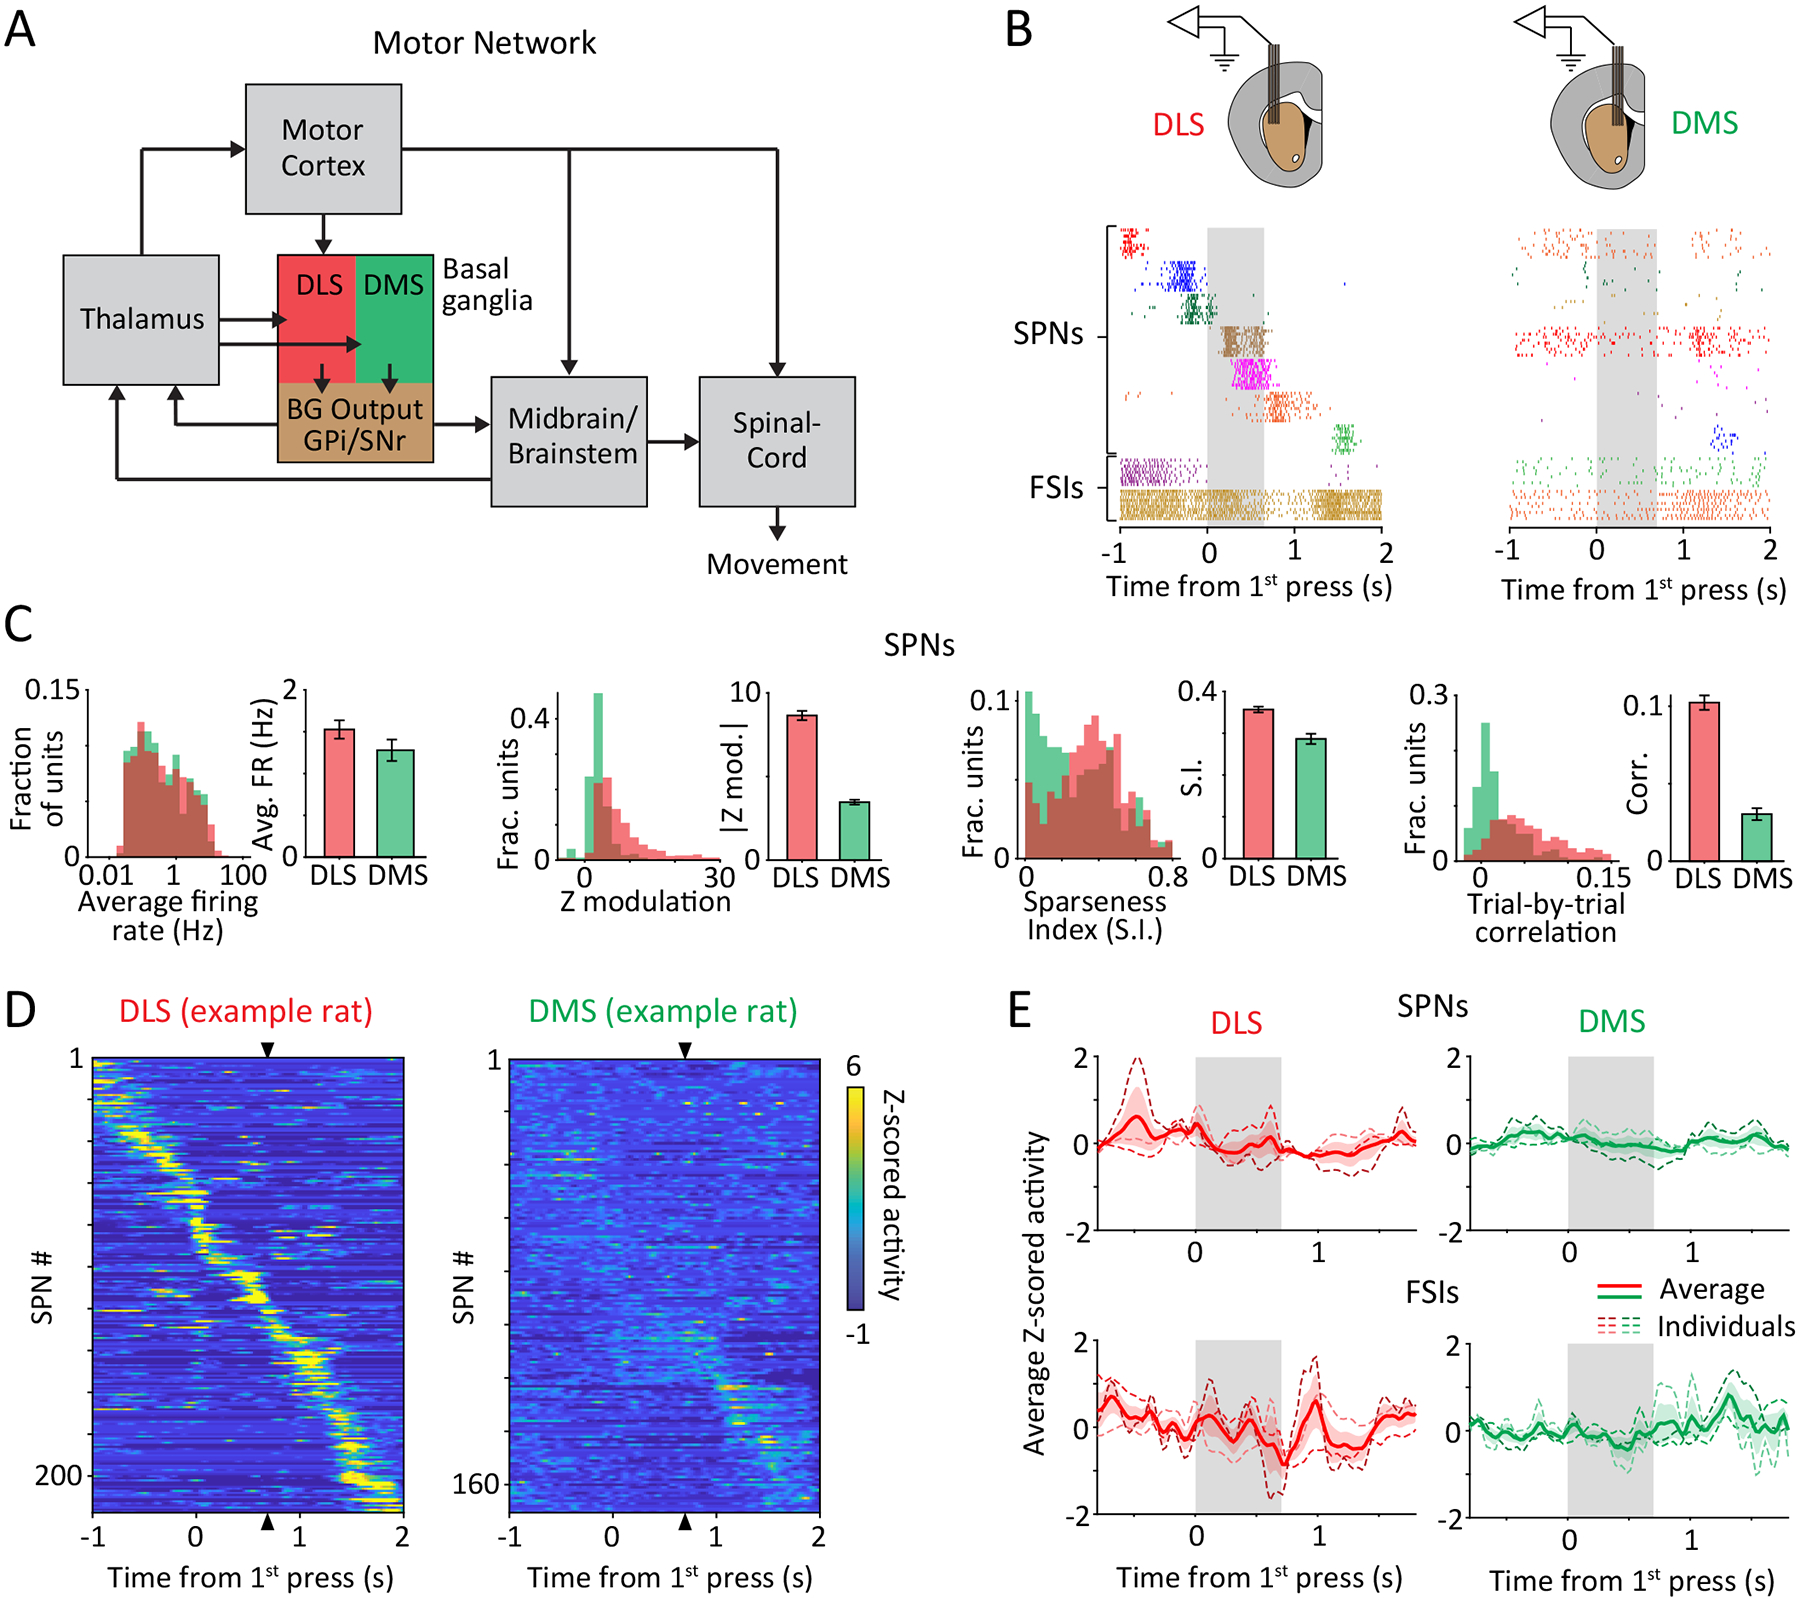
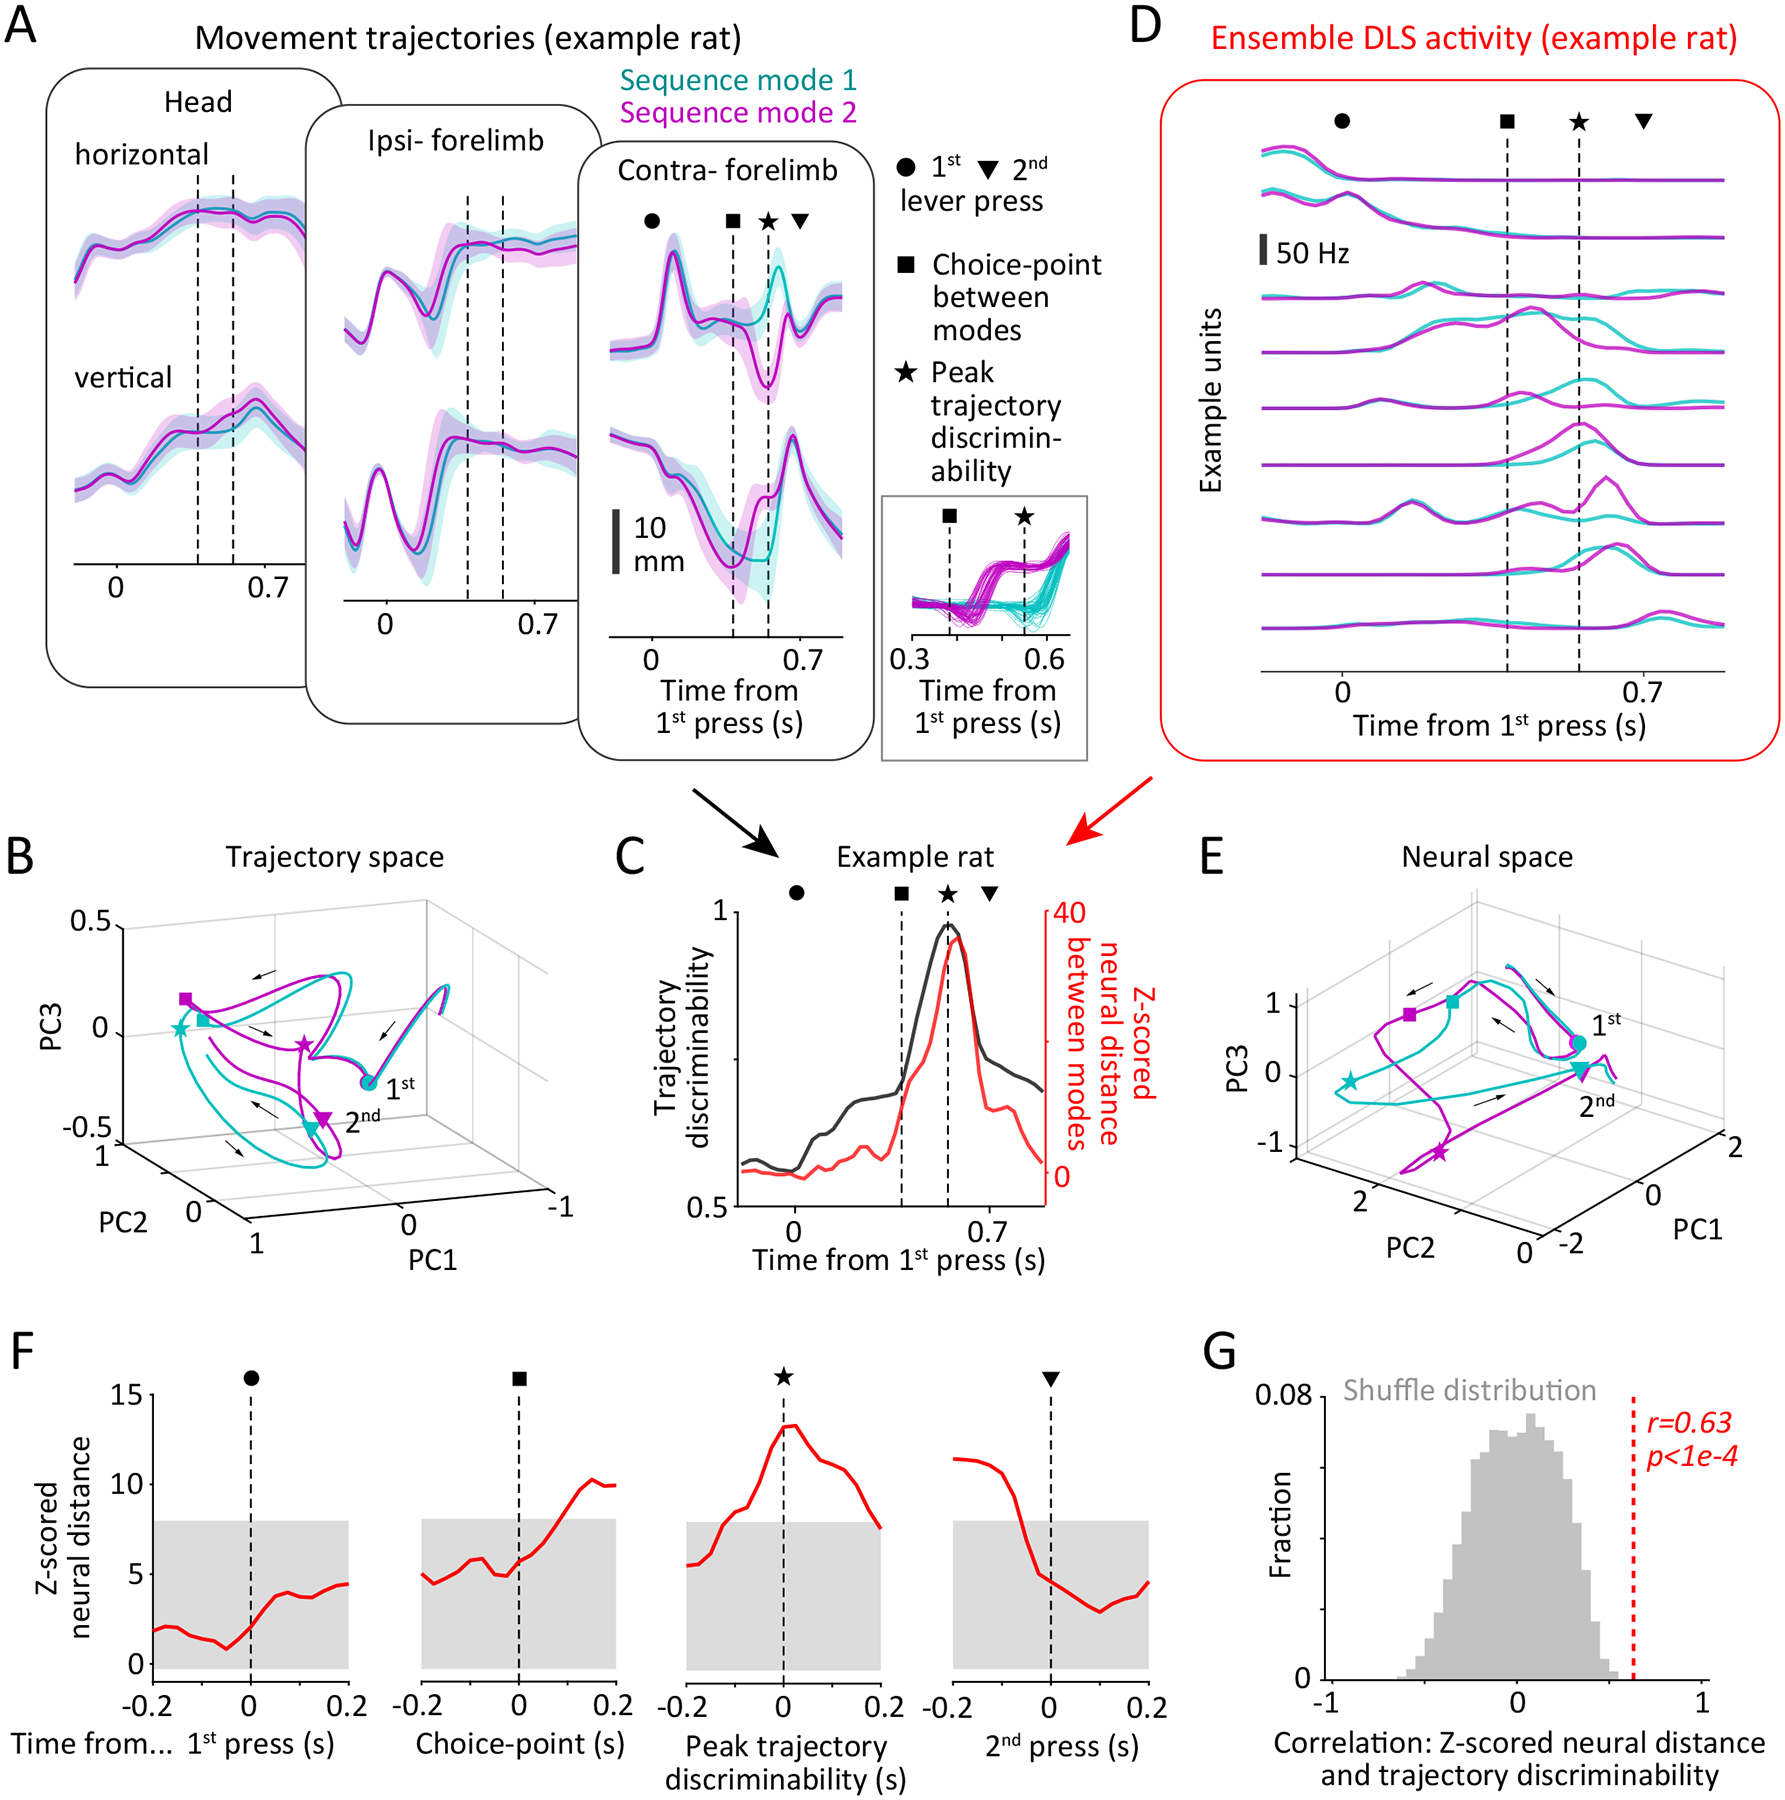
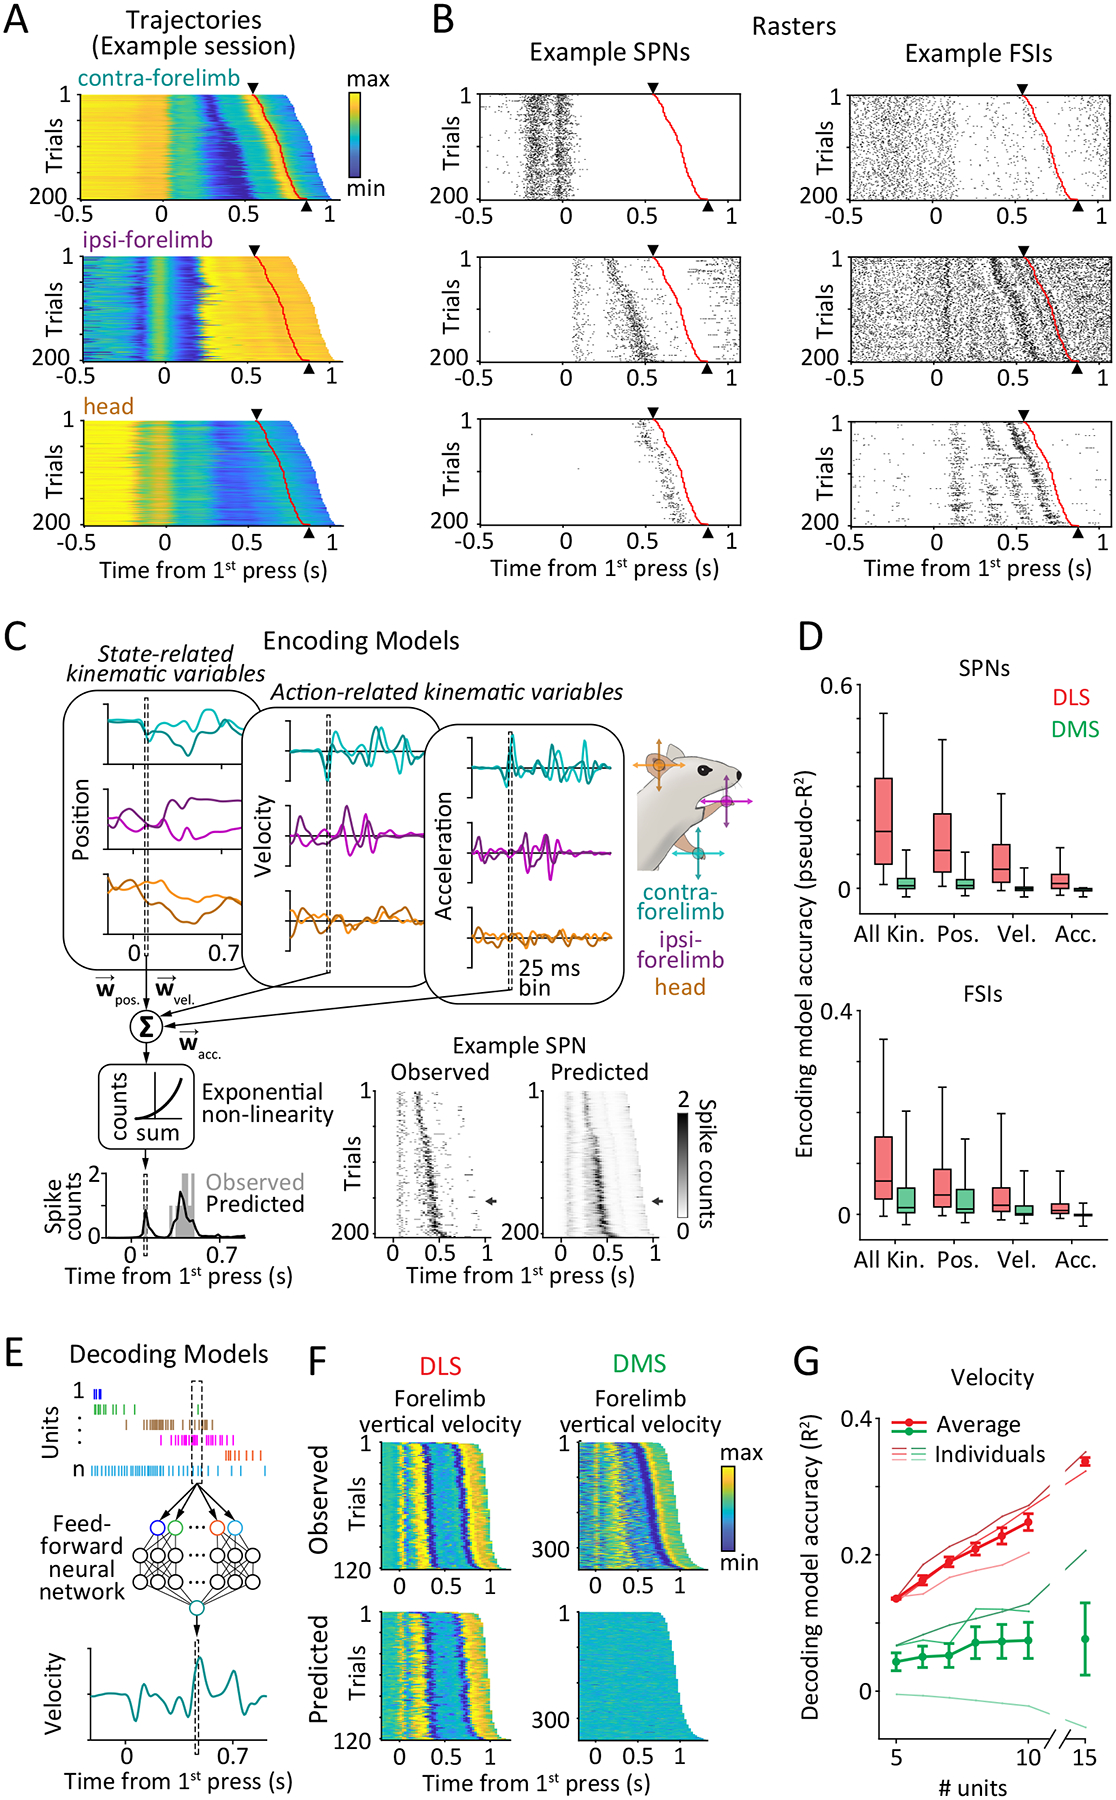
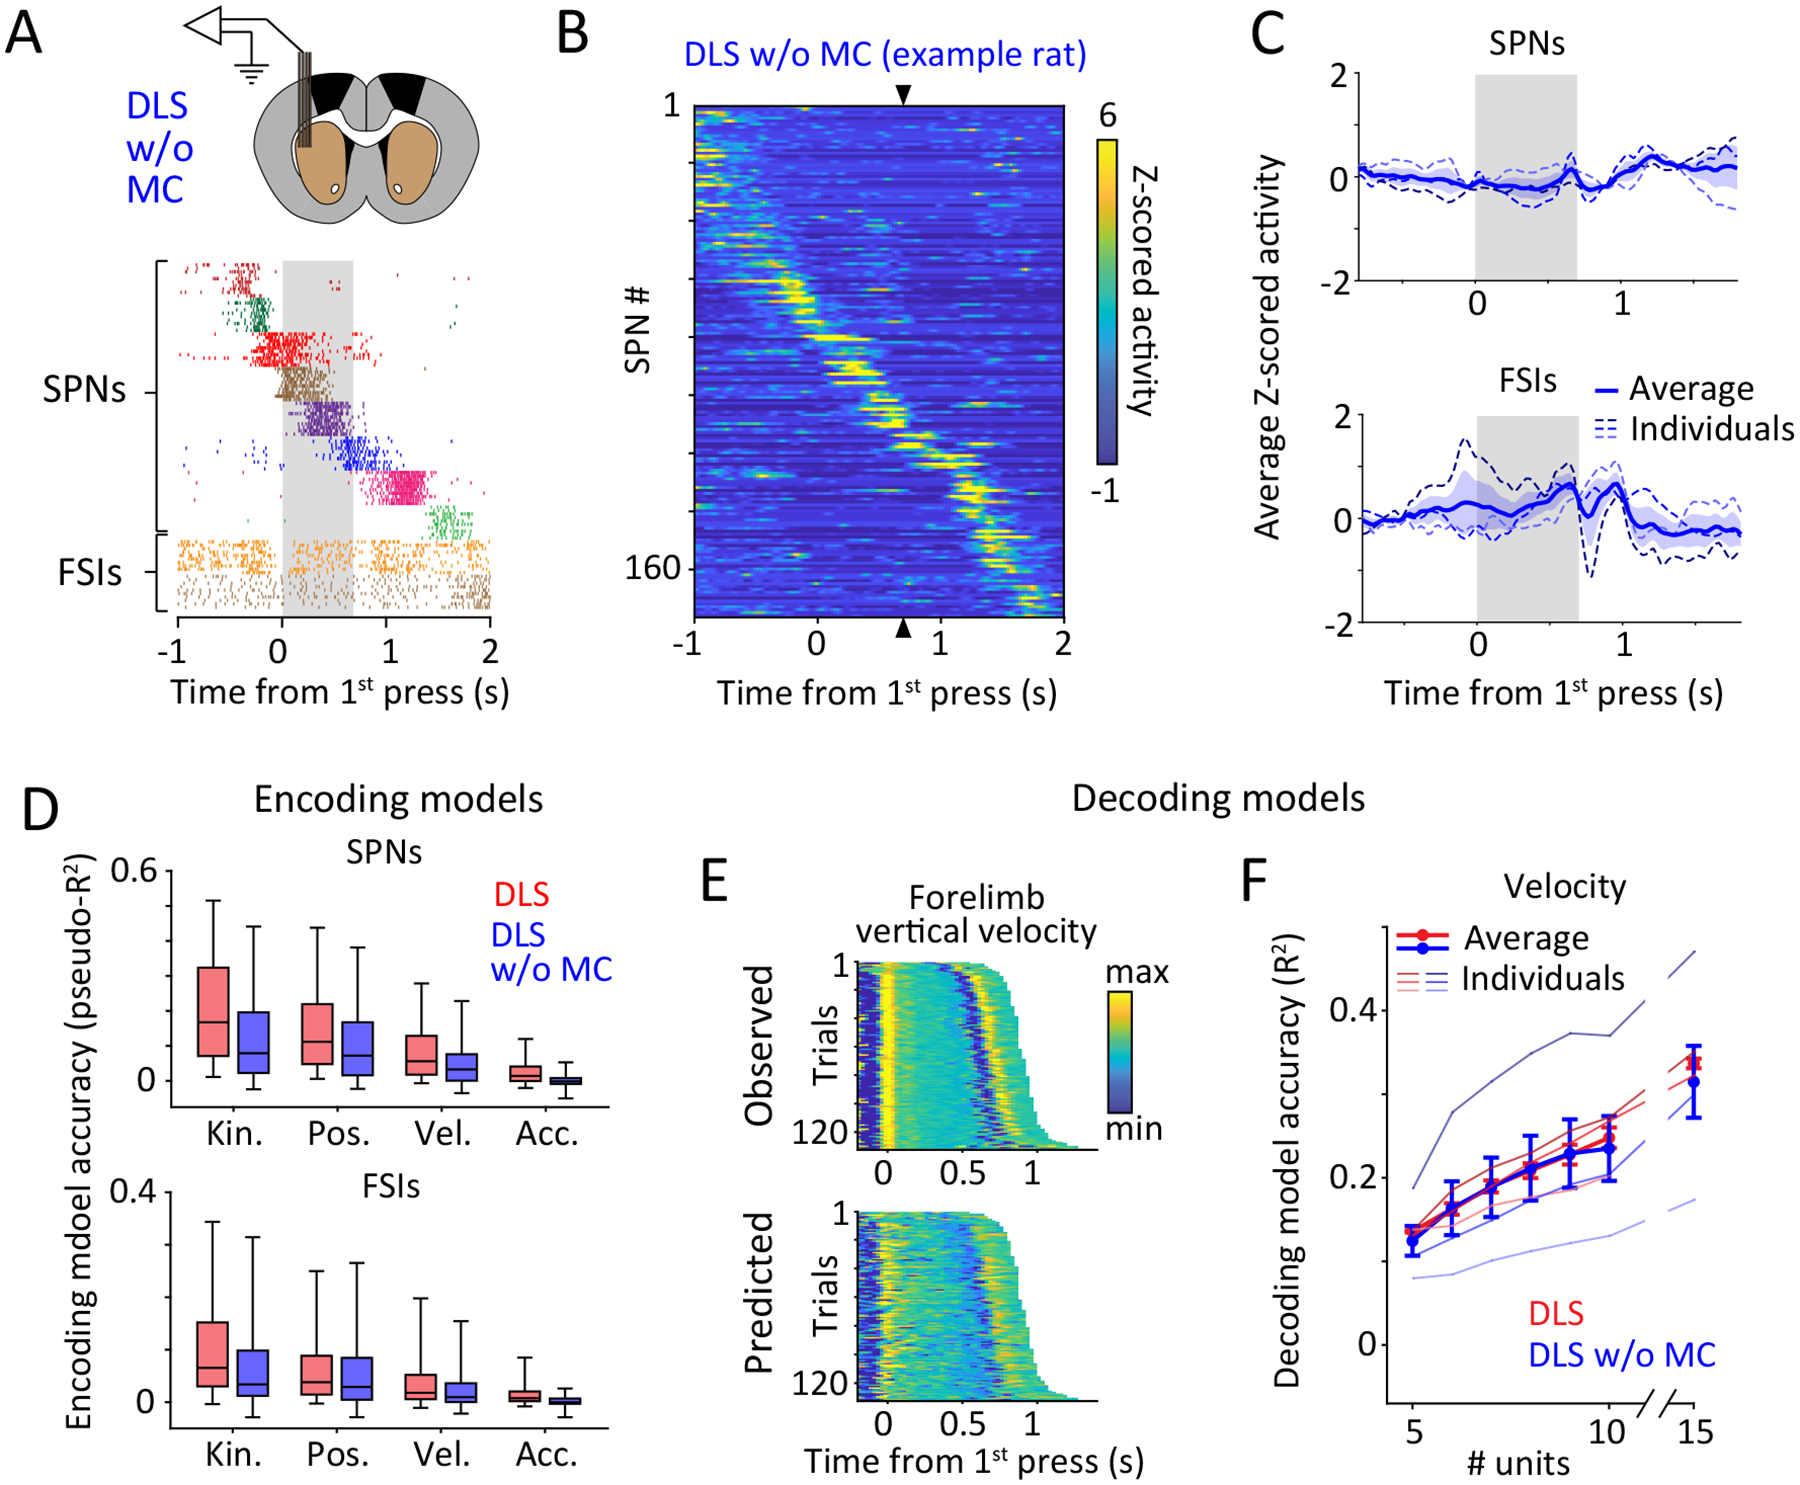
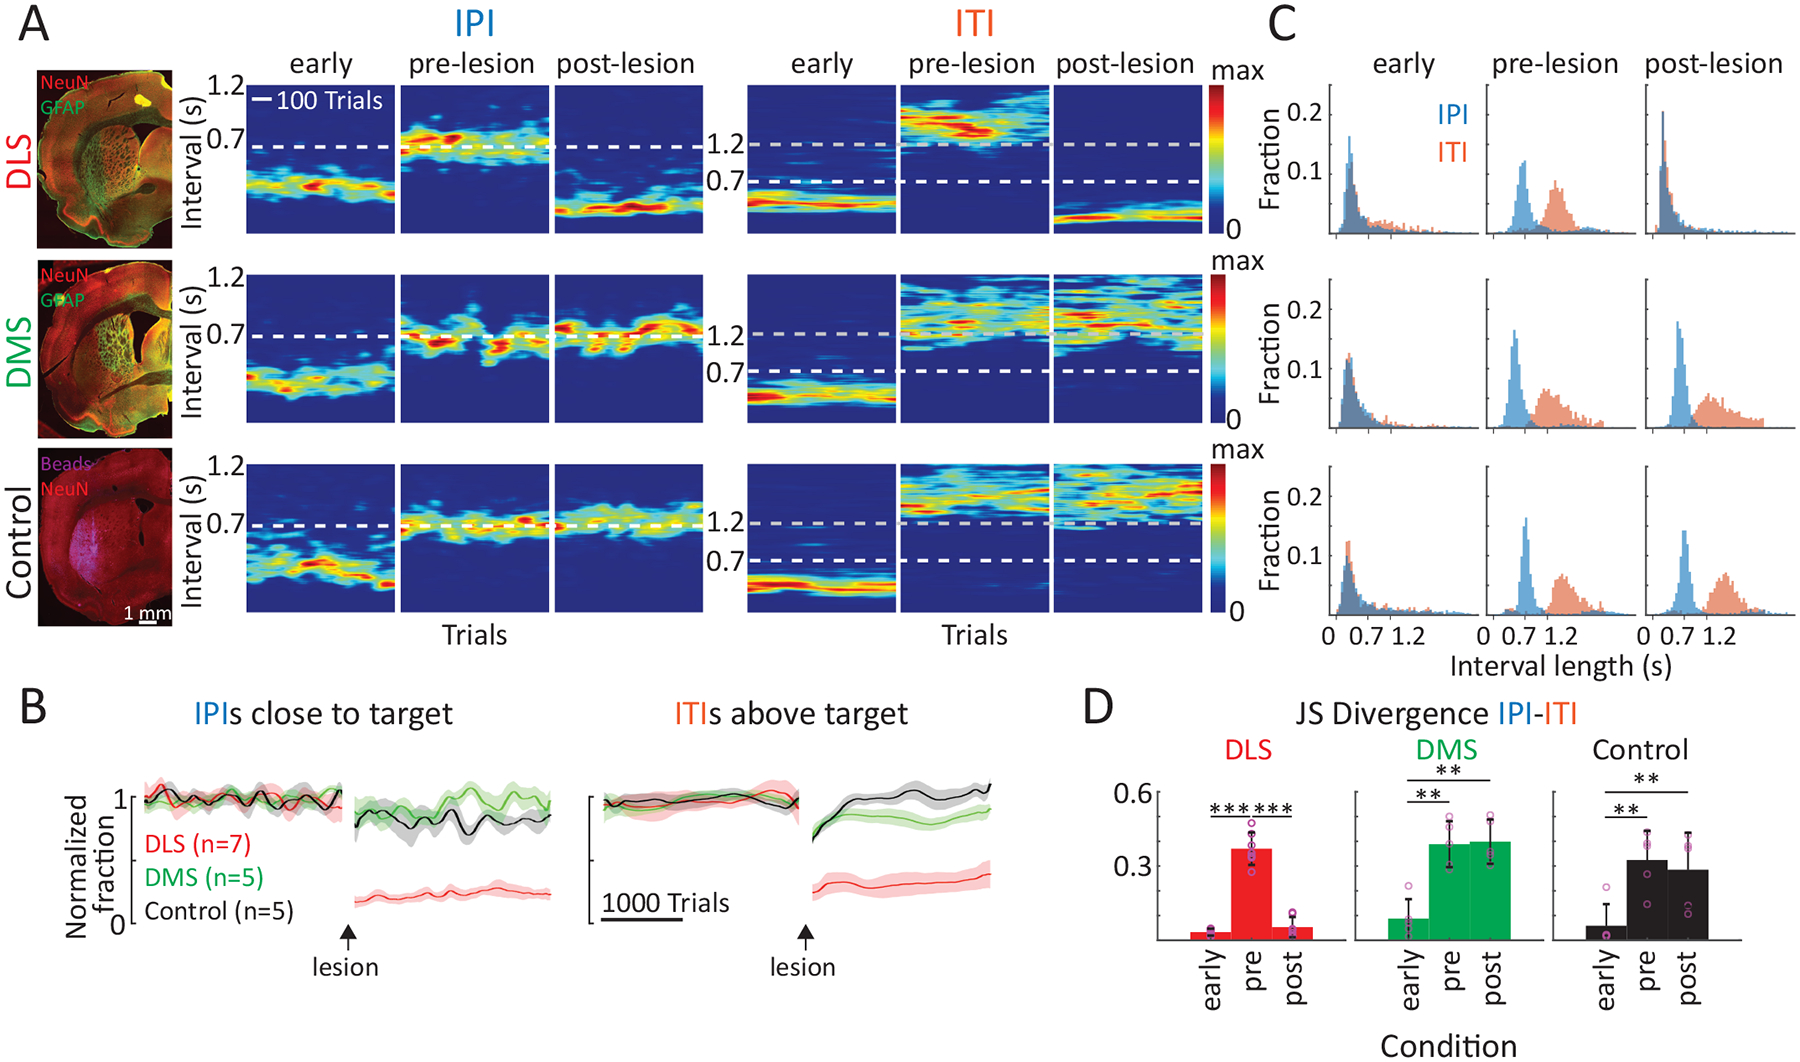
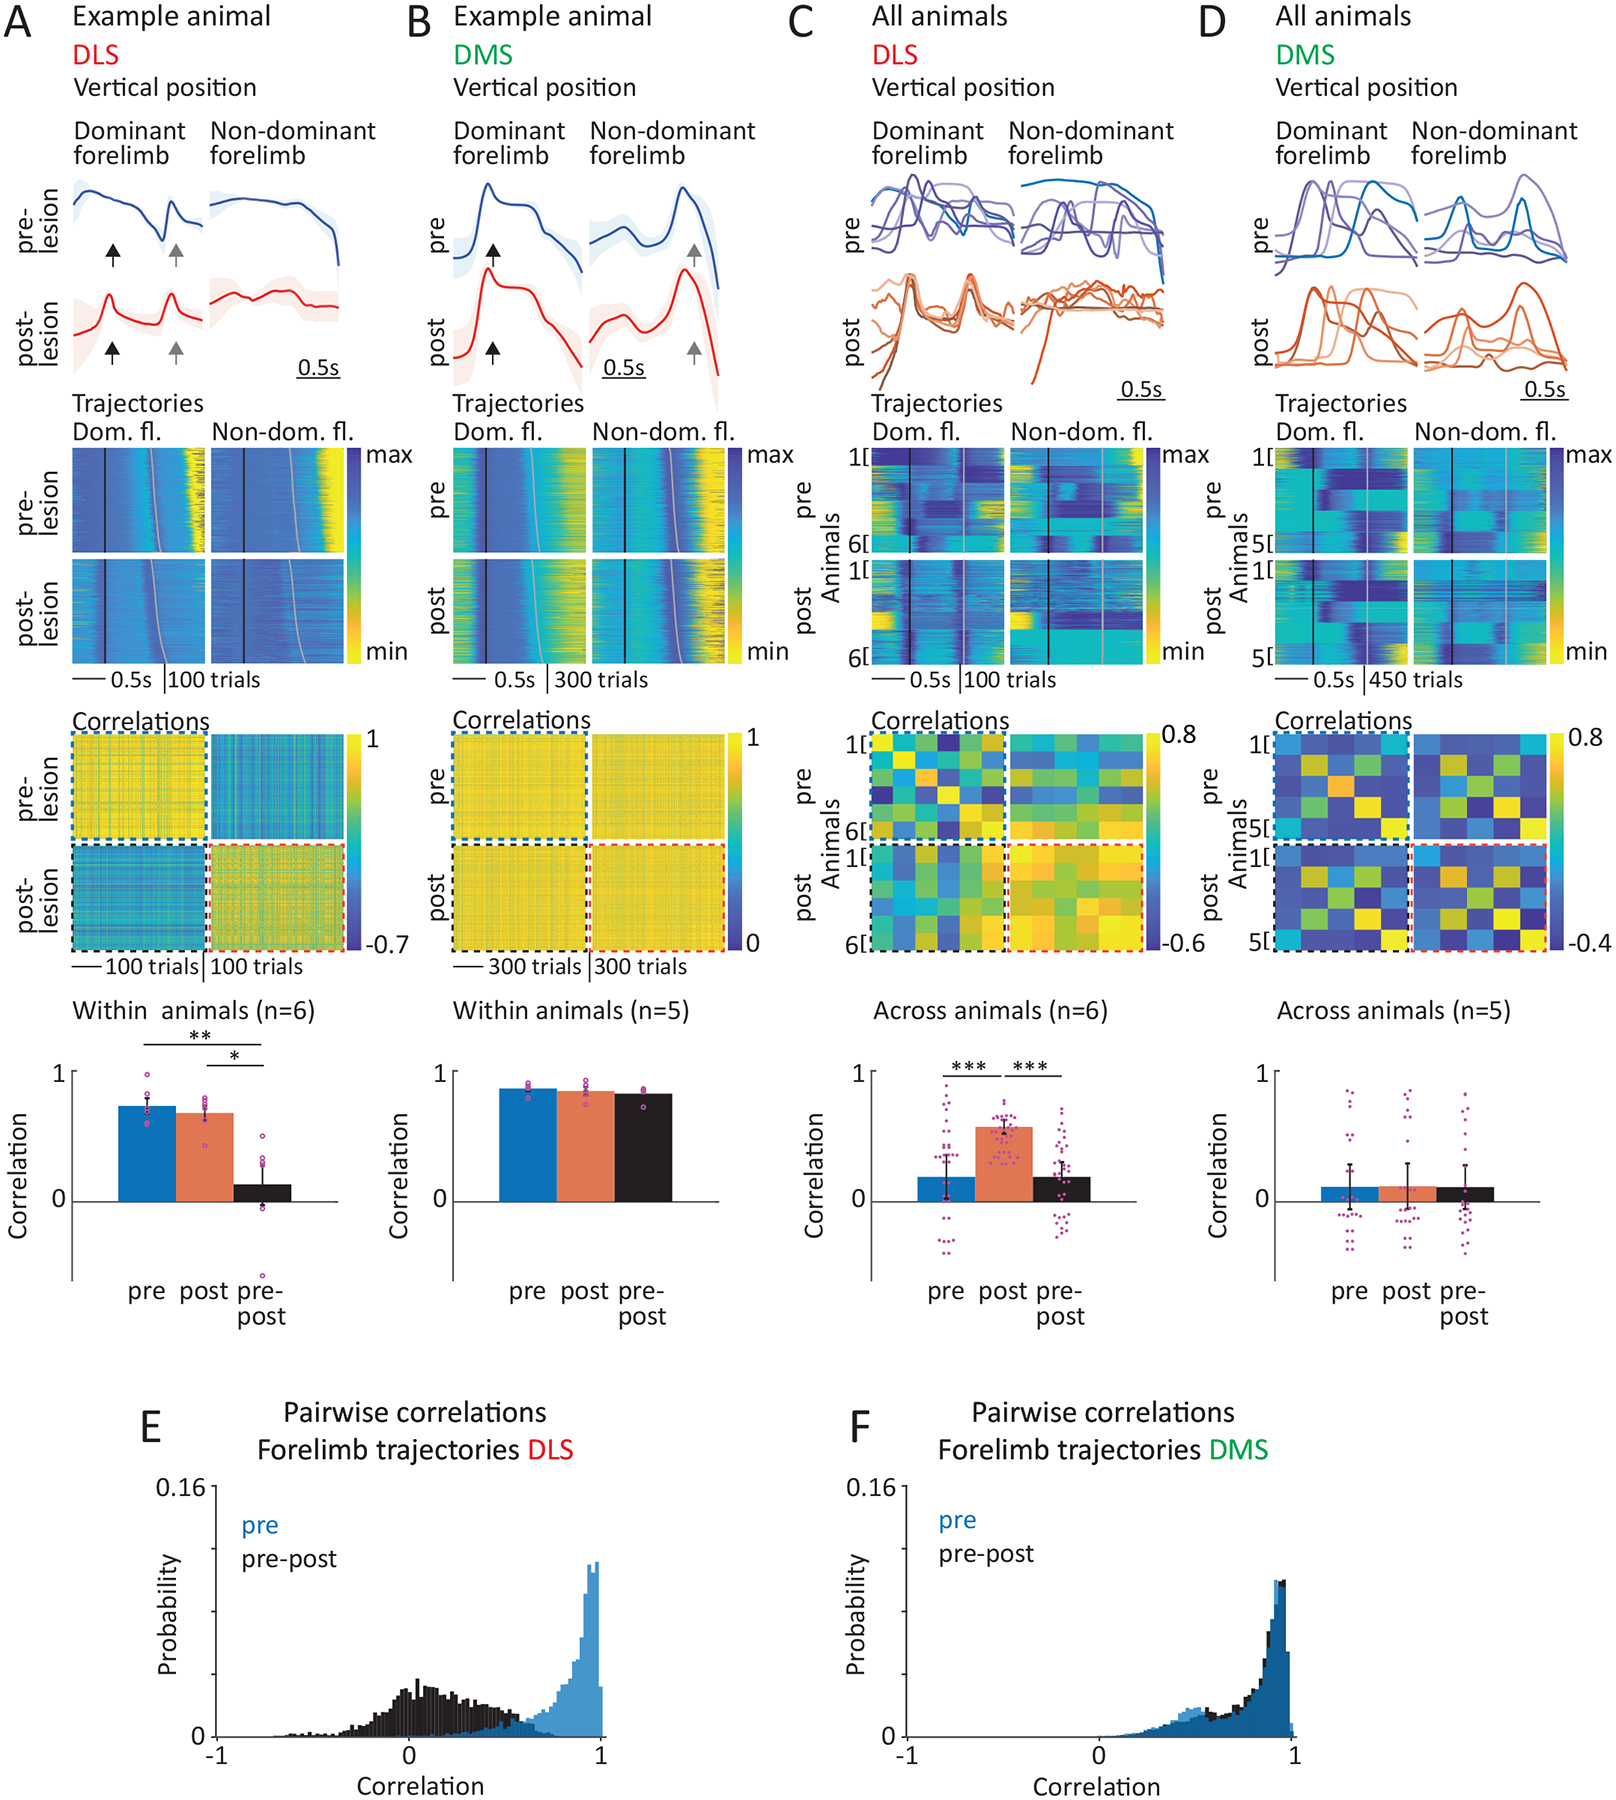
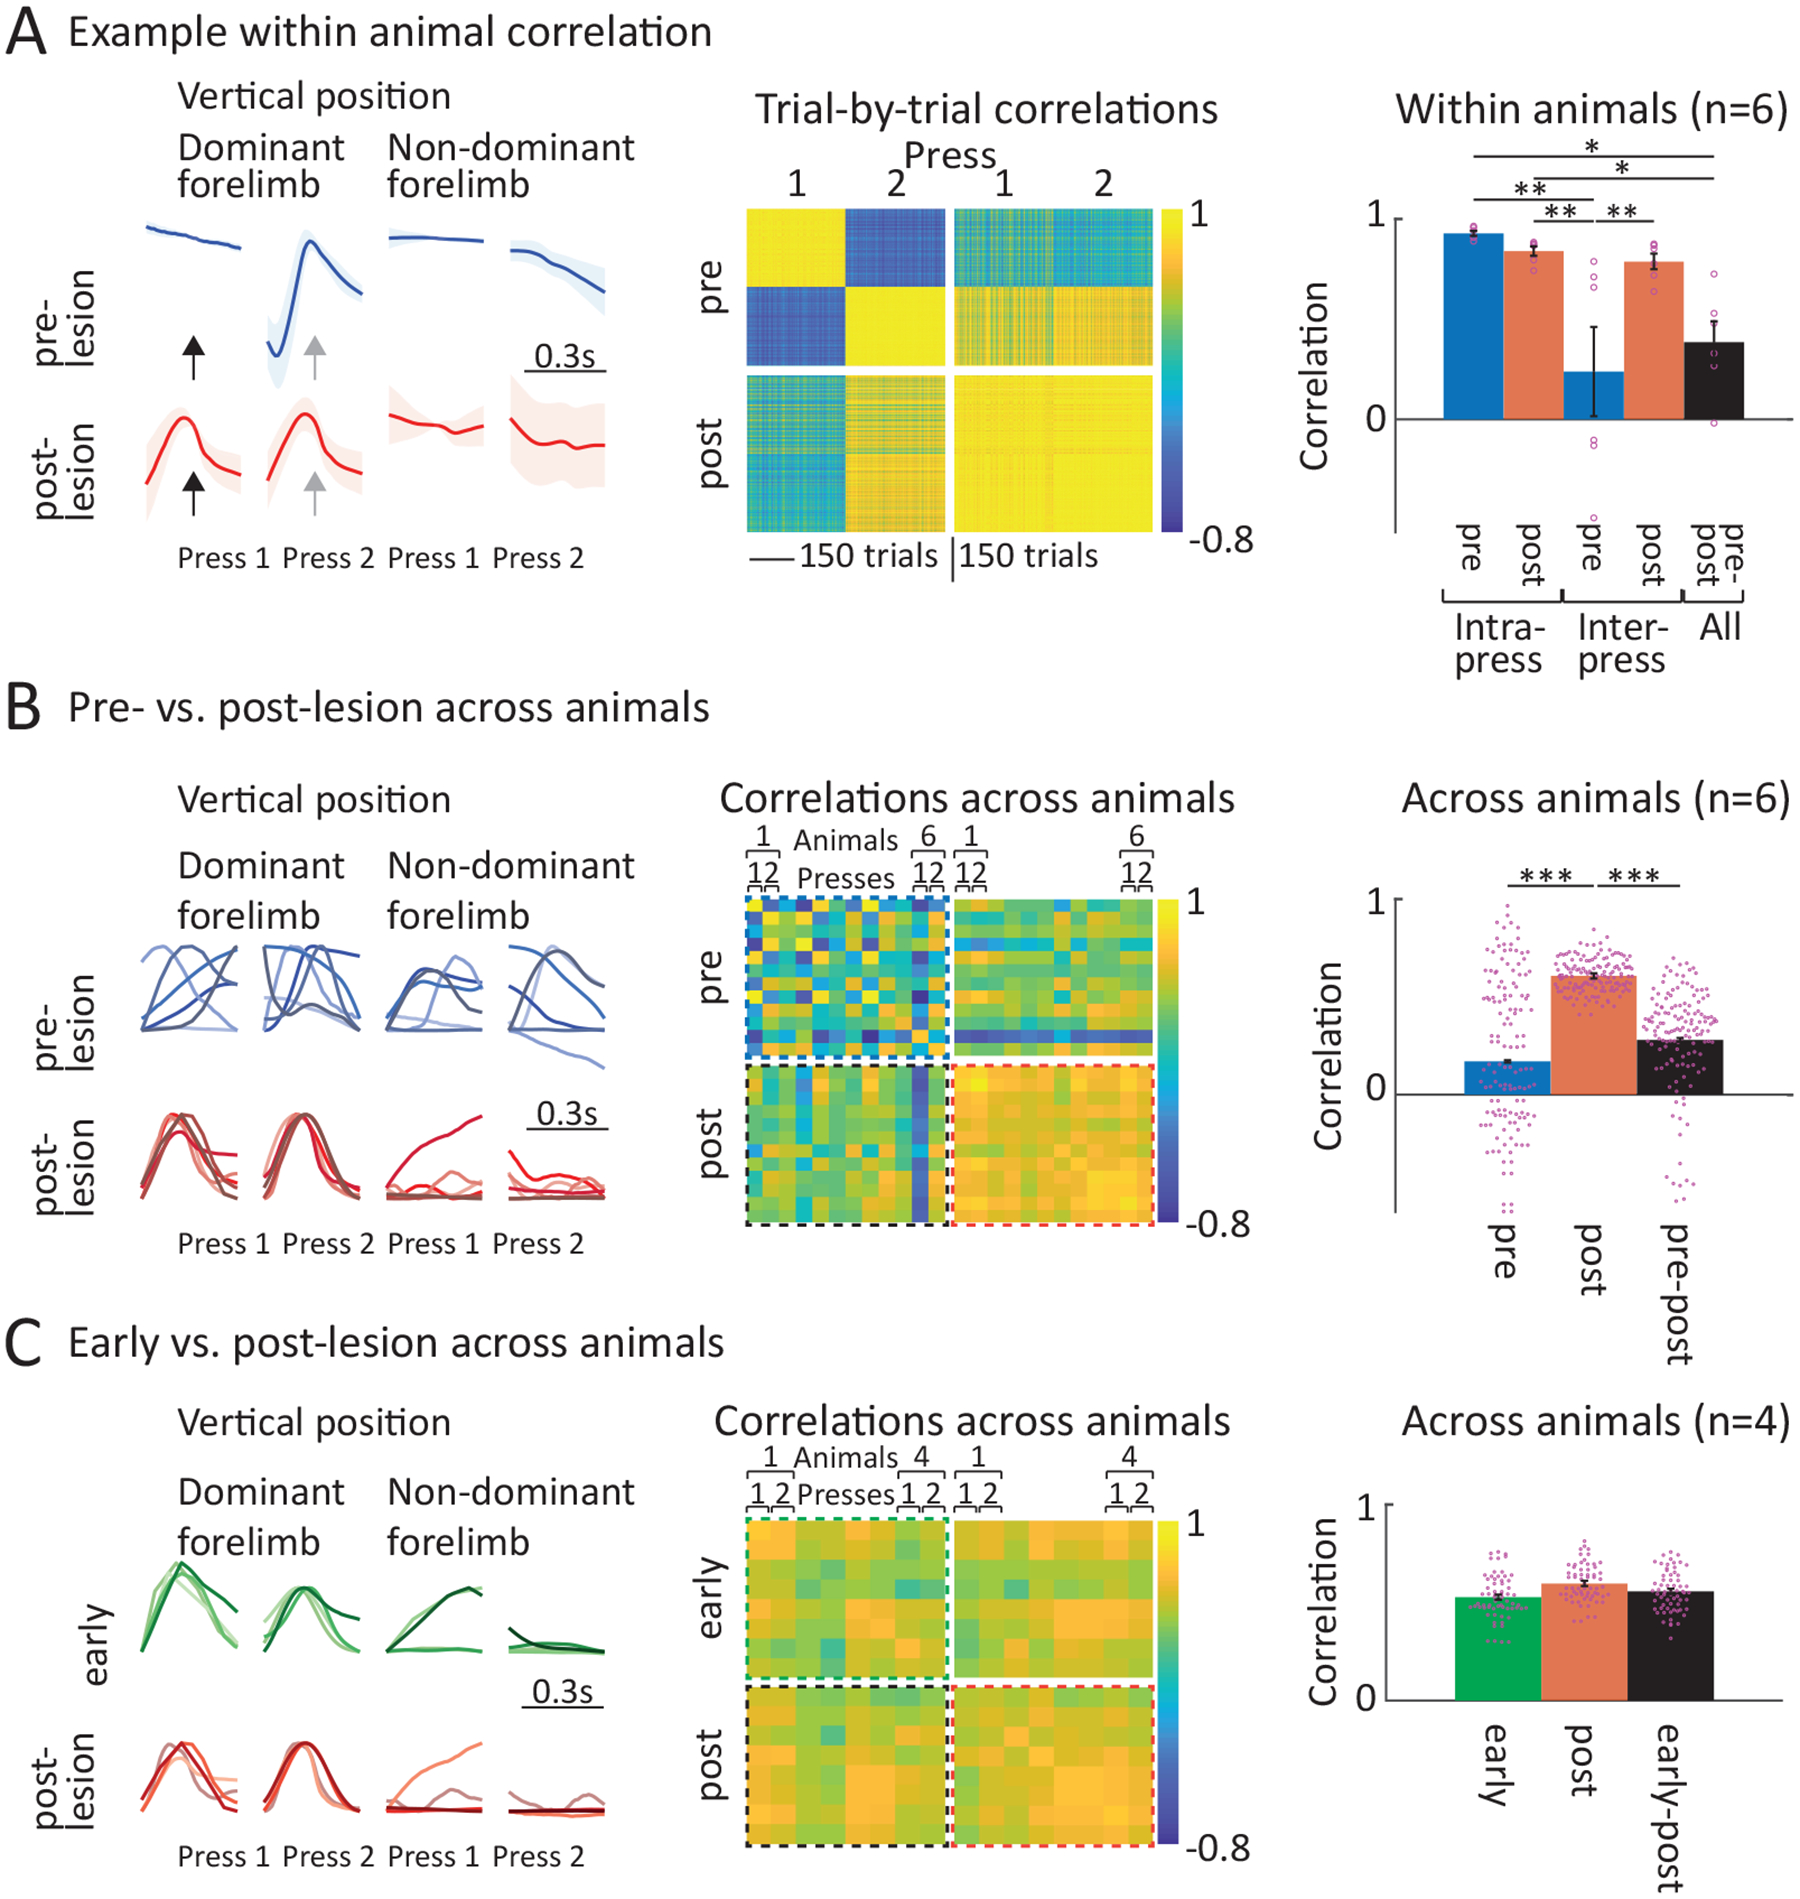
The basal ganglia are known to influence action selection and modulation of movement vigor, but whether and how they contribute to specifying the kinematics of learned motor skills is not understood. Here, we probe this question by recording and manipulating basal ganglia activity in rats trained to generate complex task-specific movement patterns with rich kinematic structure. We find that the sensorimotor arm of the basal ganglia circuit is crucial for generating the detailed movement patterns underlying the acquired motor skills. Furthermore, the neural representations in the striatum, and the control function they subserve, do not depend on inputs from the motor cortex. Taken together, these results extend our understanding of the basal ganglia by showing that they can specify and control the fine-grained details of learned motor skills through their interactions with lower-level motor circuits.


Conflict of interest statement

Competing Interests

The authors declare no competing interests.

Figures

Extended Data Fig. 1
Extended Data Fig. 1. Striatal subdivisions, recording sites and extent of lesions.
A. Virally-mediated fluorescent labeling of axons originating in either motor cortex (MC) or prefrontal cortex (PFC) to determine the outlines of the MC-recipient dorsolateral striatum (DLS) and of the PFC-recipient dorsomedial striatum (DMS), respectively. Based on the distinct projection patterns we estimated the extent of the DLS and DMS, respectively, along the anterior-posterior axis of the striatum. B. DLS/DMS outlines, recording sites and lesion extents. The outlines of the DLS and DMS determined in A along the anterior-posterior axis are indicated by red and green lines, respectively. Locations of recording electrode implantation sites in DLS and DMS are marked with arrowheads. Numbers indicate individual animals. For some animals several recording locations were determined, due to individual tetrode bundles of our recording arrays spreading apart during implantation. The extents of MC lesions in three recorded animals are marked in different shades of grey for individual animals and the dotted lines indicate the area in MC targeted for lesions. The extents of the DLS and DMS lesions are marked as shaded red and green areas, respectively. Lighter areas indicate the extent of the largest lesion across animals at a given anterior-posterior position, darker areas indicate the extent of the smallest lesion. Blue dotted lines indicate the target area for PFC tracing injections.
Extended Data Fig. 2
Extended Data Fig. 2. Classification of striatal units and statistics of task-aligned FSI activity in DLS and DMS.
A. Classification of single units recorded in striatum into putative spiny projection neurons (SPNs, maroon) and fast spiking interneurons (FSIs, blue). (Left) Spike waveform features such as peak-width and peak-to-valley interval, as well as average firing rates were used in combination to classify units as SPNs or FSIs. Grey dots indicate unclassified units (8.5%) that were excluded from further analysis. (Right) Population averaged spike waveforms for putative SPNs (top) and FSIs (bottom). Data presented as mean ± SD across units. All waveforms were rescaled to unit amplitude prior to averaging. B. Average firing rate during the trial-period (p=3e-3), maximum modulation of Z-scored firing rate during the trial-period (p=0.01), sparseness index (p=0.13) and average trial-to-trial correlation of task-aligned spiking (p=1e-3) in putative FSIs recorded in the DLS (red, n=171) and DMS (green, n=138). Bars and error-bars represent mean and SEM, respectively, across units. P-values measure the two-sided probability that two datasets have the same mean and are computed by bootstrapping difference in means (n=1e4 bootstraps).
Extended Data Fig. 3
Extended Data Fig. 3. Population-averaged activity in the DLS at the beginning and end of the skilled behavior.
A. Average Z-scored activity of putative SPN (top) or FSI (bottom) populations recorded in the DLS around the time of the 1st (solid line) and 2nd (dashed lined) lever-presses (n=3 rats). Grey shading represents 95% confidence interval, corrected for multiple comparisons, of the distribution of Z-scored activity expected by chance if lever-presses occurred at random times (n=1e4 randomizations). B. Trial-to-trial variability of an example rat’s task-aligned movement trajectories. (Top) Trajectories of the rat’s forelimb (vertical component) in an example session corresponding to a specific sequence mode (see Extended Data Fig. 4). Each line denotes a trial. (Bottom) Normalized trial-by-trial variability (see Methods) of movement trajectories of the rat’s forelimbs and head. Times at which this measure exceeds a value of 2 (dashed lines) are designated the start or stop time of the motor sequence. On average, starts occurred 0.42 ± 0.46 s prior to the first lever-press and stops occurred at 0.35 ± 0.02 s after the second lever-press (mean ± SD, n=3 rats). C. Average Z-scored activity for populations of SPNs (top) or FSIs (bottom) recorded in the DLS around the start (solid line) and stop (dashed lined) of the skilled behavior (n=3 rats). Grey shading represents 95% confidence interval, corrected for multiple comparisons, of the distribution of Z-scored activity expected by chance if start/stop occurred at random times (n=1e4 randomizations). D. Average Z-scored activity for populations of SPNs recorded in the DLS of three example rats during execution of a representative sequence mode (red lines). Superimposed are trial-averaged forelimb speed profiles (black, averaged over both contra- and ipsi-lateral forelimbs), from the same individuals. E. Non-uniformity of the average Z-scored activity profiles of DLS SPNs, measured by their standard deviation, was averaged across sequence modes and then across rats (red line, n=3 rats). Grey histogram shows distribution expected by chance if SPNs showed independent activity (generated by randomly jittering the Z-scored PETHs of individual units prior to averaging, n=1e4 randomizations), and p-value quantifies the two-sided probability that this explains the data. H. Correlation coefficient between average speed profiles and average activity of DLS SPN populations (both shown in panel D), averaged across sequences modes and then across rats (red line, n=3 rats). Grey histogram shows the statistic distribution under the null hypothesis (no relationship between the variables) computed by randomization (n=1e4 permutations), and p-value quantifies the two-sided probability that this explains the data.
Extended Data Fig. 4
Extended Data Fig. 4. Identification of sequence modes and population-averaged activity in the DLS at choice points between modes.
A. Two-dimensional t-distributed stochastic neighborhood embedding (tSNE) of task-aligned kinematic trajectories for a subset of trials from an example rat. Each point represents a trial and colors represent distinct modes identified by a semi-automated unsupervised clustering algorithm (see Methods). On average we identified 5 ± 2 modes (mean ± SD) per rat (n=9 rats). B. Task-aligned horizontal and vertical components of the position and velocity of a single forelimb averaged across trials within each sequence mode shown in panel A. Shading represents standard deviation across trials. C. Task-aligned kinematic variables including forelimb position (left) and velocity (right) for a random subset of 20,000 trials performed by the example rat, sorted by sequence mode (indicated by colors, as in panels A-B). Kinematics have been time-warped to account for trial-by-trial variability in the interval between the 1st and 2nd lever-presses. D. Pairwise correlations between the kinematics of the trials shown in C, sorted by sequence mode. E. Average Z-scored activity for populations of SPNs (top) or FSIs (bottom) recorded in the DLS around the time of choice-points (left) or at peak discriminability between the trajectories corresponding to pairs of modes (right). Z-scored activity is averaged across units and modes in a mode pair, then across all mode-pairs in each rat and then across rats (n=3 rats). Grey shading represents 95% confidence interval, corrected for multiple comparisons, of the distribution of Z-scored activity expected by chance if these events occurred at random times.
Extended Data Fig. 5
Extended Data Fig. 5. Comparison between encoding of different kinematic features by striatal neurons.
A. Scatter plots comparing the goodness of fit, measured using the pseudo-R2 (see Methods), between encoding models that use a combination of all kinematic variables (position, velocity and acceleration) versus those that use only position (left), velocity (middle) or acceleration (right) variables to predict the activity of DLS SPNs (top) and FSIs (bottom). p<1e-4 for all SPN kinematic comparisons and p=4e-3, <1e-4, <1e-4 for FSI kinematic encoding comparisons to position, velocity and acceleration variables, respectively. P-values are computed by bootstrapping paired difference in means (n=1e4 bootstraps) and quantify the likelihood that two distributions have the same mean. B. Goodness of fit, measured by pseudo-R2 (see Methods), for encoding models that use detailed kinematics (position, velocity and acceleration) of all tracked effectors and those that only use kinematics of the contralateral forelimb, ipsilateral forelimb, both forelimbs or the head to predict spiking activity of putative SPNs (left) and FSIs (right) in the DLS (red, n=492 SPNs and 164 FSIs from 3 rats) and DMS (green, n=213 SPNs and 123 FSIs from 3 rats). Boxes denote 1st, 2nd (median) and 3rd quartiles, while whiskers show the 5th and 95th percentile of the distribution. p<1e-4 for all encoding comparisons between SPNs in DLS and DMS, and p=1e-4, 6e-3, 0.49, 4e-3, 1e-4 for comparisons between FSI encoding in the DLS and DMS of all effectors, contra-, ipsi-, both forelimbs and head, respectively. P-values measure the probability that the two datasets have the same mean and are estimated by bootstrapping difference in means (n=1e4 bootstraps).
Extended Data Fig. 6
Extended Data Fig. 6. Characterization of task performance and DLS representations after motor cortex lesion.
A. Comparison of performance measures before and after motor cortex (MC) lesion (n=3). IPI: Inter-Press Interval, CV of IPI: Coefficient of Variation of the IPI, IPI close to target: Fraction of trials close to target IPI (700 ms ± 20%), ITI: Inter-Trial Interval. Pre-Lesion: last 2,000 trials before lesion, post-Lesion: first 2,000 trials after lesion. Dots indicate individual animals and bars show means ± SEM. For statistical details see Supplementary Table 7. B. (Top) Comparing task-aligned activity statistics, including average firing rate during the trial-period (p=0.09), maximum modulation of Z-scored firing rate during the trial-period (p<1e-4), sparseness index (p=0.02) and average trial-to-trial correlation of task-aligned spiking (p<1e-4), between putative SPNs recorded in the intact (red, n=683, replotted from Fig. 2C) and MC-lesioned (blue, n=379) DLS. (Bottom) Average firing rate during the trial-period (p=0.01), maximum modulation of Z-scored firing rate during the trial-period (p=5e-4), sparseness index (p=0.08) and average trial-to-trial correlation of task-aligned spiking (p=0.05) in putative FSIs recorded in the intact (red, n=171, replotted from Extended Data Fig. 2B) and MC-lesioned (blue, n=153) DLS. Bars and error-bars represent mean and SEM, respectively, across units. P-values measure the probability that two datasets have the same mean and are computed by bootstrapping difference in means (n=1e4 bootstraps). C. Goodness of fit, measured by pseudo-R2, for encoding models that use kinematics of all tracked effectors and those that only use kinematics of the contralateral forelimb, ipsilateral forelimb, both forelimbs or the head to predict spiking activity of putative SPNs (left) and FSIs (right) in the DLS of intact (red, n=492 SPNs and 164 FSIs from 3 rats, replotted from Extended Data Fig. 5B) and MC-lesioned (blue, n=279 SPNs and 169 FSIs from 3 rats) animals. Boxes denote 1st, 2nd (median) and 3rd quartiles, while whiskers show the 5th and 95th percentile of the distribution. p<1e-4, =4e-3, <1e-4, <1e-4 for comparisons between SPN encoding in the intact and MC-lesioned DLS of all effectors, contra-, ipsi-, both forelimbs and head, respectively. p=0.04, 0.66, 0.04, 0.04 for comparisons between FSI encoding in the intact and MC-lesioned DLS of all effectors, contra-, ipsi-, both forelimbs and head, respectively. P-values measure the probability that the two datasets have the same mean and are estimated by bootstrapping difference in means (n=1e4 bootstraps).
Extended Data Fig. 7
Extended Data Fig. 7. Task performance after DLS, but not DMS, lesions is impaired, resembles performance early in training, and does not recover.
Comparison of performance measures at different stages before and after lesions of DLS (n=7 rats), DMS (n=5), and control injections (n=5). IPI: Inter-Press Interval, CV of IPI: Coefficient of Variation of the IPI, IPI close to target: Fraction of trials close to target IPI (700 ms ± 20%), ITI: Inter-Trial Interval. Early: first 2,000 trials in training, pre-lesion: last 2,000 trials before lesion, post-lesion: first 2,000 trials after lesion, late: trials 10,000 to 12,000 after lesion. Presses/session: Average number of lever-presses per session. Early: first 10 sessions in training, pre-lesion: last 20 sessions before lesion, post-lesion: first 20 sessions after lesion, late: sessions 50 to 70 after lesion. Dots indicate individual animals and bars show mean ± SEM. For statistical details see Supplementary Table 8. *p < 0.05, **p < 0.01, ***p < 0.001.
Extended Data Fig. 8
Extended Data Fig. 8. Lesions of the GPi/EP affect task performance similarly to DLS lesions.
A. Representative example of the effect of a GPi (EP) lesion on task performance. Left: Example histological image of a unilateral GPi lesion, showing the comparison between the lesioned and the intact GPi. Experimental animals underwent bilateral GPi lesions (see Methods). Right: IPIs and ITIs for an example animal early in training, before and after bilateral GPi lesion. Population data shown in panel B. B. GPi lesions (n=5 rats) have long-lasting effects on various measures of performance (cf. Extended Data Fig. 7). DLS performance as shown in Extended Data Fig. 7, here shown for comparison. Dots indicate individual animals and bars show mean ± SEM. C. Left: Example distributions of IPI and ITI interval lengths early in training, and before and after GPi lesion. D. JS Divergence of IPI and ITI distributions for all GPi-lesioned animals (n=5 rats). Dots indicate individual animals and bars show mean ± SEM. For statistical details see Supplementary Table 9. *p < 0.05, **p < 0.01.
Extended Data Fig. 9
Extended Data Fig. 9. DLS lesions do not affect lever-press vigor, but lead to regression to a common lever-pressing behavior.
A. Comparison of mean and peak lever-press speeds before and after DLS lesion (see Fig. 8). Speeds were averaged over 1st and 2nd lever-presses. Dots indicate individual animals and bars show mean ± SEM. No significant differences were detected. For statistical details see Methods. B. The comparison of 1st and 2nd lever-presses across animals early in training and after DLS lesion (see Fig. 8C) was extended to additional animals. The post-lesion lever-presses of the 2 DLS-lesioned animals which were not included in Fig. 8C (due to lack of trajectories for the early presses) were added. In addition, the trajectories of the early lever-presses of 2 of the DMS-lesioned animals (shown in Fig. 7) were added. The remaining animals were re-plotted from Fig. 8C. (Column 1) Forelimb movement trajectories for the 1st and 2nd presses early in training (green) and after DLS lesion (red), overlaid for all tracked animals (early in training: DLS-lesioned animals n=4, DMS-lesioned animals n=2; post-lesion: DLS-lesioned animals n=6). (Column 2) Pairwise correlations between press trajectories of all animals early in training and after DLS lesion. Shown are average trial-to-trial correlations across individual presses (animal 1 press 1, animal 1 press 2, etc.). (Column 3) Averages of across animal correlations per condition. Shown are correlations between all presses early, all presses after DLS lesion and between all presses early and all presses after lesion (early-post). Mean ± SEM. For statistical details see Supplementary Table 10. ***p < 0.001.
Extended Data Fig. 10
Extended Data Fig. 10. Small lesions of the DLS affect performance and movement kinematics but do not, in contrast to large DLS lesions, cause animals to revert to species-typical lever-pressing behaviors.
A. Fraction of DLS lesioned. Red: Animals with large DLS lesions, included in Figs. 6–8. Yellow: Animals with small DLS lesions (excluded from prior analysis). B. Average performance across animals (large DLS lesions n=7 rats; small DLS lesions n=3, Control n=5), normalized to pre-manipulation performance. Fraction of trials with IPIs close to target (700 ms ± 20%). Shading represents SEM. Partially replotted from Fig. 6B. C. Comparison of average forelimb trajectories (vertical position) before and after small DLS lesions for all animals (from trials within a range of mean IPI ± 30 ms). The forelimb performing the 1st lever-press is regarded dominant (n=3 rats). D. Forelimb vertical displacement in randomly selected trials (200 per animal) of all animals before and after small DLS lesions. Trials are sorted by IPI and normalized to minimum and maximum displacement for each animal. Black lines mark the 1st, grey lines the 2nd lever-press. E. Pairwise correlations between trials shown in D, averaged per animal. F. Averages of correlations shown in E by condition (averages of all pre-to-pre, post-to-post and pre-to-post correlations). Mean ± SEM. G. Distributions of correlation coefficients between individual forelimb trajectories before (blue) and after (black) small DLS lesion, and the animal’s pre-lesion modes (see Methods). Probability distributions were computed for each rat and then averaged (n=3). Fraction of trials with correlations >0.85 (Mean ± SEM): pre 0.53 ± 0.24, pre-post 0 ± 0. H. Comparison of forelimb trajectories associated with 1st and 2nd lever-presses across animals with large and small DLS lesions. Pairwise correlations between press trajectories of animals early in training, of animals after large (replotted from Extended Data Fig. 9B) and of animals after small DLS lesions. Shown are average trial-to-trial correlations across individual presses (animal 1 press 1, animal 1 press 2, etc.) (n=6 rats early, n=6 large DLS lesions (partially overlapping, see Extended Data Fig. 9B), n=3 small DLS lesions). I. Averages of across animal correlations for selected conditions. Left: correlations between all presses early (dark green dotted square in H) and all presses after large DLS lesions (dark red dotted square in H) as in Extended Data Fig. 9B. Right: correlations between all presses early and all presses after small DLS lesions (small-early; light green dotted square in H) and between all presses after large DLS lesions and all presses after small DLS lesions (small-post; light red dotted square in H). All comparisons show statistically significant differences with p<0.001, except the comparison small-early to small-post. Mean ± SEM. For statistical details see Supplementary Table 11.
Figure 1:
Figure 1:
A hypothesized function for the BG in specifying the detailed kinematics of learned motor skills. A. Simple schematic of the BG and how they influence motor output by modulating downstream control circuits. The BG receive state information about environment, ongoing actions and internal states from cortical and thalamic inputs. Whether and how BG influence motor output will depend on the learned mapping (orange box) between inputs carrying state information and outputs influencing control circuits in midbrain/brainstem and motor cortex (blue, cyan and light blue boxes represent actions specified in downstream control modules). These maps, or ‘policies’, are acquired through a process of reinforcement learning and encode relationships between states and actions that predict reward. B. Action selection: BG learn to map states to actions and generate output patterns that help initiate a particular action (a1 or a2) (pre-specified in downstream circuits, blue boxes) in each state (red/purple arrows). C. Vigor modulation: Similarly, BG can learn to generate output that alters the gain (g), or ‘vigor’, of an action specified in downstream circuits in a state-dependent manner. Two scenarios are sketched out for low (gL) and high (gH) gain respectively. D. Kinematic control: A putative ‘control’ function for the BG tested in this study. This model assumes that BG output can influence motor output in spatiotemporally precise ways by interacting with downstream controllers, and that BG can learn and store ‘kinematic policies’ that specify novel adaptive movements and actions. This model requires the BG to associate incoming state information and outgoing activity patterns on a much finer timescale and with more specificity than assumed for prior models. E. Behavioral paradigm to probe the BG’s role in motor skill execution. Rats are rewarded for pressing a lever twice with a specific target interval (inter-press interval - IPI). After unsuccessful trials, animals can only initiate a new trial after refraining from pressing the lever for a given inter-trial interval (ITI). F. Over the course of training, animals develop stereotyped movement patterns to solve the task. These learned behaviors are preserved in largely unaltered form after motor cortex lesions. Shown are forelimb trajectories in the vertical dimension from four randomly selected trials in each condition.
Figure 2:
Figure 2:
Units in DLS, but not DMS, are strongly modulated throughout the execution of a learned motor skill. A. Simplified schematic of the motor circuits relevant to this study. The BG can affect the execution of learned behaviors by influencing motor cortex through the cortico-BG-thalamo-cortical loop, and/or via direct projections to brainstem and midbrain motor centers. The dorsolateral (DLS) and dorsomedial (DMS) striatum define the sensorimotor and associative arms of the BG, respectively. B. (Top) Schematic of multi-tetrode array recordings from DLS (left) and DMS (right) in behaving animals. (Bottom) Spike rasters of 7 simultaneously recorded putative spiny projection neurons (SPNs) and 2 putative fast spiking interneurons (FSIs) from the DLS and DMS, shown over 10 trials, aligned to the 1st lever-press. Grey shaded region indicates mean inter-press period for the example session. C. Comparing task-aligned activity statistics, including average firing rate during the trial-period (p=0.19), maximum modulation of Z-scored firing rate during the trial-period (p<1e-4), sparseness index (p<1e-4) and average trial-to-trial correlation of task-aligned spiking (p<1e-4), between putative SPNs recorded in the DLS (red, n=683) and DMS (green, n=283) of 3 rats. Bars and error-bars represent mean and SEM, respectively, across units. P-values measure the two-sided probability that two datasets have the same mean and are computed by bootstrapping difference in means (n=1e4). D. Peri-event time histograms (PETHs) of Z-scored activity of SPNs recorded in DLS (left) and DMS (right) of example rats during execution of a representative sequence mode (see also Extended Data Fig. 4). Units have been sorted by the time of their peak activity, in a cross-validated manner. The sorting index, calculated from PETHs from half the trials for each unit, was used to sort PETHs from the remaining trials. Triangles indicate time of the second lever-press. E. Z-scored firing rates averaged over populations of SPNs (top) and FSIs (bottom) recorded in DLS (left, red) and DMS (right, green). Thin, shaded dashed lines represent averages across sequence modes for individual rats, and thick, solid line indicates the grand average across rats (n=3 per group). Colored shading represents SEM across rats. Grey shaded region represents the target inter-press interval.
Figure 3:
Figure 3:
Ensemble unit activity in the DLS reflects continuous kinematics of the learned movement patterns. A. Comparison between trial-aligned trajectories of the forelimbs (ipsi- and contra-lateral to the recording site) and head of an example rat when performing two distinct sequence modes (color-coded, see Methods and Extended Data Fig. 4). Data is presented as mean ± SD across trials. Symbols indicate time of the 1st (circle) and 2nd (triangle) lever-presses and times at which the trajectories of distinct modes are first (square, see panel C) and most (star) discriminable. Inset shows zoom-in of representative single-trial trajectories (contralateral forelimb, vertical component) around the time of the choice-point. B. Mode-specific movement trajectories of the example rat projected into the subspace defined by the top three principal components of trajectories of both forelimbs and the head. Symbols as in A. Arrows indicate flow of time. C. (Black line) Discriminability between the movement trajectories of the two modes shown in panels A-B by a quadratic classifier over time in the trial. (Red line) Distance between mode-specific neural trajectories over time in the trial, Z-scored by the time-varying distance between trajectories computed within the same mode (see Methods). Symbols as in A. D. Trial-averaged activity patterns (PETHs) of 9 example DLS units during execution of the two sequence modes. Symbols as in A. E. Mode-specific neural trajectories of ensemble unit activity in the DLS of an example rat plotted in the subspace defined by the top three principal components. Symbols as in A. F. Average Z-scored distances between neural trajectories corresponding to pairs of modes at different points in the behavior. Lines indicate neural distances averaged across all mode-pairs within each rat and then across rats (n=3). Grey shading represents the 95% confidence interval, corrected for multiple comparisons, of the distribution of Z-scored distances expected by chance if these events occurred at random times within the learned behavior (n=1e4 permutations). G. Correlation coefficient (indicated by red dashed line) between trajectory discriminability of pairs of sequence modes and the Z-scored neural distance between their ensemble representations in the DLS (see panel C), averaged across mode-pairs and then across rats (n=3). Grey histogram shows the statistic distribution under the null hypothesis (no relationship between the variables) computed by randomization (n=1e4 permutations), and p-value quantifies the two-sided probability that this explains the data.
Figure 4:
Figure 4:
DLS, but not DMS, encodes detailed task-related movement kinematics. A-B. Trial-by-trial covariation of movement kinematics and neural activity during a representative behavioral session for an example rat. Time of 2nd lever-press is indicated by black triangles and red lines. A. Trajectories of the contralateral (top) and ipsilateral (middle) forelimbs and the head (bottom) on individual trials in the session. Trials are sorted by the inter-press interval and belong to the same sequence mode. B. Raster plots showing spiking activity of 3 example SPNs (middle) and FSIs (right) on the same trials. C-D. Encoding analyses. C. Schematic of encoding analysis. Generalized linear models were used to measure the degree to which kinematic state-related (position) and action-related (velocity, acceleration) variables (top) predict spiking of individual striatal units (bottom left). Light and dark shades indicate horizontal and vertical components of movement, respectively. (Bottom right) Observed (left) and predicted (right) spike counts of an example SPN. Arrows indicate example trial shown on the bottom left. D. Goodness of fit, measured by pseudo-R2 (see Methods), for encoding models that use detailed kinematic information about position (Pos.), velocity (Vel.) and acceleration (Acc.), or a combination of these (All Kin.), to predict the time-varying, trial-by-trial activity of putative SPNs (top) and FSIs (bottom) recorded in DLS (red, n=492 SPNs and 164 FSIs from 3 rats) and DMS (green, n=213 SPNs and 123 FSIs from 3 rats). Boxes denote 1st, 2nd (median) and 3rd quartiles, while whiskers show the 5th and 95th percentile of the pseudo-R2 distributions. p<1e-4 for all encoding comparisons between SPNs in DLS and DMS, and p=1e-4, 2.4e-3, 1.8e-3, 0.016 between FSI encoding in the DLS and DMS of all kinematic, position, velocity and acceleration variables, respectively. Pseudo-R2 is measured on trials (25%) not used for training the encoding models. p-values measure the probability that the two datasets have the same mean and are estimated by bootstrapping difference in means (n=1e4 bootstraps). E-G. Decoding analyses. E. Schematic of decoding analysis. A feedforward neural network predicted the velocity (horizontal and vertical components) of the forelimbs and head from the spiking activity of groups of simultaneously recorded striatal units. F. (Top) Vertical component of velocity of the contralateral forelimb for all trials in a representative session for a DLS- (left) and DMS-implanted (right) rat. Trials are aligned to the first lever-press and sorted by the inter-press interval. (Bottom) Cross-validated velocity predictions of the neural network decoder. G. Cross-validated accuracy with which instantaneous velocity can be decoded by a neural network decoder from spiking activity of groups of DLS (red) or DMS (green) units, quantified by the fraction of variance in the observed velocity explained by the predictions (R2). Decoding accuracy was averaged over all sessions within individual rats (thin lines) and then across rats in each group (thick lines; n=3 each). For a subset of rats with larger recording yields, we extended the analysis to groups of 15 units (n=2 each). Data is presented as mean ± SEM across rats. p=0.03 for comparison between decoding of velocity from 10 units in DLS and DMS rats by 2-sided Kolmogorov-Smirnov test.
Figure 5:
Figure 5:
Kinematic encoding in DLS is independent of motor cortex. A. (Top) Schematic shows recording targeting the DLS of a motor cortex (MC)-lesioned rat. (Bottom) Trial-aligned spike rasters for 7 simultaneously recorded putative SPNs and 2 putative FSIs over 10 trials. Grey shaded region indicates mean inter-press period for the example session. B. Z-scored PETHs for SPNs recorded in the DLS of an example MC-lesioned rat. Units are sorted by the time of peak activity, in a cross-validated manner. Triangles indicate time of the 2nd lever-press. C. Z-scored firing rates averaged over all SPNs (top) and FSIs (bottom) recorded in the DLS of MC-lesioned rats. Thin, shaded dashed lines represent averages across sequence modes for individual rats, and thick, solid line indicates the grand average across rats (n=3). Blue shading represents SEM across rats. Grey shaded region represents the target inter-press interval. D. Accuracy of encoding models that use detailed kinematic information about position, velocity and acceleration, or a combination of all these, to predict the time-varying, trial-by-trial activity of putative SPNs (top) and FSIs (bottom) recorded from the DLS in intact (red, n=492 SPNs and 164 FSIs from 3 rats, replotted from Fig. 4D) and MC-lesioned rats (blue, n=279 SPNs and 169 FSIs from 3 rats). Boxes denote 1st, 2nd (median) and 3rd quartiles, while whiskers show the 5th and 95th percentile of the pseudo-R2 distributions. p<1e-4 for all encoding comparisons between SPNs in intact and MC-lesioned rats, and p=9e-4, 0.28, 0.09, 0.01 for comparisons between FSI encoding in intact and MC-lesioned DLS for all kinematic, position, velocity and acceleration variables, respectively. p-values measure the probability that the two datasets have the same mean and are estimated by bootstrapping difference in means (n=1e4 bootstraps). E. (Top) Vertical component of velocity of the contralateral forelimb for all trials in a representative session for a DLS-implanted MC-lesioned rat. Trials are aligned to the 1st lever-press and sorted by the inter-press interval. (Bottom) Cross-validated predictions of instantaneous velocity by a neural network decoder from the co-incident activity of all simultaneously recorded units. F. Cross-validated accuracy (fraction of explained variance: R2) with which instantaneous velocity can be decoded by a neural network decoder from groups of DLS units recorded in intact (red, replotted from Fig. 4G) and MC-lesioned (blue) rats. Decoding accuracy was averaged over all sessions within individual rats (thin lines) and then across rats in each group (thick lines; n=3 each). For a subset of rats with larger recording yields, we extended the analysis to groups of 15 units (n=2 intact and n=3 MC-lesioned rats). Data is presented as mean ± SEM across rats. p=0.97 for comparison between decoding of velocity from 10 DLS units in intact and MC-lesioned rats by 2-sided Kolmogorov-Smirnov test.
Figure 6:
Figure 6:
Lesions of DLS, but not DMS, degrade the performance in our timed lever-pressing task. A. Representative examples of performance in the timed lever-pressing task (see Fig. 1E) in animals subjected to different manipulations (DLS lesion, DMS lesion, DLS control injection). (Left) Histological images of the manipulations. (Right) Heatmaps of the probability distributions of IPIs and ITIs for the example animals early in training, and before and after the manipulations. Population data shown in panel B. B. Average performance across animals (DLS n=7 rats; DMS n=5, Control n=5) for manipulations as in A, normalized to performance before the manipulation. (Left) Fraction of trials with IPIs close to the target (700 ms ± 20%). (Right) Fraction of trials with ITIs above the threshold of 1.2 s. Shading represents SEM. C. Distributions of interval lengths between lever-presses for the animals shown in A early in training, and before and after the manipulations. D. Dissimilarity between the IPI and ITI distributions across animals early in training, and before and after the manipulations. Shown is the Jensen-Shannon (JS) divergence as a measure of dissimilarity, with lower values indicating higher overlap between the two interval distributions. Dots represent individual animals (DLS n=7, DMS n=5, Control n=5), bars represent mean ± SEM. For statistical details see Supplementary Table 4. **P < 0.01, ***P < 0.001.
Figure 7:
Figure 7:
Lesions of DLS, but not DMS, lead to loss of idiosyncratic learned movement patterns and regression to lever-pressing behaviors common across animals. A. Within animal comparison of forelimb trajectories associated with the task before and after DLS lesions. (Row 1) Average forelimb trajectories (vertical position) of an example rat before and after DLS lesion (calculated from trials within a range of mean IPI ± 30 ms). Black arrows indicate the 1st press, grey arrows the 2nd press. The forelimb performing the 1st lever-press is regarded as dominant. (Row 2) Vertical forelimb displacement in individual trials before and after DLS lesion for both limbs, sorted by IPI and normalized to minimum and maximum displacement. Black lines mark the 1st, grey lines the 2nd press. (Row 3) Pairwise correlations of the forelimb trajectories in row 2 after linear time-warping of the trajectories to a common time-base (see Methods). (Row 4) Averages of within animal correlations as shown in row 3 across animals (n=6 rats) by condition (averages of all pre-to-pre, post-to-post and pre-to-post correlations). Dots indicate individual animals, bars show mean ± SEM. For statistical details for all panels see Supplementary Table 5. *P < 0.05, **P < 0.01. B. Same as A, but for DMS lesions (n=5 rats). C. Comparison of forelimb trajectories across animals before and after DLS lesion. (Row 1) Comparison of average trajectories (as in A) of all animals before and after DLS lesion (n=6 rats, blue and red shades indicate individual animals). (Row 2) Forelimb displacement in randomly selected trials (80 per animal) of all animals before and after DLS lesion for dominant and non-dominant forelimbs, sorted by IPI and normalized to minimum and maximum displacement for each animal. Black lines mark the 1st lever-press, grey lines the 2nd press. (Row 3) Pairwise correlations between the trials shown in row 2, averaged per animal. (Row 4) Averages of the correlations shown in row 3 by condition (averages of all pre-to-pre, post-to-post and pre-to-post correlations). Mean ± SEM. ***P < 0.001. D. Similar to C, but for DMS lesions (n=5 rats). E. Distributions of correlation coefficients between individual forelimb trajectories before (blue) and after (black) DLS lesion, and the animal’s pre-lesion modes (see Methods). Probability distributions were computed for each rat and then averaged (n=6). Fraction of trials with correlations >0.85 (Mean ± SEM): pre 0.58 ± 0.1, pre-post 0 ± 0. F. Similar to E, but for DMS lesions (n=5 rats). Fraction of trials with correlations >0.85 (Mean ± SEM): pre 0.51 ± 0.08, pre-post 0.53 ± 0.14.
Figure 8:
Figure 8:
DLS lesions cause a loss of idiosyncratic learned lever-press movements and regression to movements common across animals and similar to presses early in learning. A. Comparison of 1st and 2nd lever-presses within animals before and after DLS lesion. (Column 1) Average movement trajectories for the 1st and 2nd press before and after DLS lesion in an example animal (same as the animal shown in Fig. 7A). Black and grey arrows indicate the time of the 1st and 2nd press, respectively. (Column 2) Pairwise correlations between lever-presses of the example animal before and after DLS lesion. (Column 3) Averages of within animal correlations across animals (n=6 rats) and conditions. Shown are correlations between forelimb trajectories before and after DLS lesion between the same presses (Intra-Press: 1st to 1st and 2nd to 2nd) and between different presses (Inter-Press: 1st to 2nd). Also shown are correlations between the before and after lesion conditions (All) across all 1st and 2nd presses. Dots indicate individual animals, bars show mean ± SEM. For statistical details for all panels see Supplementary Table 6.*P < 0.05, **P < 0.01. B. Comparison of 1st and 2nd lever-presses across animals before and after DLS lesions. (Column 1) Forelimb movement trajectories for the 1st and 2nd press before and after DLS lesion, overlaid for all tracked animals (n=6 rats, blue and red shades indicate individual animals). (Column 2) Pairwise correlations between press trajectories of all animals before and after DLS lesion. Shown are average trial-to-trial correlations across individual presses (animal 1 press 1, animal 1 press 2, etc.). (Column 3) Averages of across animal correlations per condition. Shown are correlations between all presses before and all presses after DLS lesion. Also shown are correlations between all presses before and all presses after lesion (pre-post). Mean ± SEM. ***P < 0.001. C. Comparison of 1st and 2nd lever-presses across animals early in training and after DLS lesion. (Column 1) Forelimb movement trajectories for the 1st and 2nd presses early in training (green) and after DLS lesion (red, replotted from panel B), overlaid for all tracked animals (n=4 rats, subsample of rats in B, for which trajectories were available early in training). (Column 2) Pairwise correlations between press trajectories of all animals early in training and after DLS lesion. Shown are average trial-to-trial correlations across individual presses (animal 1 press 1, animal 1 press 2, etc.). (Column 3) Averages of across animal correlations per condition. Shown are correlations between all presses early and all presses after DLS lesion. Also shown are correlations between all presses early and all presses after lesion (Early-post). Mean ± SEM.

References

    1. Krakauer JW, Hadjiosif AM, Xu J, Wong AL & Haith AM Motor Learning. Compr. Physiol 9, 613–663 (2019). - PubMed
    1. Stephenson-Jones M, Samuelsson E, Ericsson J, Robertson B & Grillner S Evolutionary conservation of the basal ganglia as a common vertebrate mechanism for action selection. Curr. Biol. CB 21, 1081–1091 (2011). - PubMed
    1. Dudman JT & Krakauer JW The basal ganglia: from motor commands to the control of vigor. Curr. Opin. Neurobiol 37, 158–166 (2016). - PubMed
    1. Graybiel AM & Grafton ST The Striatum: Where Skills and Habits Meet. Cold Spring Harb. Perspect. Biol 7, a021691 (2015). - PMC - PubMed
    1. Barnes TD, Kubota Y, Hu D, Jin DZ & Graybiel AM Activity of striatal neurons reflects dynamic encoding and recoding of procedural memories. Nature 437, 1158–1161 (2005). - PubMed

Publication types