. 2021 Jun 29:12:676314.
doi: 10.3389/fmicb.2021.676314. eCollection 2021.

Meta-Analysis and Structural Dynamics of the Emergence of Genetic Variants of SARS-CoV-2

Affiliations

Meta-Analysis and Structural Dynamics of the Emergence of Genetic Variants of SARS-CoV-2

Nicolas Castonguay et al. Front Microbiol. .

Abstract

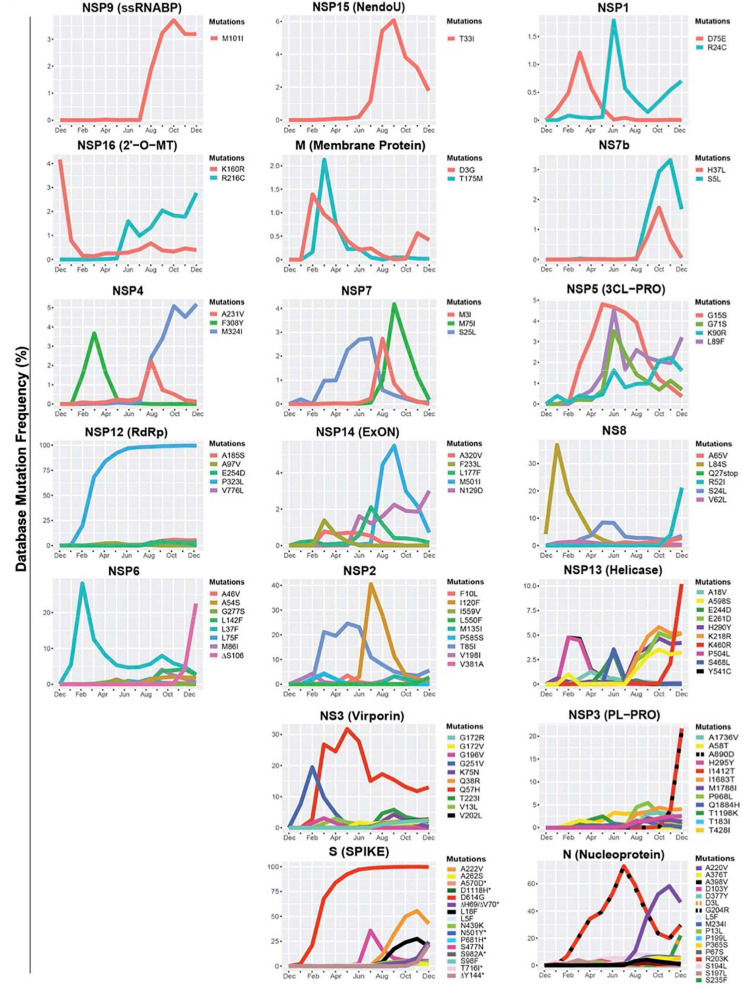
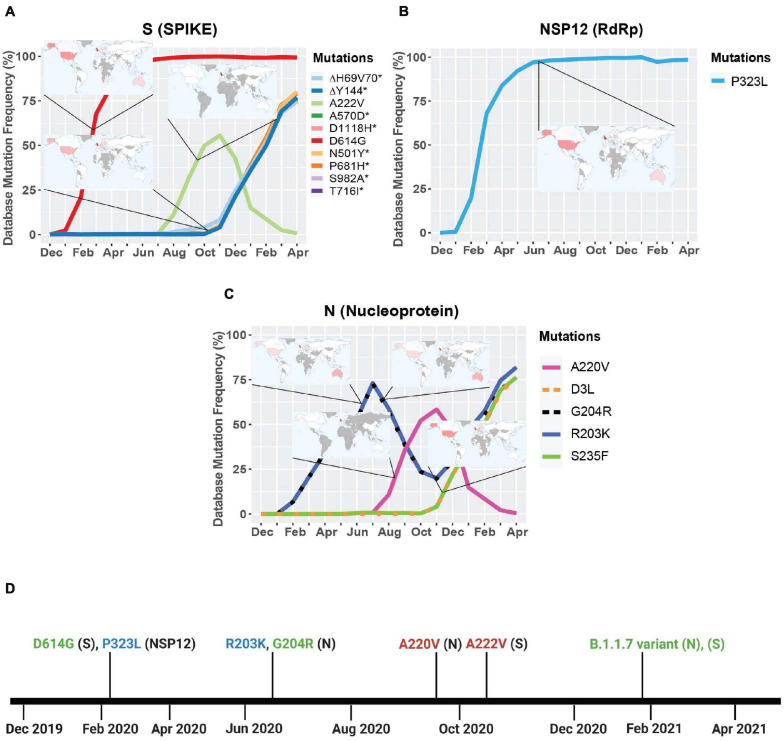
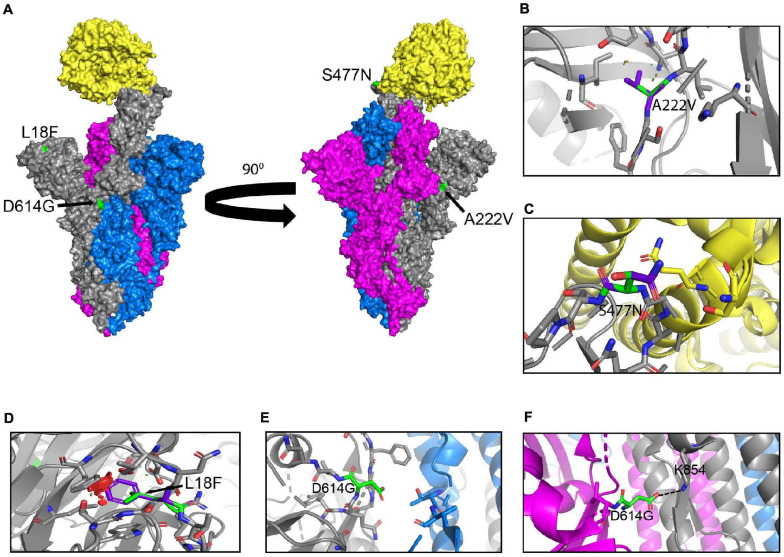
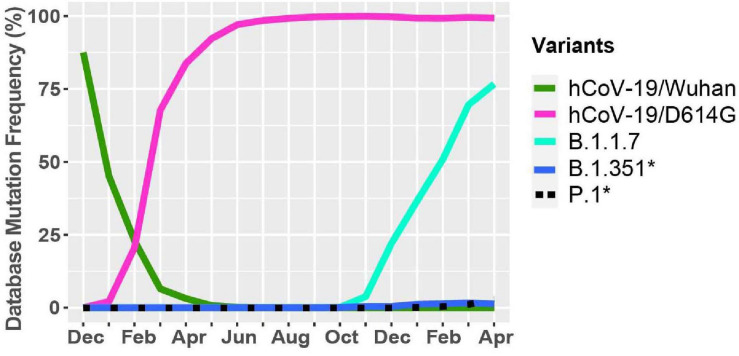
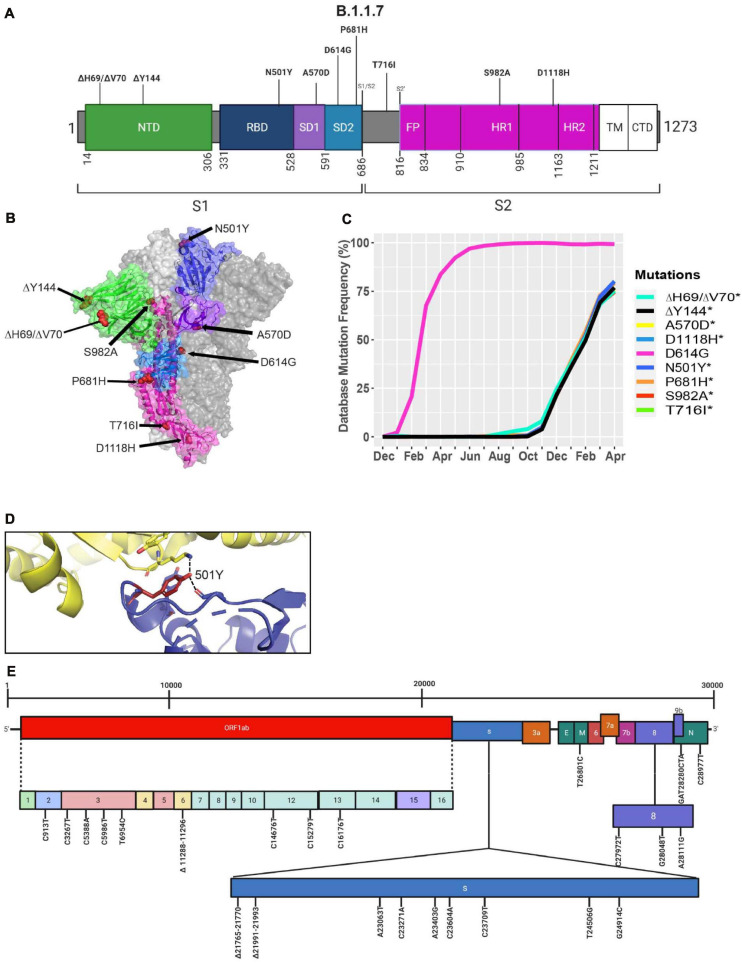
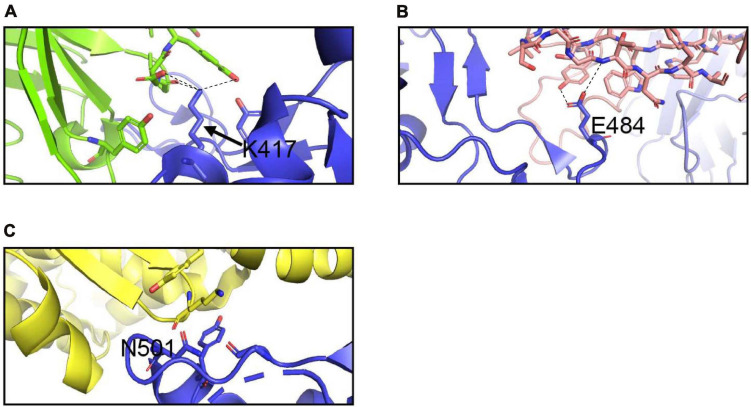
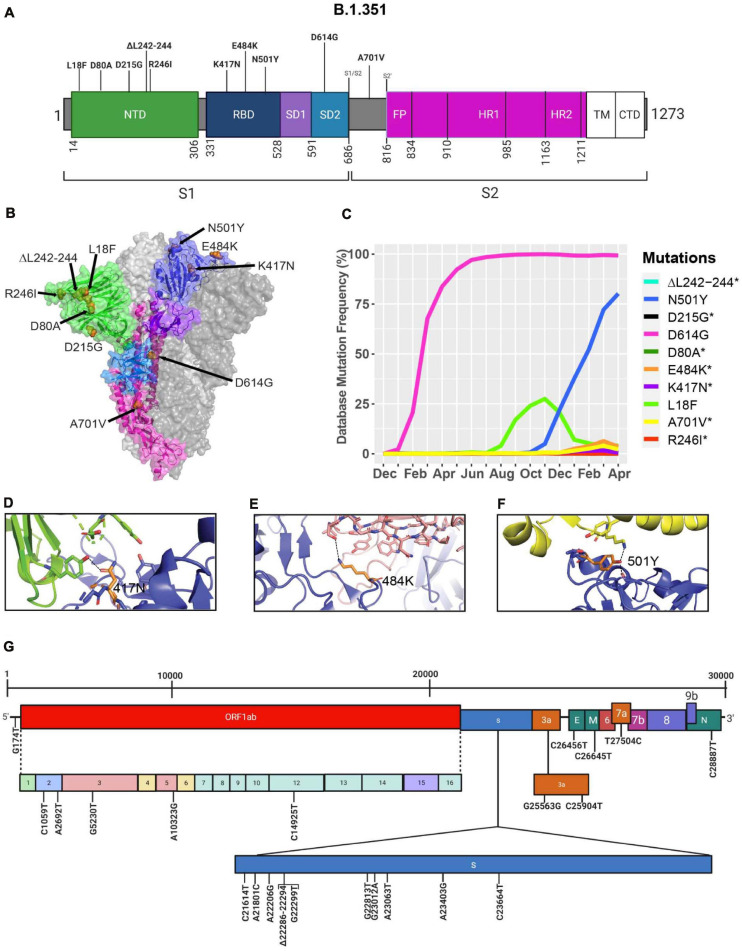
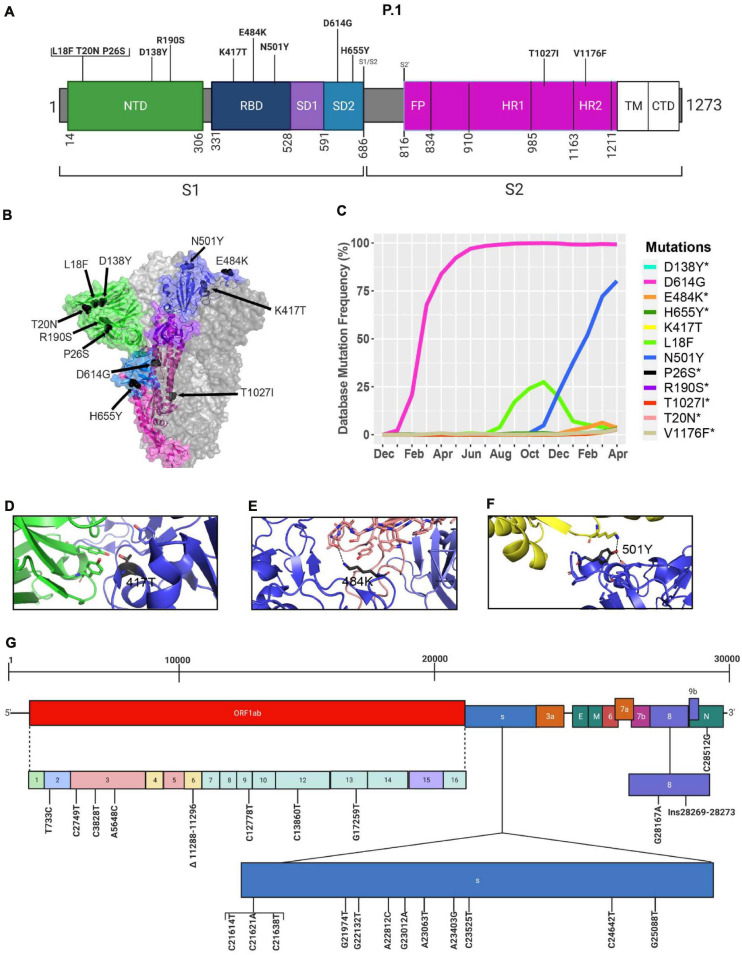
The novel severe acute respiratory syndrome coronavirus 2 (SARS-CoV-2) emerged in late December 2019 in Wuhan, China, and is the causative agent for the worldwide COVID-19 pandemic. SARS-CoV-2 is a positive-sense single-stranded RNA virus belonging to the betacoronavirus genus. Due to the error-prone nature of the viral RNA-dependent polymerase complex, coronaviruses are known to acquire new mutations at each cycle of genome replication. This constitutes one of the main factors driving the evolution of its relatively large genome and the emergence of new genetic variants. In the past few months, the identification of new B.1.1.7 (United Kingdom), B.1.351 (South Africa), and P.1 (Brazil) variants of concern (VOC) has highlighted the importance of tracking the emergence of mutations in the SARS-CoV-2 genome that impact transmissibility, virulence, and immune and neutralizing antibody escape. Here we analyzed the appearance and prevalence trajectory over time of mutations that appeared in all SARS-CoV-2 genes from December 2019 to April 2021. The goal of the study was to identify which genetic modifications are the most frequent and study the dynamics of their propagation, their incorporation into the consensus sequence, and their impact on virus biology. We also analyzed the structural properties of the spike glycoprotein of the B.1.1.7, B.1.351, and P.1 variants for its binding to the host receptor ACE2. This study offers an integrative view of the emergence, disappearance, and consensus sequence integration of successful mutations that constitute new SARS-CoV-2 variants and their impact on neutralizing antibody therapeutics and vaccines.

Keywords: B.1.1.7 variant; B1.351 variant; COVID-19; Coronavirus; P.1 variant; SARS-CoV-2; evolution; variants.


Conflict of interest statement

The authors declare that the research was conducted in the absence of any commercial or financial relationships that could be construed as a potential conflict of interest.

Figures

FIGURE 1
FIGURE 1
Variations in mutations and mutation frequencies in severe acute respiratory syndrome Coronavirus 2 (SARS-CoV-2) genes. The occurrence and frequency of mutations in various SARS-CoV-2 genes are presented for the period between December 2019 and January 1, 2021. Plotted are mutations that reached at least a 1% worldwide frequency. SARS-CoV-2 genes are represented with the function of the genes in parentheses. Graphs were generated using RStudio. *Overlapping curves.
FIGURE 2
FIGURE 2
Geographic location and timeline of dominant mutations in NSP12, S, and N genes. (A) Frequency of S protein mutations with corresponding geographic maps. (B) Frequency of RdRp mutations with corresponding geographic maps. (C) Frequency of nucleoprotein mutations with corresponding geographic maps. (D) Timeline of the appearance of mutations reaching a frequency higher than 50% worldwide between December 2019 and April 2021. For the geomaps: a low frequency of reported cases of the mutations is represented in white, while higher frequencies are represented from pink to red, and gray represents no data. All maps were taken from Global Initiative on Sharing Avian Influenza Data (GISAID). Graphs were generated using RStudio and Biorender. *Overlapping curves.
FIGURE 3
FIGURE 3
Structural rendering of the most frequent mutations in the S protein. (A) Surface representation of human angiotensin-converting enzyme 2 (hACE2) (yellow) in complex with S protein trimers illustrated in gray, blue, and magenta. Interactions of high frequency mutations are presented as follows: (B) A222V, (C) S477N, (D) L18F, (E) D614G in the open conformation, and (F) D614G in the closed conformation. Reference sequence residues are illustrated in green, and the mutated amino acid is represented in purple. The red markers illustrate the steric clash when the mutations are inserted into the structure. Graphs were generated using PyMOL.
FIGURE 4
FIGURE 4
Worldwide frequency of B.1.1.7, B.1.351, P.1 and D614G variants. Database variants frequency were analyzed from December 2019 to April 30, 2021. hCoV-19/Wuhan is the original reference strain and hCoV-19/D614G is the current reference strain containing the D614G mutation in the S protein. B.1.1.7, B.1.351, and P.1 represent the United Kingdom, South African, and Brazilian variants. *Overlapping curves.
FIGURE 5
FIGURE 5
Analysis of mutations in the B.1.1.7 variant. (A) Mutation map of the spike protein of B.1.1.7. (B) Structural representation of spike with ACE2. B.1.1.7 S protein mutations are presented in red. N-terminal domain (NTD) (green), receptor-binding domain (RBD) (blue), SD1 (purple), subdomain 2 (SD2) (light blue), and S2 (magenta) are illustrated. The other S protein monomers are displayed in gray and white. (C) Frequency of the mutations in the S protein, B.1.1.7 variant from December 2019 to April 30, 2021. (D) Interaction of the N501Y (red) mutation in the RBD (blue) of S protein with hACE2 (yellow). The dash lines indicate interactions with adjacent residues. (E) Genome of the SARS-CoV-2 B.1.1.7 variant with identified nucleotide substitutions and deletions. Graphs were generated using Biorender, PyMOL, and RStudio. *Overlapping curves.
FIGURE 6
FIGURE 6
Interactions of K417, E484, and N501 of the S protein with neutralizing antibodies and hACE2. (A) Interaction of K417 (blue) with C102 Nab (green) residues. (B) Interaction of E484 (blue) with C121 Nab (light pink). (C) Interaction of N501 (blue) with hACE2 (yellow) Dashes lines indicate interactions between residues. The graphs were generated using PyMOL.
FIGURE 7
FIGURE 7
Analysis of mutations in the B.1.351 variant. (A) Mutation map of the spike protein of B.1.351. (B) Structural representation of spike with ACE2. B.1.352 S protein mutations are presented in orange. NTD (green), RBD (blue), SD1 (purple), SD2 (light blue), and S2 (magenta) are illustrated. The other S protein monomers are illustrated in gray and white. (C) Frequency of the mutations in the S protein B.1.351 variant from December 2019 to April 30, 2021. Interaction of (D) 417N with C102 Nab (green), (E) 484K with C121 Nab (light pink), and (F) 501Y with hACE2 (yellow). The mutant residues are illustrated in orange, and the dashed lines represent interactions with adjacent residues. (G) Genome of the SARS-CoV-2 B.1.351 variant with identified nucleotide substitutions or deletions. Graphs were generated using Biorender, PyMOL, and RStudio. *Overlapping curves.
FIGURE 8
FIGURE 8
Analysis of mutations in the P.1 variant. (A) Mutation map of the spike protein of P.1. (B) Structural representation of spike with ACE2. P.1 S protein mutations are presented in black. NTD (green), RBD (blue), SD1 (purple), SD2 (light blue), and S2 (magenta) are illustrated. The other S protein monomers are illustrated in gray and white. (C) Frequency of P.1 variant S protein mutations from December 2019 to April 30, 2021. Interaction of (D) 417T with C102 Nab (green), (E) 484K with C121 Nab (light pink), and (F) 501Y with hACE2 (yellow). The mutations are colored in black and interaction with adjacent residues are demonstrated by dashed lines. (G) Genome of the SARS-CoV-2 P.1 variant with identified nucleotides substitution, deletions, and insertions. Figures were generated using Biorender, PyMOL, and RStudio. *Overlapping curves.

Comment in

References

    1. Abu-Raddad L. J., Chemaitelly H., Butt A. A. (2021). Effectiveness of the BNT162b2 Covid-19 vaccine against the B.1.1.7 and B.1.351 variants. N. Engl. J. Med. 10.1056/NEJMc2104974 - DOI - PMC - PubMed
    1. Baden L. R., El Sahly H. M., Essink B., Kotloff K., Frey S., Novak R., et al. (2020). Efficacy and Safety of the mRNA-1273 SARS-CoV-2 Vaccine. N. Engl. J. Med. 384 403–416. - PMC - PubMed
    1. Barnes C. O., Jette C. A., Abernathy M. E., Dam K.-M. A., Esswein S. R., Gristick H. B., et al. (2020). SARS-CoV-2 neutralizing antibody structures inform therapeutic strategies. Nature 588 682–687. - PMC - PubMed
    1. Benton D. J., Wrobel A. G., Xu P., Roustan C., Martin S. R., Rosenthal P. B., et al. (2020). Receptor binding and priming of the spike protein of SARS-CoV-2 for membrane fusion. Nature 588 327–330. 10.1038/s41586-020-2772-0 - DOI - PMC - PubMed
    1. Chu H., Chan J. F.-W., Yuen T. T.-T., Shuai H., Yuan S., Wang Y., et al. (2020). Comparative tropism, replication kinetics, and cell damage profiling of SARS-CoV-2 and SARS-CoV with implications for clinical manifestations, transmissibility, and laboratory studies of COVID-19: an observational study. Lancet Microbe 1 e14–e23. - PMC - PubMed