. 2021 Jun 29:8:652558.
doi: 10.3389/fmed.2021.652558. eCollection 2021.

PPAR-α Agonist Fenofibrate Prevented Diabetic Nephropathy by Inhibiting M1 Macrophages via Improving Endothelial Cell Function in db/db Mice

Affiliations

PPAR-α Agonist Fenofibrate Prevented Diabetic Nephropathy by Inhibiting M1 Macrophages via Improving Endothelial Cell Function in db/db Mice

Xiaomeng Feng et al. Front Med (Lausanne). .

Abstract

Background: Diabetic nephropathy (DN) is one of the major diabetic microvascular complications, and macrophage polarization plays a key role in the development of DN. Endothelial cells regulate macrophage polarization. Peroxisome proliferator-activated receptor (PPAR)-α agonists were demonstrated to prevent DN and improve endothelial function. In this study, we aimed to investigate whether PPAR-α agonists prevented DN through regulating macrophage phenotype via improving endothelial cell function. Methods: Eight-week-old male C57BLKS/J db/m and db/db mice were given fenofibrate or 1% sodium carboxyl methylcellulose by gavage for 12 weeks. Results: Db/db mice presented higher urinary albumin-to-creatinine ratio (UACR) than db/m mice, and fenofibrate decreased UACR in db/db mice. Fibrosis and collagen I were elevated in db/db mouse kidneys compared with db/m mouse kidneys; however, they were decreased after fenofibrate treatment in db/db mouse kidneys. Apoptosis and cleaved caspase-3 were enhanced in db/db mouse kidneys compared to db/m mouse kidneys, while fenofibrate decreased them in db/db mouse kidneys. Db/db mice had a suppression of p-endothelial nitric oxide synthase (eNOS)/t-eNOS and nitric oxide (NO), and an increase of angiopoietin-2 and reactive oxygen species (ROS) in kidneys compared with db/m mice, and fenofibrate increased p-eNOS/t-eNOS and NO, and decreased angiopoietin-2 and ROS in db/db mouse kidneys. Hypoxia-inducible factor (HIF)-1α and Notch1 were promoted in db/db mouse kidneys compared with db/m mouse kidneys, and were reduced after fenofibrate treatment in db/db mouse kidneys. Furthermore, the immunofluorescence staining indicated that M1 macrophage recruitment was enhanced in db/db mouse kidneys compared to db/m mouse kidneys, and this was accompanied by a significant increase of tumor necrosis factor (TNF)-α and interleukin (IL)-1β in kidneys and in serum of db/db mice compared with db/m mice. However, fenofibrate inhibited the renal M1 macrophage recruitment and cytokines associated with M1 macrophages in db/db mice. Conclusions: Our study indicated that M1 macrophage recruitment due to the upregulated HIF-1α/Notch1 pathway induced by endothelial cell dysfunction involved in type 2 diabetic mouse renal injury, and PPAR-α agonist fenofibrate prevented DN by reducing M1 macrophage recruitment via inhibiting HIF-1α/Notch1 pathway regulated by endothelial cell function in type 2 diabetic mouse kidneys.

Keywords: HIF-1α; Notch1; PPAR-α agonists; diabetic nephropathy; endothelial function; macrophages.


Conflict of interest statement

The authors declare that the research was conducted in the absence of any commercial or financial relationships that could be construed as a potential conflict of interest.

Figures

Figure 1
Figure 1
Physical and biochemical characteristics in db/m, db/m+F, db/db, and db/db+F groups. (A) Body weight. (B) Kidney weight. (C) Food intake. (D) Fasting blood glucose level. (E) Fasting Insulin level. (F) Fasting triglycerides. (G) Fasting total cholesterol. n = 6 mice/group. #P < 0.05, vs. db/m group; &P < 0.05 vs. db/m+F group. Db/m, db/m mice without fenofibrate treatment; db/m+F, db/m mice with fenofibrate treatment; db/db, db/db mice without fenofibrate treatment; db/db+F, db/db mice with fenofibrate treatment. Data are means ± S.E.M.
Figure 2
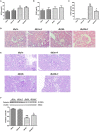
Figure 2
Renal phenotype in db/m, db/m+F, db/db, and db/db+F groups. (A) Serum creatinine (SCr). (B) Blood urea nitrogen (BUN). (C) Urinary albumin-to-creatinine ratio (UACR). (D) Representative photographs of mouse kidneys by H&E staining. (E) Representative photographs of mouse kidneys by PAS staining. (F) Representative photographs and quantification of podocin in mouse kidneys detected by western blot. n = 6 mice/group. #P < 0.05 vs. db/m group; &P < 0.05 vs. db/m+F group; *P < 0.05 vs. db/db group. Db/m, db/m mice without fenofibrate treatment; db/m+F, db/m mice with fenofibrate treatment; db/db, db/db mice without fenofibrate treatment; db/db+F, db/db mice with fenofibrate treatment. Data are means ± S.E.M.
Figure 3
Figure 3
Renal fibrosis in db/m, db/m+F, db/db, and db/db+F groups. (A–C) Representative photographs and quantification of renal fibrosis measured by Sirius red staining (A) and Masson's staining (B). (D) Representative photographs and quantification of collagen I in mouse kidneys detected by western blot. n = 6 mice/group. #P < 0.05 vs. db/m group; &P < 0.05 vs. db/m+F group; *P < 0.05 vs. db/db group. Db/m, db/m mice without fenofibrate treatment; db/m+F, db/m mice with fenofibrate treatment; db/db, db/db mice without fenofibrate treatment; db/db+F, db/db mice with fenofibrate treatment. Data are means ± S.E.M.
Figure 4
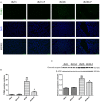
Figure 4
Renal apoptosis in db/m, db/m+F, db/db, and db/db+F groups. (A,B) Representative photographs and quantification of renal apoptosis measured by TUNEL assay. (C) Representative photographs and quantification of cleaved caspase-3 in mouse kidneys detected by western blot. n = 6 mice/group. #P < 0.05 vs. db/m group; &P < 0.05 vs. db/m+F group; *P < 0.05 vs. db/db group. Db/m, db/m mice without fenofibrate treatment; db/m+F, db/m mice with fenofibrate treatment; db/db, db/db mice without fenofibrate treatment; db/db+F, db/db mice with fenofibrate treatment. Data are means ± S.E.M.
Figure 5
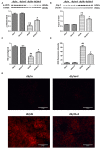
Figure 5
Endothelial function in mouse kidneys. (A) Representative photographs and quantification of phospho-endothelial nitric-oxide synthase (p-eNOS)/total-endothelial nitric-oxide synthase (t-eNOS) in mouse kidneys measured by western blot. (B) Representative photographs and quantification of angiopoietin-2 (Ang-2) in mouse kidneys measured by western blot. (C) Quantification of nitric oxide (NO) level in mouse kidneys measured by Griess. (D,E) Representative photographs and quantification of reactive oxygen species (ROS) formation in mouse kidneys by dihydroethidium staining. n = 6 mice/group. #P < 0.05 vs. db/m group; &P < 0.05 vs. db/m+F group; *P < 0.05 vs. db/db group. Db/m, db/m mice without fenofibrate treatment; db/m+F, db/m mice with fenofibrate treatment; db/db, db/db mice without fenofibrate treatment; db/db+F, db/db mice with fenofibrate treatment. Data are means ± S.E.M.
Figure 6
Figure 6
Hypoxia-inducible factor (HIF)-1α and Notch1 in mouse kidneys. (A,B) Representative photographs and quantification of HIF-1α (A) and Notch1 (B) in mouse kidneys measured by western blot. n = 6 mice/group. #P < 0.05 vs. db/m group; &P < 0.05 vs. db/m+F group; *P < 0.05 vs. db/db group. Db/m, db/m mice without fenofibrate treatment; db/m+F, db/m mice with fenofibrate treatment; db/db, db/db mice without fenofibrate treatment; db/db+F, db/db mice with fenofibrate treatment. Data are means ± S.E.M.
Figure 7
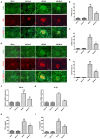
Figure 7
M1 macrophages in mouse kidneys and serum. (A–C) Representative photographs and quantification of co-staining of F4/80 and CD86 in mouse kidneys. (D,E) Representative photographs and quantification of co-staining of F4/80 and CD32/16 in mouse kidneys. (F,G) MRNA expression analyses of tumor necrosis factor (TNF)-α (F) and interleukin (IL)-1β (G) by quantitative reverse transcriptase PCR (RT-PCR). (H,I) Serum TNF-α (H) and interleukin (IL)-1β (I). n = 6 mice/group. #P < 0.05 vs. db/m group; &P < 0.05 vs. db/m+F group; *P < 0.05 vs. db/db group. Db/m, db/m mice without fenofibrate treatment; db/m+F, db/m mice with fenofibrate treatment; db/db, db/db mice without fenofibrate treatment; db/db+F, db/db mice with fenofibrate treatment. Data are means ± S.E.M.

References

    1. Calle P, Hotter G. Macrophage phenotype and fibrosis in diabetic nephropathy. Int J Mol Sci. (2020) 21:2806. 10.3390/ijms21082806 - DOI - PMC - PubMed
    1. Alpers CE, Hudkins KL. Mouse models of diabetic nephropathy. Curr Opin Nephrol Hypertens. (2011) 20:278–84. 10.1097/MNH.0b013e3283451901 - DOI - PMC - PubMed
    1. Dellamea BS, Leitão CB, Friedman R, Canani LH. Nitric oxide system and diabetic nephropathy. Diabetol Metab Syndr. (2014) 6:17. 10.1186/1758-5996-6-17 - DOI - PMC - PubMed
    1. Nogueira GB, Punaro GR, Oliveira CS, Maciel FR, Fernandes TO, Lima DY, et al. . N-acetylcysteine protects against diabetic nephropathy through control of oxidative and nitrosative stress by recovery of nitric oxide in rats. Nitric Oxide - Biol Chem. (2018) 78:22–31. 10.1016/j.niox.2018.05.003 - DOI - PubMed
    1. Yabuki A, Tahara T, Taniguchi K, Matsumoto M, Suzuki S. Neuronal nitric oxide synthase and cyclooxygenase-2 in diabetic nephropathy of type 2 diabetic OLETF rats. Exp Anim. (2006) 55:17–25. 10.1538/expanim.55.17 - DOI - PubMed