

This is a preprint.
A SARS-CoV-2 nucleocapsid protein TR-FRET assay amenable to high-throughput screening
- PMID: 34268508
- PMCID: PMC8282096
- DOI: 10.1101/2021.07.03.450938
A SARS-CoV-2 nucleocapsid protein TR-FRET assay amenable to high-throughput screening
Update in
-
SARS-CoV-2 Nucleocapsid Protein TR-FRET Assay Amenable to High Throughput Screening.ACS Pharmacol Transl Sci. 2022 Jan 3;5(1):8-19. doi: 10.1021/acsptsci.1c00182. eCollection 2022 Jan 14. ACS Pharmacol Transl Sci. 2022. PMID: 35036857 Free PMC article.
Abstract
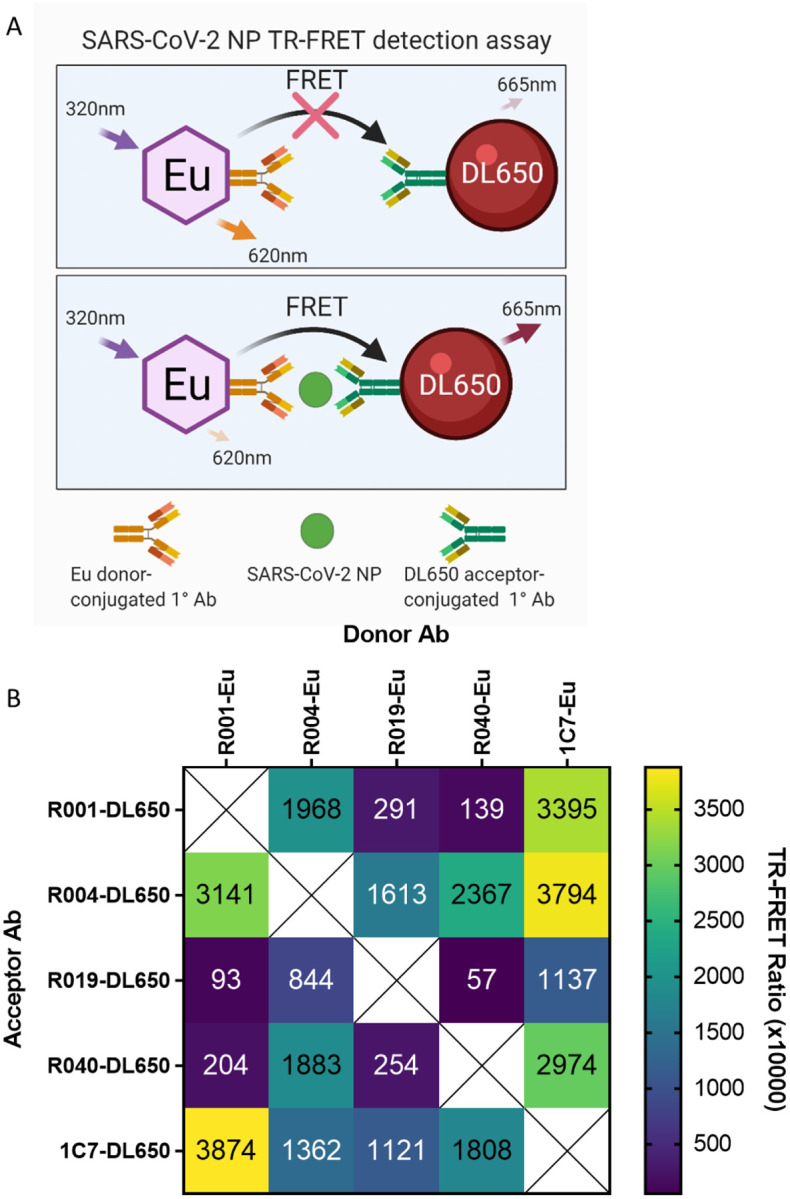
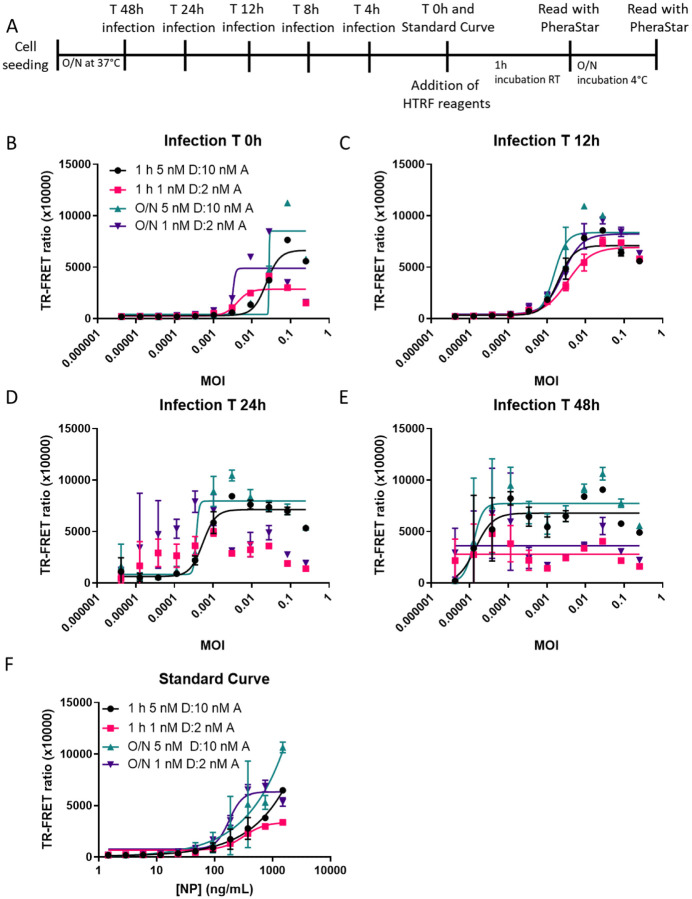
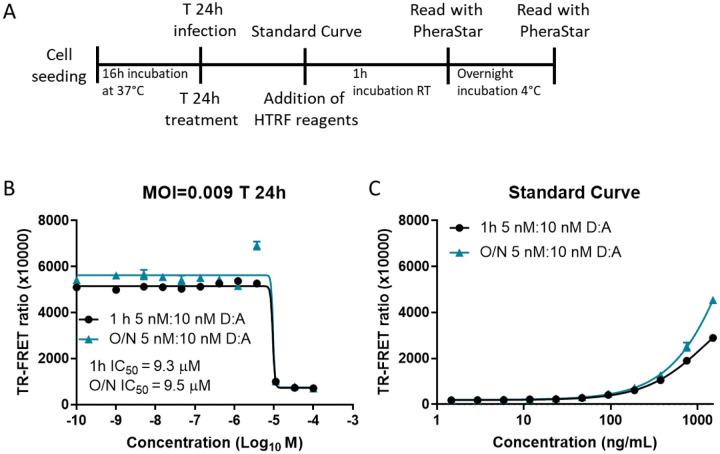
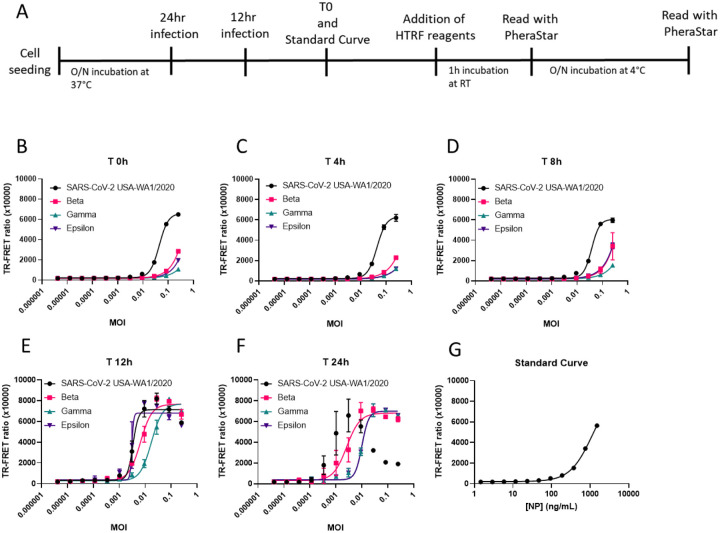
Drug development for specific antiviral agents against coronavirus disease 2019 (COVID-19) is still an unmet medical need as the pandemic continues to spread globally. Although huge efforts for drug repurposing and compound screens have put forth, only few compounds remain in late stage clinical trials. New approaches and assays are needed to accelerate COVID-19 drug discovery and development. Here we report a time-resolved fluorescence resonance energy transfer-based assay that detects the severe acute respiratory syndrome coronavirus 2 (SARS-CoV‑2) nucleocapsid protein (NP) produced in infected cells. It uses two specific anti-NP monoclonal antibodies (MAbs) conjugated to donor and acceptor fluorophores that produces a robust ratiometric signal for high throughput screening of large compound collections. Using this assay, we measured a half maximal inhibitory concentration (IC 50 ) for Remdesivir of 9.3 μM against infection with SARS-CoV-2 USA/WA1/2020 (WA-1). The assay also detected SARS-CoV-2 South African (Beta, β), Brazilian/Japanese variant P.1 (Gamma, γ), and Californian (Epsilon, ε), variants of concern or interest (VoC). Therefore, this homogeneous SARS-CoV-2 NP detection assay can be used for accelerating lead compound discovery for drug development and for evaluating drug efficacy against emerging SARS-CoV-2 VoC.
Conflict of interest statement
Declaration of conflicts
The authors claim no conflicts of interest in the preparation of this manuscript.
Figures
Similar articles
-
SARS-CoV-2 Nucleocapsid Protein TR-FRET Assay Amenable to High Throughput Screening.ACS Pharmacol Transl Sci. 2022 Jan 3;5(1):8-19. doi: 10.1021/acsptsci.1c00182. eCollection 2022 Jan 14. ACS Pharmacol Transl Sci. 2022. PMID: 35036857 Free PMC article.
-
Development of a Fluorescence-Based, High-Throughput SARS-CoV-2 3CLpro Reporter Assay.J Virol. 2020 Oct 27;94(22):e01265-20. doi: 10.1128/JVI.01265-20. Print 2020 Oct 27. J Virol. 2020. PMID: 32843534 Free PMC article.
-
Development of a High-Throughput Homogeneous AlphaLISA Drug Screening Assay for the Detection of SARS-CoV-2 Nucleocapsid.ACS Pharmacol Transl Sci. 2020 Oct 9;3(6):1233-1241. doi: 10.1021/acsptsci.0c00122. eCollection 2020 Dec 11. ACS Pharmacol Transl Sci. 2020. PMID: 33330840 Free PMC article.
-
SARS-CoV-2 Variants of Concern.Yonsei Med J. 2021 Nov;62(11):961-968. doi: 10.3349/ymj.2021.62.11.961. Yonsei Med J. 2021. PMID: 34672129 Free PMC article. Review.
-
Host Response to SARS-CoV2 and Emerging Variants in Pre-Existing Liver and Gastrointestinal Diseases.Front Cell Infect Microbiol. 2021 Oct 25;11:753249. doi: 10.3389/fcimb.2021.753249. eCollection 2021. Front Cell Infect Microbiol. 2021. PMID: 34760721 Free PMC article. Review.
References
Publication types
LinkOut - more resources
Full Text Sources
Miscellaneous