[Preprint]. 2021 Jul 7:2021.07.06.21259528.
doi: 10.1101/2021.07.06.21259528.

Pre-vaccination and early B cell signatures predict antibody response to SARS-CoV-2 mRNA vaccine

Affiliations

Pre-vaccination and early B cell signatures predict antibody response to SARS-CoV-2 mRNA vaccine

Lela Kardava et al. medRxiv. .

Update in

  • Early human B cell signatures of the primary antibody response to mRNA vaccination.
    Kardava L, Rachmaninoff N, Lau WW, Buckner CM, Trihemasava K, Blazkova J, Lopes de Assis F, Wang W, Zhang X, Wang Y, Chiang CI, Narpala S, McCormack GE, Liu C, Seamon CA, Sneller MC, O'Connell S, Li Y, McDermott AB, Chun TW, Fauci AS, Tsang JS, Moir S. Kardava L, et al. Proc Natl Acad Sci U S A. 2022 Jul 12;119(28):e2204607119. doi: 10.1073/pnas.2204607119. Epub 2022 Jun 27. Proc Natl Acad Sci U S A. 2022. PMID: 35759653 Free PMC article.

Abstract

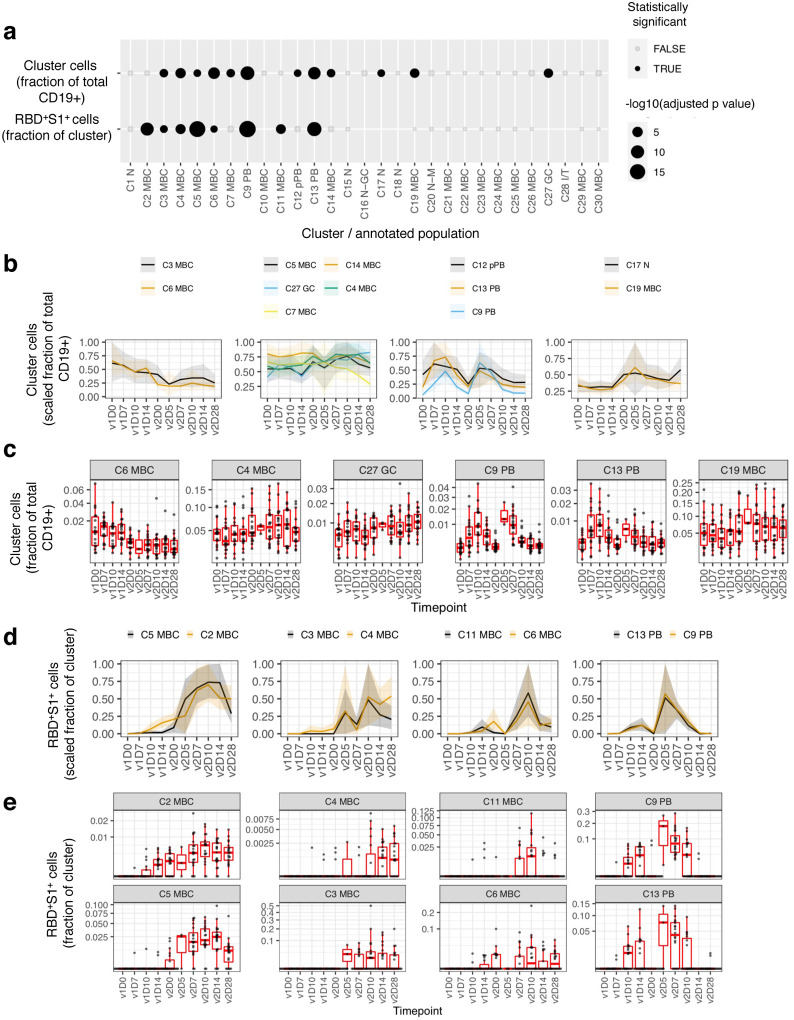
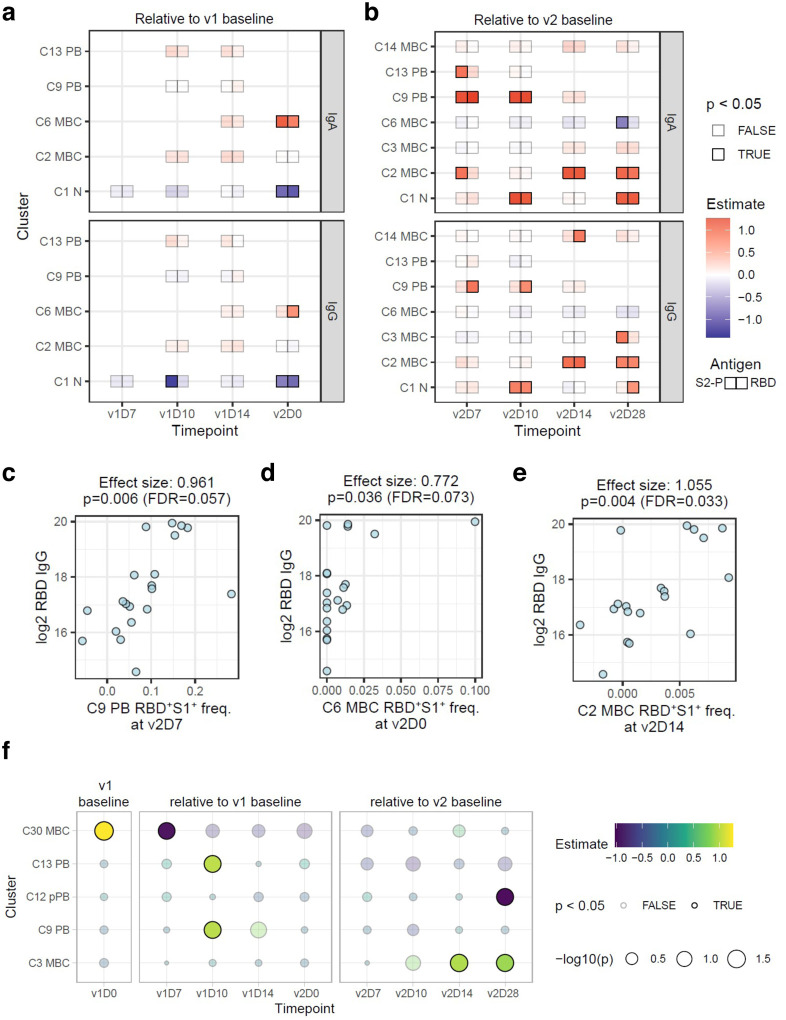
SARS-CoV-2 mRNA vaccines are highly effective, although weak antibody responses are seen in some individuals with correlates of immunity that remain poorly understood. Here we longitudinally dissected antibody, plasmablast, and memory B cell (MBC) responses to the two-dose Moderna mRNA vaccine in SARS-CoV-2-uninfected adults. Robust, coordinated IgA and IgG antibody responses were preceded by bursts of spike-specific plasmablasts after both doses, but earlier and more intensely after dose two. Distinct antigen-specific MBC populations also emerged post-vaccination with varying kinetics. We identified antigen non-specific pre-vaccination MBC and post-vaccination plasmablasts after dose one and their spike-specific counterparts early after dose two that correlated with subsequent antibody levels. These baseline and response signatures can thus provide early indicators of serological efficacy and explain response variability in the population.


Conflict of interest statement

Competing Interests Statement

YM is founder/CEO of ReVacc, Inc.

Figures

Fig. 1.
Fig. 1.. Longitudinal blood sampling and analysis shows robust antibody and early B cell response to mRNA-1273 vaccine.
a, Study design with serial blood draws and assays performed at all timepoints on SARS-CoV-2-uninfected vaccinees (n = 21; missed visits in Extended Data Table 1) receiving two doses of the mRNA-1273 vaccine. b, Serum IgG, IgA and IgM binding to S-2P and RBD proteins measured by electrochemiluminescence (ECLIA) longitudinally (left panels), and corresponding histogram and distribution (based on kernel density estimates) at the last timepoint (v2D28) (right panels). c, Peak serum IgG, IgA and IgM binding to S-2P, RBD and N proteins measured by ECLIA in vaccinees (V; n = 21) and COVID-19 patients (P; n = 21), shown as boxplots. d, Triangular heatmap of correlation between serum antibodies at last measured timepoint (v2D28) in (b). Numbers represent r values. Statistically insignificant correlations (p > 0.05) shown in white. e, Longitudinal inhibition of RBD binding to ACE2 by serum (1:40 dilution) of vaccinees (n = 21). f, Longitudinal binding of S1 and RBD tetramers to PB and IgG+ B cells by flow cytometry shown for a high responder (VAC-611; Extended Data Table 1). Numbers in each quadrant are percentages. Each vaccinee is color-coded and second vaccine dose indicated by vertical dotted line (b,e). Mann-Whitney test; ****, p < 0.0001 (c). Spearman’s rank correlation (d). AU, arbitrary units; D, day; N, nucleocapsid; ns, not significant; P, patients with severe COVID-19; PB, plasmablasts; RBD, receptor binding domain; S1, spike subunit 1; S-2P, stabilized spike trimer; v, vaccine dose; V, vaccinees.
Fig. 2.
Fig. 2.. Unsupervised clustering analysis identifies major B cell populations and SARS-CoV-2-specific B cells.
a, UMAP projection of combined B cells (n = 653,683 cells), subsampled from 3.2 million CD19+ cells to include 3,667 cells per sample and all RBD+S1+ cells from all study participants (n = 21) at all timepoints with annotated major B cell populations identified by FlowSOM clustering. b, MFI-based heatmap of FlowSOM clusters as indicated by cluster number and marker. Rows ordered by hierarchical clustering. Summary of fraction of cells binding both RBD and S1 within each cluster and cell counts per cluster (right). c, UMAP plots with overlays of RBD+S1+ B cells (blue points with white center) at each timepoint. d, RBD+S1+ cells within each cluster expressed as a fraction of total CD19+ B cells across all subjects at each timepoint (n at each timepoint shown in Extended Data Table 1). D, day; GC, germinal center; I/T, immature transitional; MBC, memory B cell; MFI, mean fluorescence intensity; N, naïve; PB, plasmablast; pPB, pre-plasmablast; v, vaccine dose.
Fig. 3.
Fig. 3.. Antigen non-specific and spike-specific cells exhibit temporal change in response to the mRNA-1273 vaccine.
a, Clusters showing significant temporal variation over course of v1 and v2 in the frequency of non-specific cells as a fraction of total (CD19+) B cells (first row) and RBD+S1+ cells as a fraction within each cluster (second row). b, Longitudinal display of non-specific cells per cluster as a fraction of total (CD19+) B cells, shown for clusters with statistically significant temporal variations, as shown in (a). Clusters were grouped by temporal patterns (see methods). Lines denote the mean and shading denotes 95% bootstrap confidence interval per timepoint. Values rescaled as fraction of maximum 95% confidence interval estimate over the entire time course. c, Similar to (b) but showing boxplots for selected clusters. d, similar to (b) but displaying of RBD+S1+ cells as a fraction within each cluster. e, Similar to (d) but showing boxplots. Type III ANOVA test using Satterthwaite’s approximation (a). N at each timepoint shown in Extended Data Table 1 (b-e). D, day; RBD, receptor binding domain; S1, spike subunit 1; v, vaccine dose.
Fig. 4.
Fig. 4.. Correlates of SARS-CoV-2 antibody titers 28 days after second dose of vaccine.
a,b, Linear model effect size estimates indicate strength of association between spike-specific (RBD+S1+) cell frequency in the cell clusters (rows) with antibody endpoints (IgA and IgG titers for S-2P and RBD) relative to pre-vaccination baseline level (v1D0) at four timepoints between v1 and v2 (a), and relative to v2 baseline (v2D0) at four timepoints after v2 (b). Only clusters with at least one significant (unadjusted p ≤ 0.05) association at any timepoint are shown. At each timepoint, clusters that had fewer than five samples with any RBD+S1+ cells were excluded from analysis (missing boxes). c-e, Scatter plots illustrating correlations between endpoint (v2D28) RBD IgG titers and RBD+S1+ cell frequencies in C9 on v2D7, C6 on v2D0, and C2 on v2D14, respectively. Effect sizes and p values were estimated by the linear models above. FDR estimate of the statistical significance was calculated within each antibody endpoint and timepoint combination. f, Effect size estimates of association between first principal component (PC1) of endpoint SARS-CoV-2 antibody titers and frequencies of each cell cluster as a fraction of total CD19+ cells. PC1 was derived from IgA and IgG titers against S-2P and RBD proteins at v2D28. Only cell clusters with at least one significant (unadjusted p ≤ 0.05) association at any timepoint are shown. D, day; FDR, false discovery rate; RBD, receptor binding domain; rho, Spearman’s rank correlation; S1, spike subunit 1; S-2P, stabilized spike trimer; v, vaccine dose.

References

    1. Wrapp D., et al. Cryo-EM structure of the 2019-nCoV spike in the prefusion conformation. Science 367, 1260–1263 (2020). - PMC - PubMed
    1. Polack F.P., et al. Safety and Efficacy of the BNT162b2 mRNA Covid-19 Vaccine. N Engl J Med 383, 2603–2615 (2020). - PMC - PubMed
    1. Baden L.R., et al. Efficacy and Safety of the mRNA-1273 SARS-CoV-2 Vaccine. N Engl J Med 384, 403–416 (2021). - PMC - PubMed
    1. Goel R.R., et al. Distinct antibody and memory B cell responses in SARS-CoV-2 naive and recovered individuals following mRNA vaccination. Sci Immunol 6 (2021). - PMC - PubMed
    1. Tsapepas D., Paget K., Mohan S., Cohen D.J. & Husain S.A. Clinically Significant COVID-19 Following SARS-CoV-2 Vaccination in Kidney Transplant Recipients. Am J Kidney Dis (2021). - PMC - PubMed

Publication types