. 2022 Mar;71(3):529-540.
doi: 10.1007/s00262-021-03007-1. Epub 2021 Jul 15.

A secondary role for hypoxia and HIF1 in the regulation of (IFNγ-induced) PD-L1 expression in melanoma

Affiliations

A secondary role for hypoxia and HIF1 in the regulation of (IFNγ-induced) PD-L1 expression in melanoma

Anneloes van Duijn et al. Cancer Immunol Immunother. 2022 Mar.

Abstract

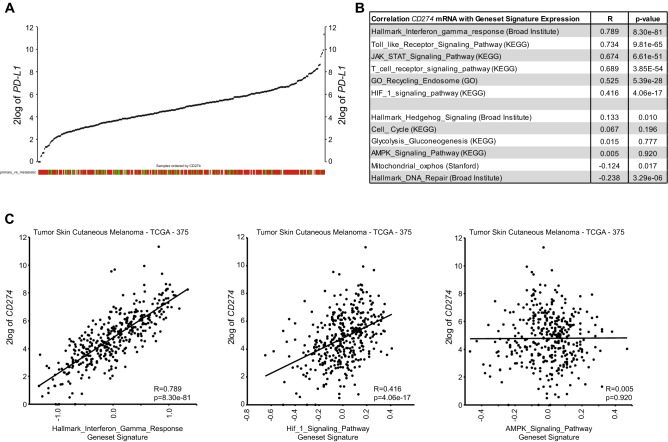
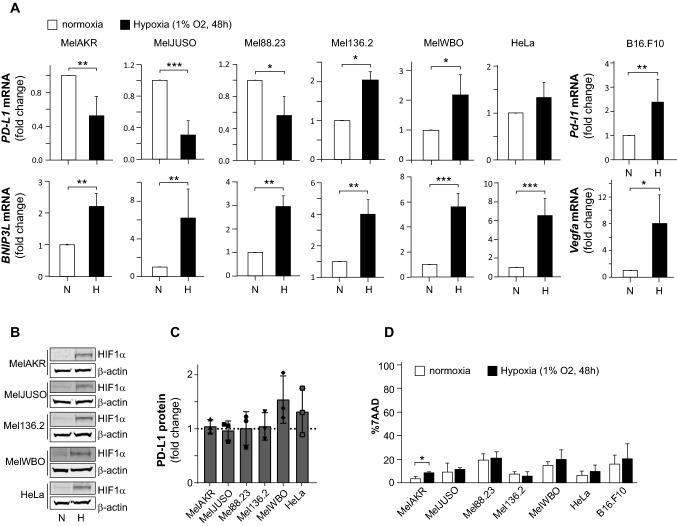
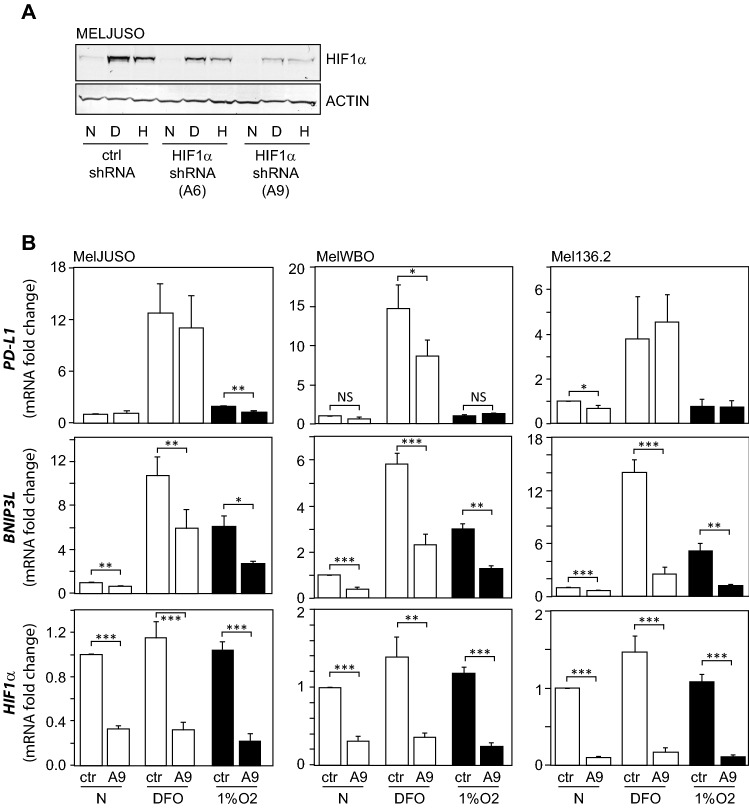
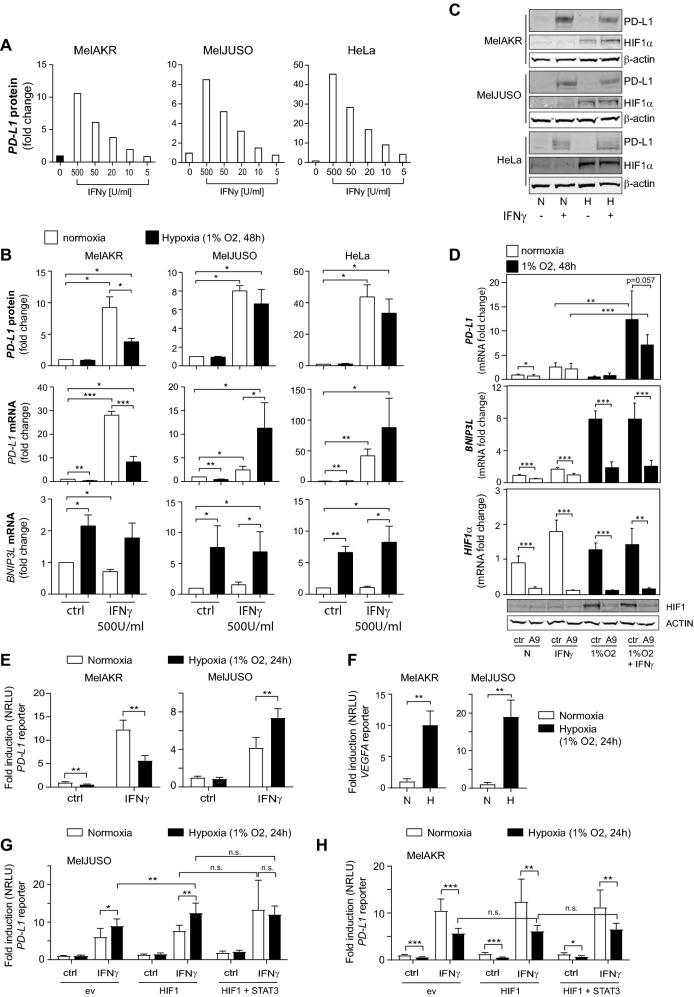
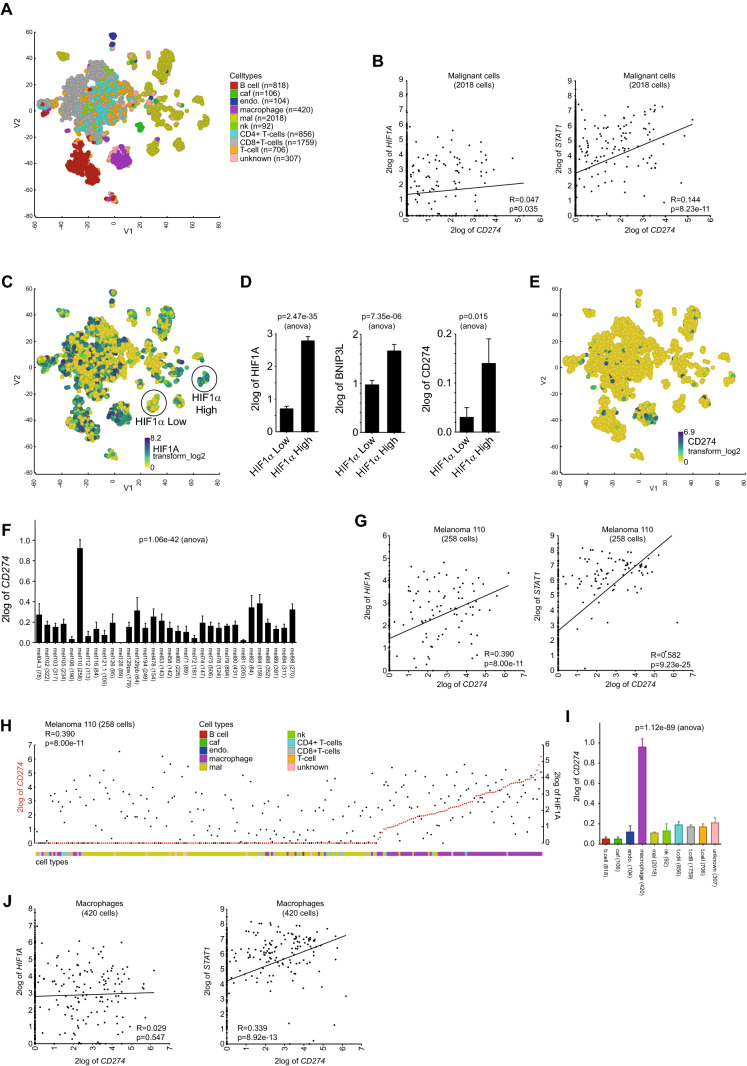
Cancer cells are able to escape immune surveillance by upregulating programmed death ligand 1 (PD-L1). A key regulator of PD-L1 expression is transcriptional stimulation by the IFNγ/JAK/STAT pathway. Recent studies suggest that hypoxia can induce PD-L1 expression. As hypoxia presents a hallmark of solid tumor development, hypoxic control of PD-L1 expression may affect the efficacy of cancer immunotherapy. This study aims to explore the hypoxic regulation of PD-L1 expression in human melanoma, and its interaction with IFNγ-induced PD-L1 expression. Analysis of the cutaneous melanoma dataset from the cancer genome atlas revealed a significant correlation of the HIF1-signaling geneset signature with PD-L1 mRNA expression. However, this correlation is less pronounced than other key pathways known to control PD-L1 expression, including the IFNγ/JAK/STAT pathway. This secondary role of HIF1 in PD-L1 regulation was confirmed by analyzing single-cell RNA-sequencing data of 33 human melanoma tissues. Interestingly, PD-L1 expression in these melanoma tissues was primarily found in macrophages. However, also in these cells STAT1, and not HIF1, displayed the most pronounced correlation with PD-L1 expression. Moreover, we observed that hypoxia differentially affects PD-L1 expression in human melanoma cell lines. Knockdown of HIF1 expression indicated a minor role for HIF1 in regulating PD-L1 expression. A more pronounced influence of hypoxia was found on IFNγ-induced PD-L1 mRNA expression, which is controlled at a 952 bp PD-L1 promoter fragment. These findings, showing the influence of hypoxia on IFNγ-induced PD-L1 expression, are relevant for immunotherapy, as both IFNγ and hypoxia are frequently present in the tumor microenvironment.

Keywords: HIF1; Hypoxia; IFNγ; Immunotherapy; Melanoma; PD-L1.


Conflict of interest statement

The authors declare no competing interests.

Figures

Fig. 1
Fig. 1
PD-L1 expression correlates with HIF1-signaling pathway expression in human melanoma. (A) YY-plot showing PD-L1 (CD274) mRNA levels in 375 tumors from cutaneous melanoma patients (TCGA data). Red boxes indicate metastatic tumors; green boxes: primary tumors; and light gray boxes: not determined. (B) Table showing the correlation (R, correlation coefficient) and statistical significance (p-value) of PD-L1 mRNA expression with expression of indicated geneset signatures in the TCGA melanoma data. (C) XY-plots showing three examples from (B)
Fig. 2
Fig. 2
Hypoxia differentially affects PD-L1 expression in melanoma cells. (A) The human melanoma cell lines MelAKR, MelJUSO, Mel88.23, Mel136.2, MelWBO, the mouse melanoma cell line B16.F10 and the human cervical cancer cell line HeLa were cultured for 48 h in normoxia or hypoxia, after which cells were harvested and PD-L1 mRNA expression was analyzed by qPCR. Graphs show PD-L1 and BNIP3L mRNA levels depicted as fold change, as compared to normoxia. White bars present normoxic (N) and black bars hypoxic (H) conditions. The HIF1 target BNIP3L (and Vegfa in the mouse B16.F10 cells) were used as markers of HIF1 activity, and (B) Western Blots showing HIF1α protein levels for the indicated cell lines. β-ACTIN protein levels serve as loading control. (C) Total PD-L1 protein levels (both intracellular and extracellular) were determined in human cell lines by FACS under the same conditions as in (A). Graphs indicate the fold change in PD-L1 protein levels in hypoxia, as compared to normoxia. (D) Cell viability was analyzed for all cell lines in normoxia and hypoxia. All quantified data are presented as the average ± standard deviation, as compared to the control (N) in at least three independent experiments. Statistical significance of differences between normoxia and hypoxia was tested. *p < 0.05, **p < 0.01, ***p < 0.001
Fig. 3
Fig. 3
A minor role for HIF1 in PD-L1 regulation in response to hypoxia or DFO. (A) MELJUSO cells were transduced with lentiviral shRNA vector A6 or A9 targeting HIF1α, or a control vector (ctrl). Transduced cells were cultured for 24 h in normoxia (N, white bars), hypoxia (H, 1% O2, black bars) or in the presence of 100 μM DFO (D). HIF1α protein levels were determined by Western blot. Actin protein levels serve as loading control. (B) MelJUSO, MelWBO and Mel136.2 cell lines transduced with the lentiviral shRNA vector A9 targeting HIF1α, or a control vector, were stimulated with DFO (100 μM) or hypoxia (1% O2) for 24 h, after which cells were harvested. HIF1α, BNIP3L and PD-L1 mRNA levels were determined by qPCR. White bars present normoxic (N), and black bars hypoxic conditions
Fig. 4
Fig. 4
Stimulation of PD-L1 expression by IFNγ is affected by hypoxia. (A) The MelAKR, MelJUSO and HeLa cells were incubated in normoxia for 48 h with different concentrations of IFNγ, ranging from 500 to 5 U/ml, as indicated. Cells were harvested, and PD-L1 protein expression at the cell surface was analyzed using flow cytometry. Data represent median fluorescent intensity (MFI) of PD-L1 staining, as compared to untreated cells (ctrl), per experiment. (B) MelAKR, MelJUSO and HeLa cells were seeded one day prior to stimulation for 48 h with IFNγ (500 U/ml) in normoxia (N, white bars) or hypoxia (H, 1% O2, black bars). PD-L1 and BNIP3L mRNA levels were determined by qPCR, and PD-L1 protein levels (surface expression) by flow cytometry. Graphs show the fold change in MFI of PDL1-staining, as compared to normoxia. (C) Western blot analysis of HIF1α and PD-L1 protein levels under same conditions as described in (B). β-ACTIN protein levels serve as loading control. (D) MELJUSO cells transduced with the HIF1α targeting shRNA vector A9 or a control (ctrl) were cultured for 48 h in normoxia (N) and incubated with IFNγ (500U/ml), hypoxia (1% O2) or a combination thereof, as indicated. The fold change in mRNA expression was determined compared to ctrl cells in N. All quantitative data are presented as the average ± standard deviation of 5 independent experiments. Statistical significance of differences between ctrl and A9 was analyzed for all conditions, and for PD-L1 also between the IFNγ and IFNγ plus hypoxia conditions. The lower panels indicate Western blot analysis of HIF1α and β-ACTIN (loading control) protein levels for the indicated conditions. (E) PD-L1 reporter assay in MelAKR and MelJUSO cells. Cells were incubated with IFNγ (500U/ml), hypoxia or a combination thereof, for 24 h, as indicated. Graphs show the fold induction of normalized relative luciferase units (NRLU), as compared to normoxia. (F) VEGFA reporter assay under the same conditions as in (E). PD-L1 reporter assay in MelJUSO (G) and MelAKR (H) as described in (E) but now in combination with HIF1, or HIF1 and STAT3 overexpression. All quantitative data are presented as the average ± standard deviation in at least three independent experiments. *p < 0.05, **p < 0.01, ***p < 0.001
Fig. 5
Fig. 5
Single-cell analysis reveals a positive correlation between HIF1α and PD-L1 expression in melanoma subpopulations with high HIF1α levels, or in tumors with elevated PD-L1 levels. (A) T-stochastic neighbor embedding plot (t-SNE, perplexity = 50) using single-cell RNAseq analysis of 7186 cells from 33 melanoma tumors [19]. CAF (cancer-associated fibroblasts), endo (endothelial cells), mal (malignant cells), nk (natural killer cells). (B) XY-plots showing the correlation (R) between PD-L1 (CD274) and HIF1α or STAT1 mRNA expression (log2 transformed) in the subset of 2018 melanoma cells. (C) HIF1α expression in the t-SNE plot from (A). Melanoma subpopulations with low (HIF1α Low), or high (HIF1α High) HIF1α expression. (D) Graphs show HIF1α, BNIP3L and PD-L1 expression in the HIF1α low and high melanoma cell subpopulations. (E) PD-L1 expression in the t-SNE plot from (A). (F) Graph depicting PD-L1 expression in all 33 melanoma samples. (G) XY-plots showing the correlation (R) between PD-L1 (CD274) and HIF1α or STAT1 mRNA expression in tumor 110 (258 cells) (H) YY-plot showing HIF1α (black squares) and PD-L1 (red dots) in tumor 110. Cells were ordered by CD274. (I) Bar graph showing PD-L1 (CD274) expression in the different cell types. (J) XY-plots showing the correlation (R) between PD-L1 (CD274) and HIF1α or STAT1 mRNA expression in macrophages (420 cells) from all tumors

References

    1. Topalian SL, Taube JM, Anders RA, Pardoll DM. Mechanism-driven biomarkers to guide immune checkpoint blockade in cancer therapy. Nat Rev Cancer. 2016;16:275–287. doi: 10.1038/nrc.2016.36. - DOI - PMC - PubMed
    1. Topalian SL, Drake CG, Pardoll DM. Targeting the PD-1/B7-H1(PD-L1) pathway to activate anti-tumor immunity. Curr Opin Immunol. 2012;24:207–212. doi: 10.1016/j.coi.2011.12.009. - DOI - PMC - PubMed
    1. Frydenlund N, Mahalingam M. PD-L1 and immune escape: insights from melanoma and other lineage-unrelated malignancies. Hum Pathol. 2017;66:13–33. doi: 10.1016/j.humpath.2017.06.012. - DOI - PubMed
    1. Jessurun CAC, Vos JAM, Limpens J, Luiten RM. Biomarkers for response of melanoma patients to immune checkpoint inhibitors: a systematic review. Front Oncol. 2017;7:233. doi: 10.3389/fonc.2017.00233. - DOI - PMC - PubMed
    1. Meng X, Huang Z, Teng F, Xing L, Yu J. Predictive biomarkers in PD-1/PD-L1 checkpoint blockade immunotherapy. Cancer Treat Rev. 2015;41:868–876. doi: 10.1016/j.ctrv.2015.11.001. - DOI - PubMed

MeSH terms