. 2021 Dec;12(1):1855-1883.
doi: 10.1080/21505594.2021.1948286.

Koi sleepy disease as a pathophysiological and immunological consequence of a branchial infection of common carp with carp edema virus

Affiliations

Koi sleepy disease as a pathophysiological and immunological consequence of a branchial infection of common carp with carp edema virus

Mikolaj Adamek et al. Virulence. 2021 Dec.

Abstract

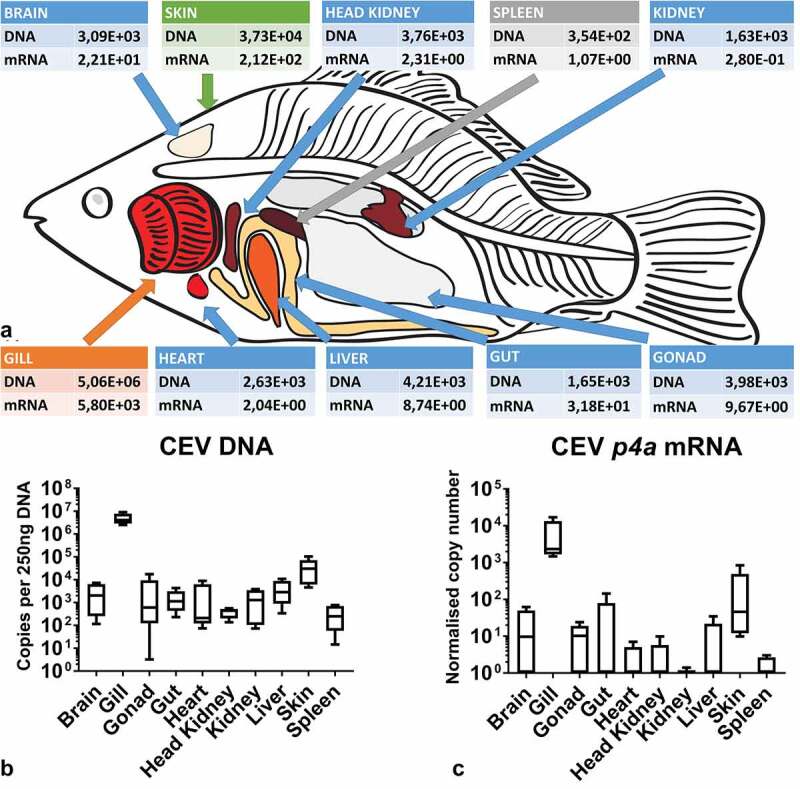
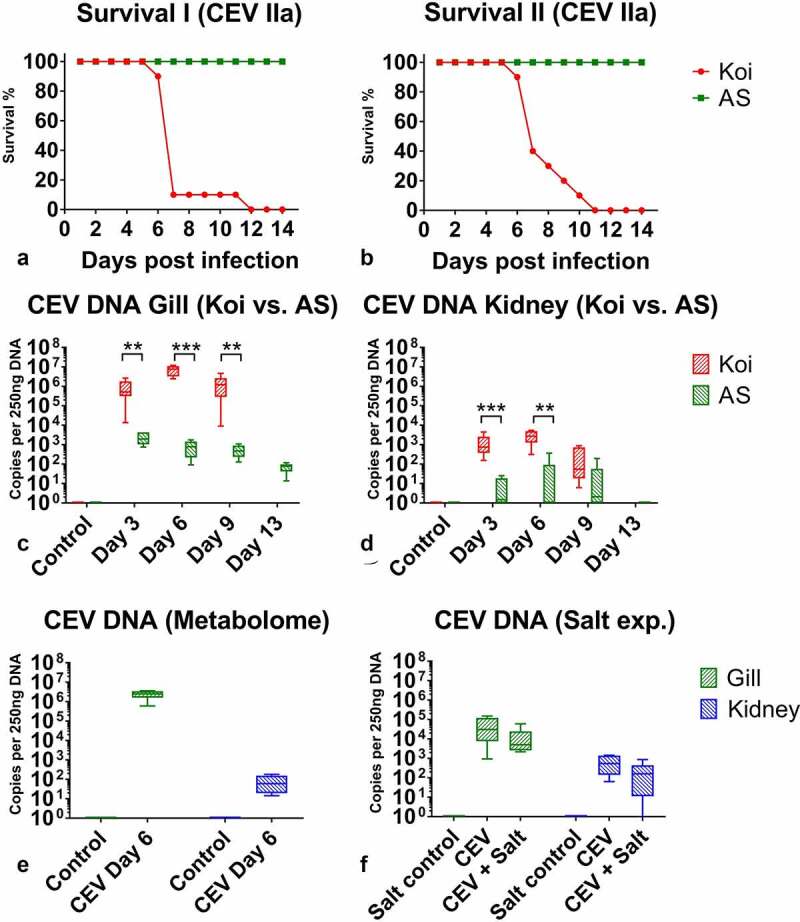
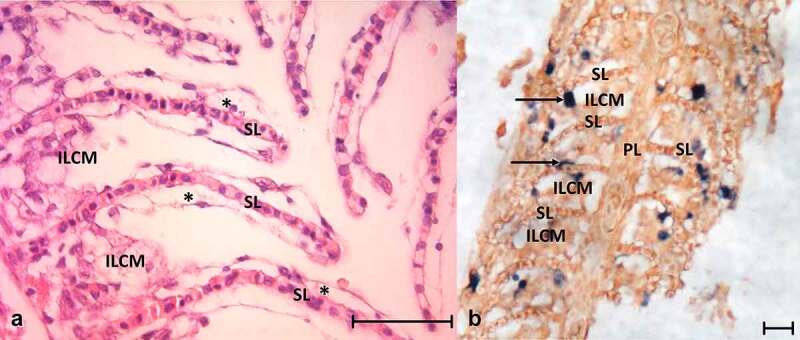
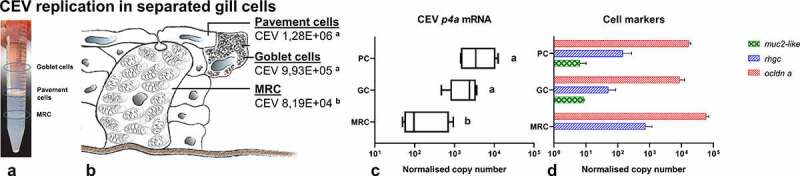
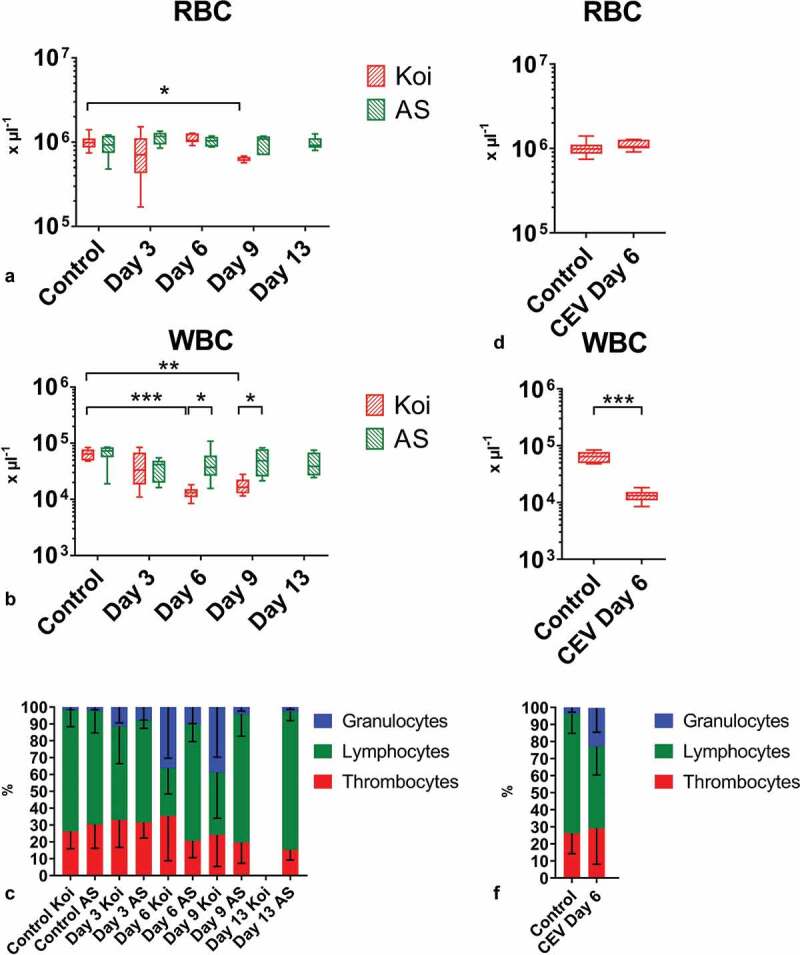
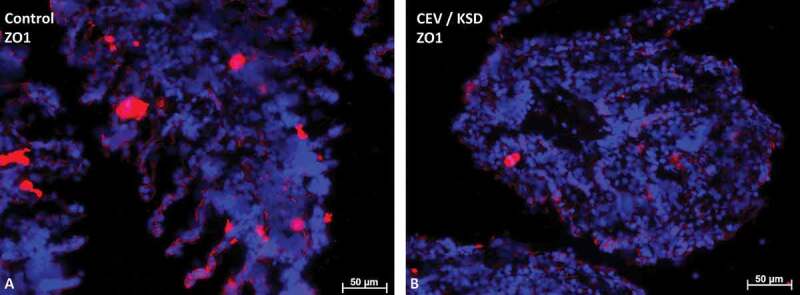
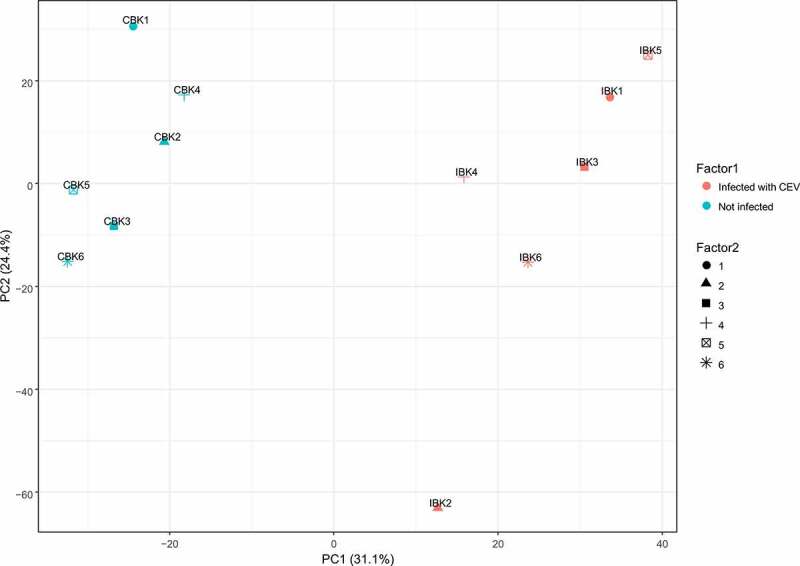
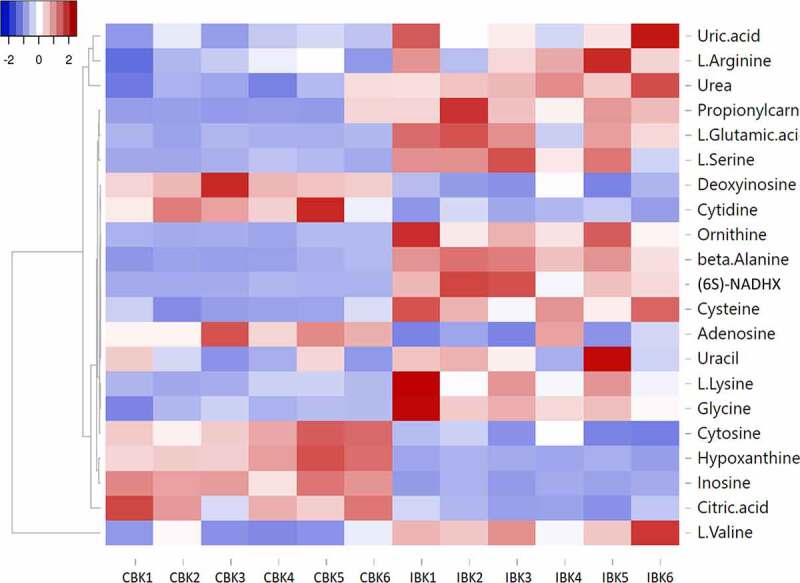
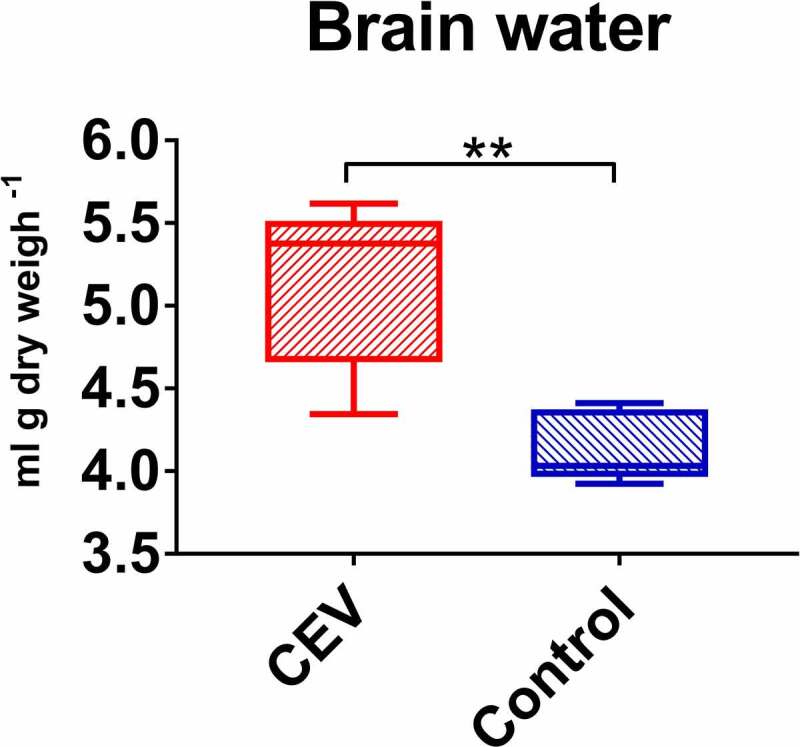
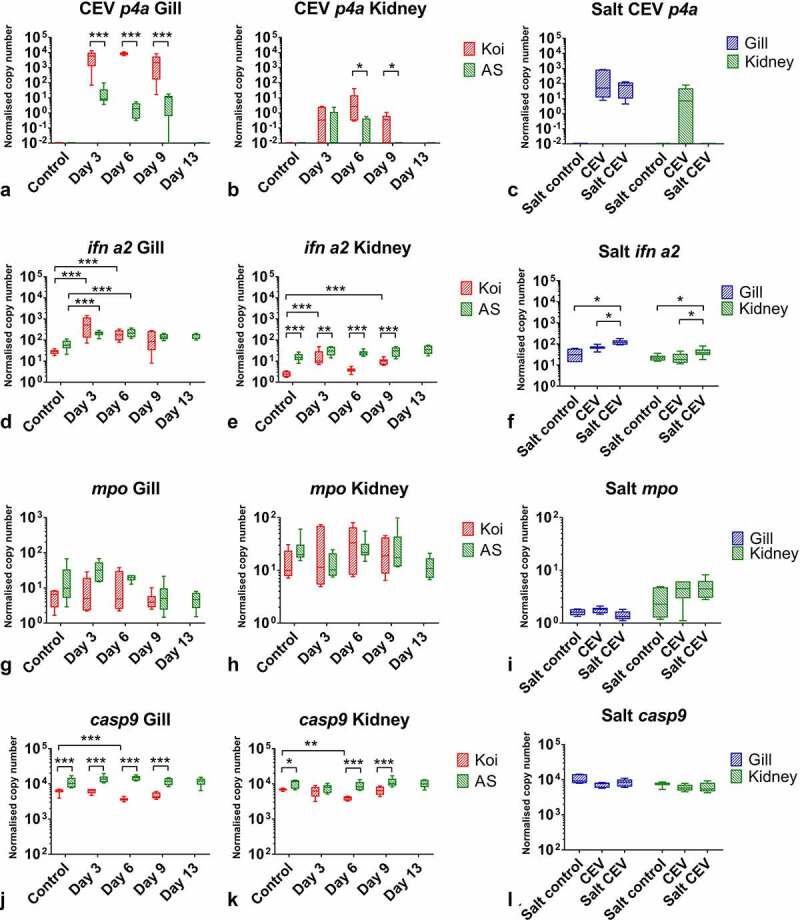
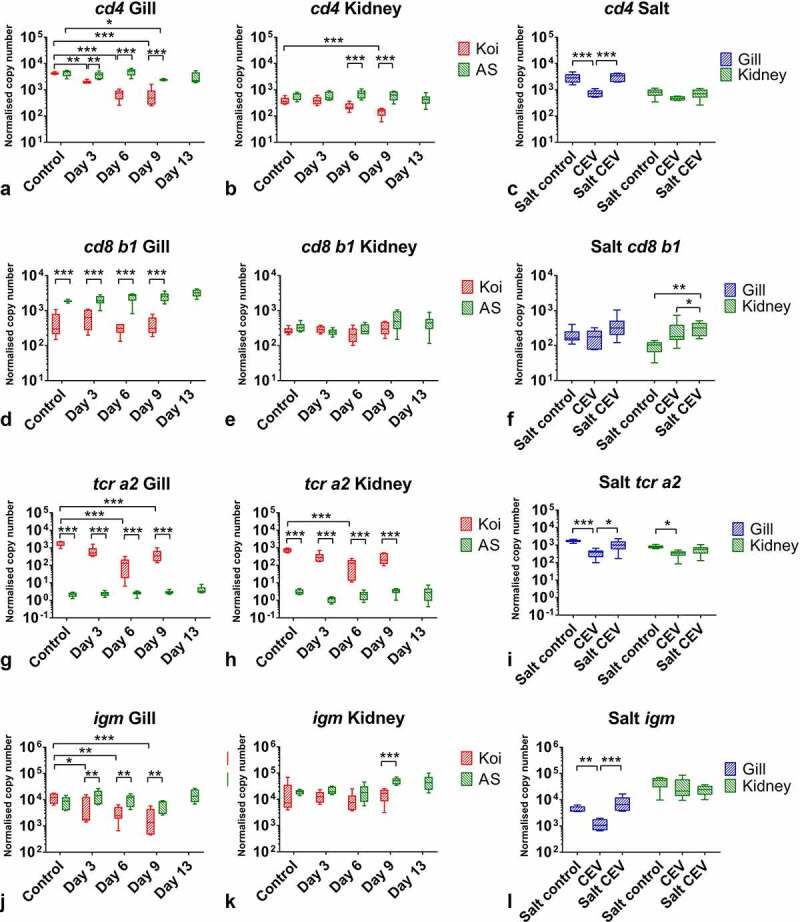
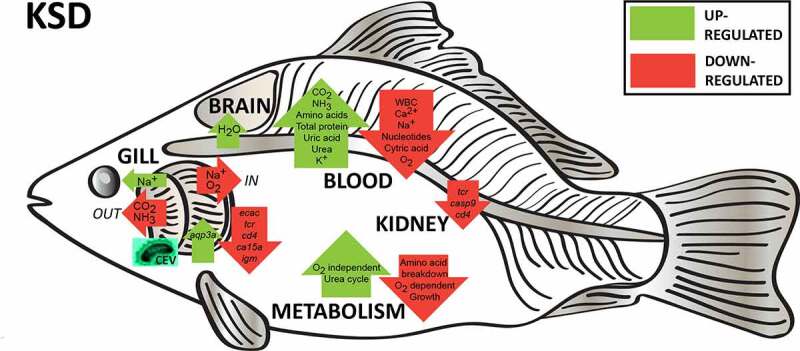
Gills of fish are involved in respiration, excretion and osmoregulation. Due to numerous interactions between these processes, branchial diseases have serious implications on fish health. Here, "koi sleepy disease" (KSD), caused by carp edema virus (CEV) infection was used to study physiological, immunological and metabolic consequences of a gill disease in fish. A metabolome analysis shows that the moderately hypoxic-tolerant carp can compensate the respiratory compromise related to this infection by various adaptations in their metabolism. Instead, the disease is accompanied by a massive disturbance of the osmotic balance with hyponatremia as low as 71.65 mmol L-1, and an accumulation of ammonia in circulatory blood causing a hyperammonemia as high as 1123.24 µmol L-1. At water conditions with increased ambient salt, the hydro-mineral balance and the ammonia excretion were restored. Importantly, both hyponatremia and hyperammonemia in KSD-affected carp can be linked to an immunosuppression leading to a four-fold drop in the number of white blood cells, and significant downregulation of cd4, tcr a2 and igm expression in gills, which can be evaded by increasing the ion concentration in water. This shows that the complex host-pathogen interactions within the gills can have immunosuppressive consequences, which have not previously been addressed in fish. Furthermore, it makes the CEV infection of carp a powerful model for studying interdependent pathological and immunological effects of a branchial disease in fish.

Keywords: Carp edema virus; gills; hyperammonemia; hyponatremia; immunosuppression; koi sleepy disease; metabolome; osmoregulation.


Conflict of interest statement

No potential conflict of interest was reported by the authors.

Figures

Figure 1.
Figure 1.
(a) Mean virus load and expression of transcripts encoding the viral P4a capsid core protein in a tissue library of KSD-affected fish showing that gills are the main target organ for the virus. Colors indicate different levels of virus load: orange 107 copies – 105 copies, green 105 copies - 104 copies, blue 104 copies – 103 copies, grey <103. (b) Box plot diagrams presenting 25%–75% (±minimum and maximum values) percentiles and the median as a horizontal line of the virus load in analyzed carp tissues. Depicted is the copy number of viral genome per 250 ng of isolated DNA from n = 5 specimen. (c) Box plot diagrams presenting 25%–75% (±minimum and maximum values) percentiles and the median as a horizontal line of data on the expression of mRNA encoding the viral P4a capsid core protein in normalized copy numbers in analyzed tissues from n = 5 specimen
Figure 2.
Figure 2.
Kinetics of an infection of koi and AS carp with carp edema virus from genogroup IIa during different experiments. (a) and (b) Approximated mortality curves based on the number of animals removed from the experiment when they reached the clinical signs score qualifying for the humane end-point of the experiments. All animals removed presented severe sleepiness or CLB when they were not responding to external stimuli. (c) and (d) CEV loads in gills and kidney of specimen from the koi and AS strains, which show extremely different levels of susceptibility to the infection. Koi were highly susceptible, while AS were highly resistant to the CEV infection and development of KSD leading to mortality. (e) Virus load in the gills and kidney of fish used in the metabolome study. (f) Virus load in the gills and kidney of fish in the salt treatment study. Significant differences between koi and AS are marked with * at p ≤ 0.05, with ** at p ≤ 0.01, with *** at p ≤ 0.001. Mortality data are presented as percentage curves of fish remaining in the experiment. Virus load data are presented as box plots of 25% – 75% percentiles (± minimum and maximum values) with an indication of median as a horizontal line
Figure 3.
Figure 3.
(a) Histology of the gills from CEV-infected fish showing the secondary lamellae edema with lifting of the epithelium (asterisks) and proliferation of cells in the intralamellar spaces. (b) In situ hybridization detecting CEV DNA in infected gills; dark blue signal (arrow) indicates CEV-infected cells. ILCM: intralamellar cellular mass, PL: primary lamella of the gill, SL: secondary lamella. Bar 50 µm
Figure 4.
Figure 4.
Separation of gill cell populations by density gradient centrifugation, determination of the abundance of cell surface proteins and virus load in separated cell populations. (a) Gill- derived cells separated by Percoll gradient centrifugation. (b) Diagrammatic presentation of distinct populations of pavement cells (PC) goblet cells (GC) and mitochondria rich cells (MRC) in gill tissue. Cells isolated from infected gills harbored different mean levels of virus DNA. (c) Different levels of expression of mRNA encoding the P4a core protein of CEV. (d) Expression of the cellular markers mucin 2-like (muc2-like), occludin (ocldn), and rhesus glycoprotein type C (rhgc) in the different gill-derived cell populations. Letters (a, b) indicate significant differences at p ≤ 0.05 between different cell populations. Expression data for p4a are presented as box plots of 25% – 75% percentiles (± minimum and maximum values) with an indication of median as a vertical line. Mean host genes expression is presented as a bar (+SD). The diagram drown by authors based of MRC cells diagram by Degnan et al.
Figure 5.
Figure 5.
Blood cells in carp from different carp strains under CEV infection. Depicted are total and differential blood cell counts: (a) number of red blood cells (RBC), (b) number of white blood cells (WBC), (c) percentage of granulocytes, lymphocytes and thrombocytes during CEV V experiment in two strains of carp, (d) RBC, (e) WBC, (f) percentage of granulocytes, lymphocytes and thrombocytes in fish used for metabolomics studies. Total and differential blood cell counts show leukopenia and granulocytosis in infected specimen from the KSD susceptible koi strain. Analysis was performed with t-test or two-way ANOVA with strain and time-points as factors. The ANOVA was followed by subsequent pairwise multiple comparisons using the Holm-Sidak method. Significant differences between the control and infected specimens and between strains are marked with * at p ≤ 0.05, with ** at p ≤ 0.01, with *** at p ≤ 0.001. RBC and WBC are presented as box plots of 25% – 75% percentiles (± minimum and maximum values) with an indication of median as a horizontal line. The mean percentage of granulocytes, lymphocytes and thrombocytes are presented as a bar (+SD)
Figure 6.
Figure 6.
Staining of the tight junction protein-1 (ZO-1) (in red) in gills of CEV not infected (a) and CEV-infected (b) fish, showing severe clinical signs of KSD. Cell nuclei were counterstained with DAPI. CEV-infected gills show a severe occlusion of the intralamellar space, which blocks the contact of epithelial cells (ZO-1 positive) with water. Bar 50 µm
Figure 7.
Figure 7.
Principle component analyses of blood plasma metabolites from CEV-infected and non- infected koi. IBK1-6 indicates plasma from CEV-infected koi, CBK1-6 plasma from the koi before infection
Figure 8.
Figure 8.
Heat map showing the change in the level of selected metabolites during CEV infection. IBK1-6 indicates plasma from CEV-infected koi, CBK1-6 indicates plasma from koi before infection
Figure 9.
Figure 9.
Accumulation of water in the brain of CEV-infected fish. Amount of water in brain per g dry weight is presented as box plots of 25% – 75% percentiles (±minimum and maximum values) with an indication of median as a horizontal line of measurements from n = 5 specimen. The analysis was performed with t-test. Significant differences between the control and infected are marked with * at p ≤ 0.05, with ** at p ≤ 0.0 1, with *** at p ≤ 0.001
Figure 10.
Figure 10.
The mRNA expression levels of P4a capsid core protein (p4a) of CEV and genes involved in immune responses in carp under CEV infection. (A, B, C) depicted are transcription rates of viral p4a, (D, E, F) type I interferon a2 (ifn a2), (G, H, I) myeloperoxidase (mpo) and (J, K, L) caspase 9 (casp9) encoding genes in gills and kidney of koi and AS carp after exposure to koi infected with CEV genogroup IIa and kept in freshwater or water supplemented with 0.5% NaCl. Analysis was performed with one-way or two-way ANOVA with strain and time-points as factors. The ANOVA was followed by subsequent pairwise multiple comparisons using the Holm-Sidak method. Significant differences between the control and infected are marked with * at p ≤ 0.05, with ** at p ≤ 0.01, with *** at p ≤ 0.001. The data are presented as box plots of 25% – 75% percentiles (±minimum and maximum values) with an indication of median as a horizontal line from n = 6 specimen
Figure 11.
Figure 11.
The mRNA expression levels of genes involved in immune responses in tissues of carp under CEV infection. (A, B, C) depicted are mRNA copy numbers of genes encoding surface protein CD4 of T helper cells (cd4), (D, E, F) surface protein CD8 b1 of cytotoxic T cells (cd8 b1), (G, H, I) T cell receptor a2 (tcr a2), (J, K, L) immunoglobulin M (igm), involved in adaptive immune responses in gills and kidney of koi and AS carp after exposure to koi infected with CEV genogroup IIa and kept in freshwater or water supplemented with 0.5% NaCl. Analysis was performed with one-way or two-way ANOVA with strain and time -points as factors. The ANOVA was followed by subsequent pairwise multiple comparisons using the Holm-Sidak method. Significant differences between the control and infected carp are marked with *at p ≤ 0.05, with ** at p ≤ 0.01, with *** at p ≤ 0.001. The data are presented as box plots of 25% – 75% percentiles (±minimum and maximum values) with an indication of median as a horizontal line from measurements of n = 6 specimen
Figure 12.
Figure 12.
A summary of current results showing that koi sleepy disease is triggered by the gill pathology caused by the infection with carp edema virus. This impairs the respiratory, excretory and osmoregulatory function of gills, leading to a decrease in blood oxygenation and increase in CO2 content. This is compensated by a shift from oxygen-dependent to oxygen-independent metabolism and restricted growth of fish, which is reflected in a decrease in citric acid and nucleotide content in blood. Increased loss of ions via damaged gills causes hyponatremia and hypocalcemia. Further cell damage initiates hyperpotassaemia. Impairment of ammonia secretion induces hyperammonemia. This leads to a stop in ammino acid breakdown and increased urea cycle, causing the increase in amino acids, urea and uric acid content in blood. Hyponatremia and hyperammonemia could be associated with the influx of water to the brain and immunosuppression shown as downregulation of cd4, casp9, tcr a2 expression in gills and kidney and igm in gills

References

    1. Lewisch E, Gorgoglione B, Way K, et al. Carp edema virus/Koi sleepy disease: an emerging disease in Central-East Europe. Transbound Emerg Dis. 2015;62:6–12. - PubMed
    1. Way K, Haenen O, Stone D, et al. Emergence of carp edema virus (CEV) and its significance to European common carp and koi Cyprinus carpio. Dis Aquat Organ. 2017;126:155–166. - PubMed
    1. Adamek M, Oschilewski A, Wohlsein P, et al. Experimental infections of different carp strains with the carp edema virus (CEV) give insights into the infection biology of the virus and indicate possible solutions to problems caused by koi sleepy disease (KSD) in carp aquaculture. Vet Res. 2017;48:12. - PMC - PubMed
    1. Miyazaki T, Isshiki T, Katsuyuki H.. Histopathological and electron microscopy studies on sleepy disease of koi Cyprinus carpio koi in Japan. Dis Aquat Organ. 2005;65:197–207. - PubMed
    1. Powell MD, Reynolds P, Kristensen T. Freshwater treatment of amoebic gill disease and sea-lice in seawater salmon production: considerations of water chemistry and fish welfare in Norway. Aquaculture. 2015;448:18–28.

Publication types