. 2021 Jul 16:10:e63756.
doi: 10.7554/eLife.63756.

Action potential-coupled Rho GTPase signaling drives presynaptic plasticity

Affiliations

Action potential-coupled Rho GTPase signaling drives presynaptic plasticity

Shataakshi Dube O'Neil et al. Elife. .

Abstract

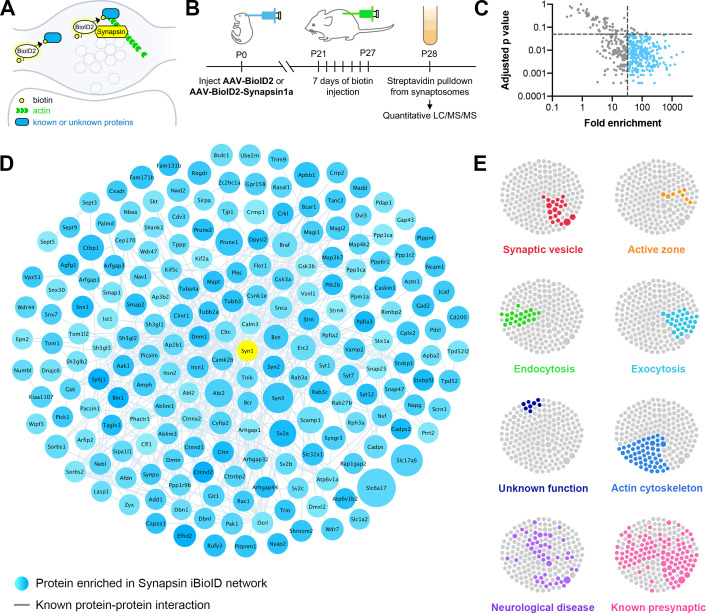
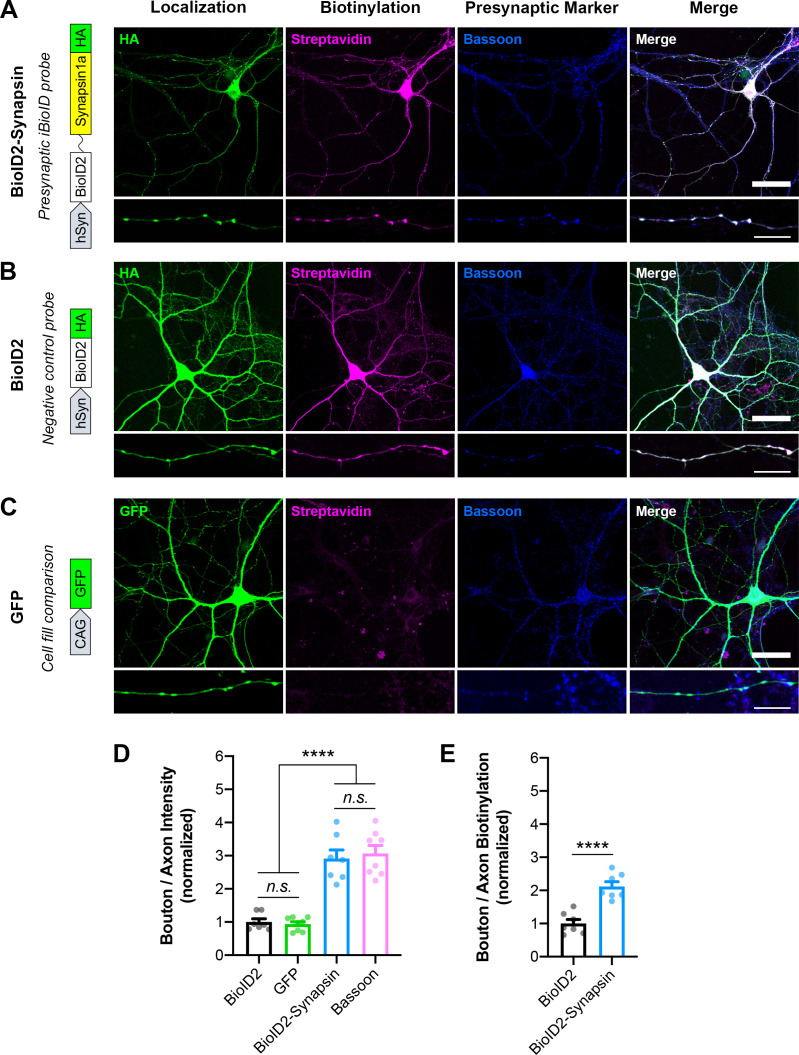
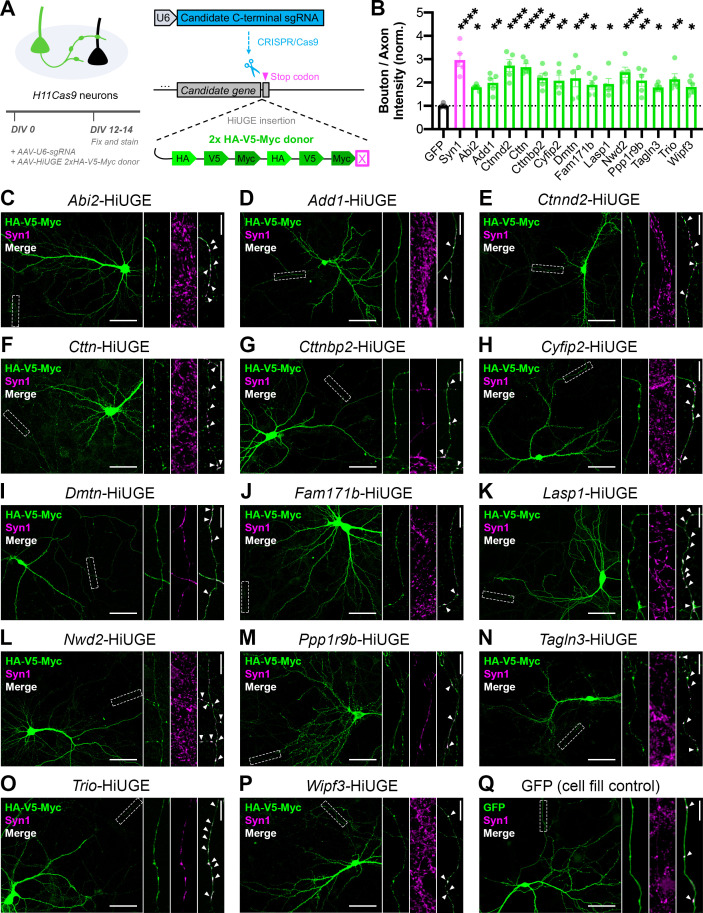
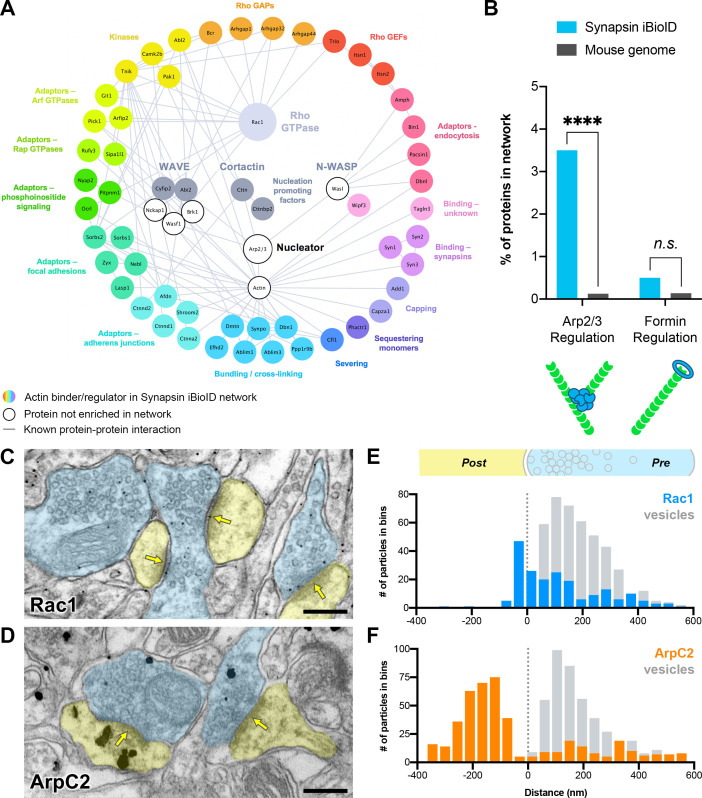
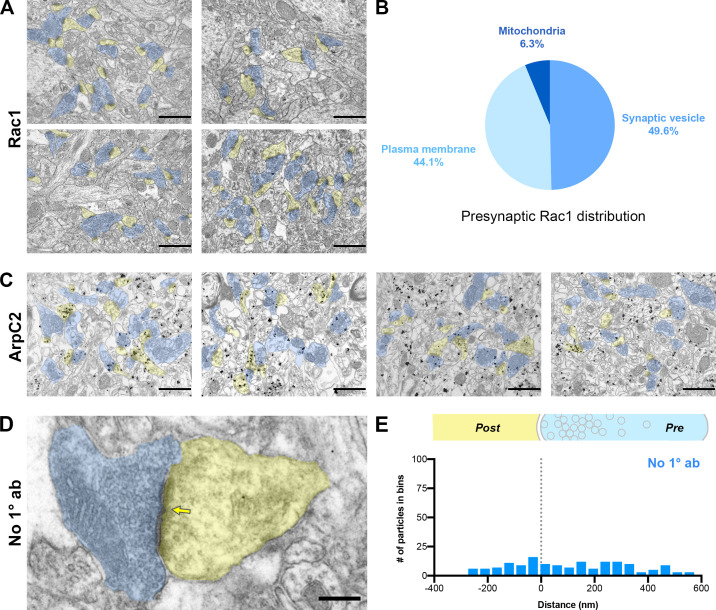
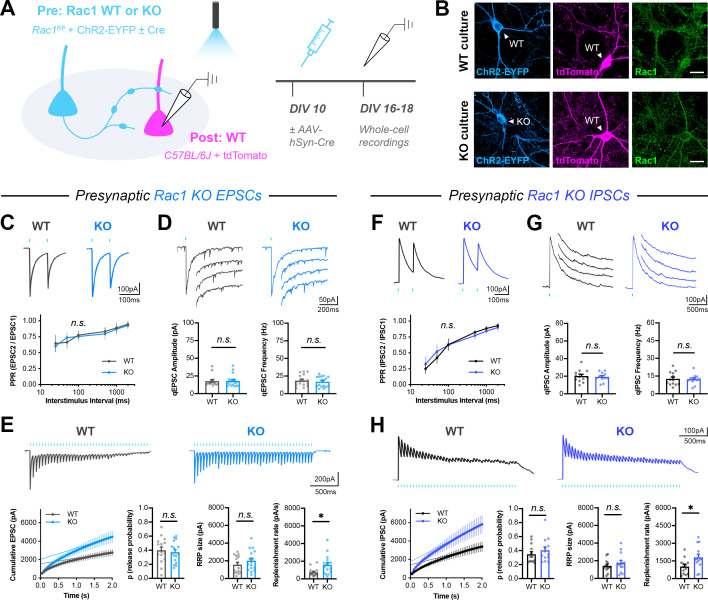
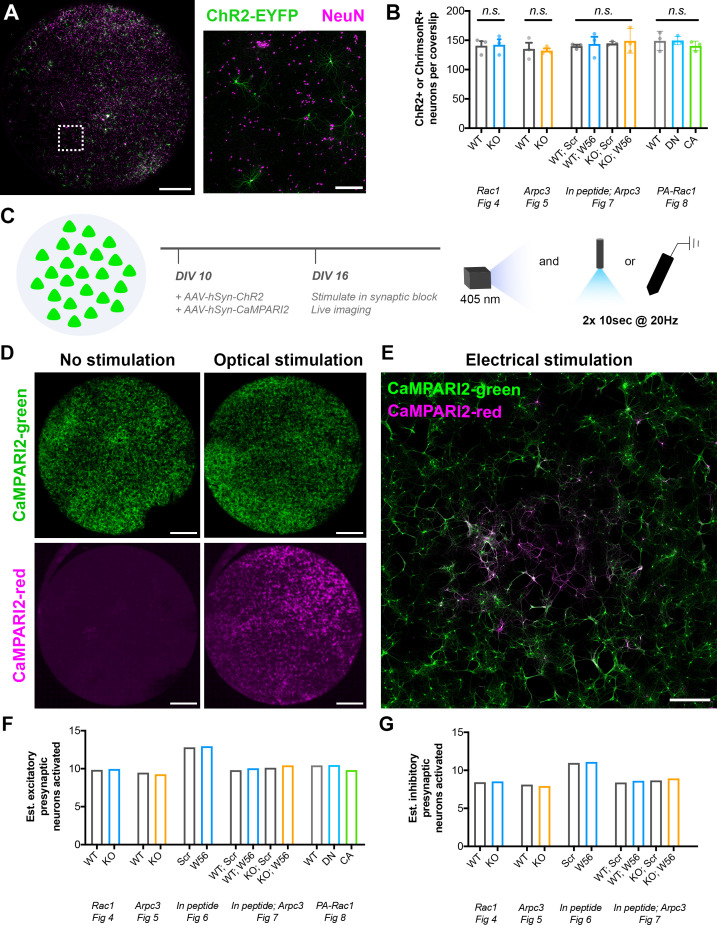
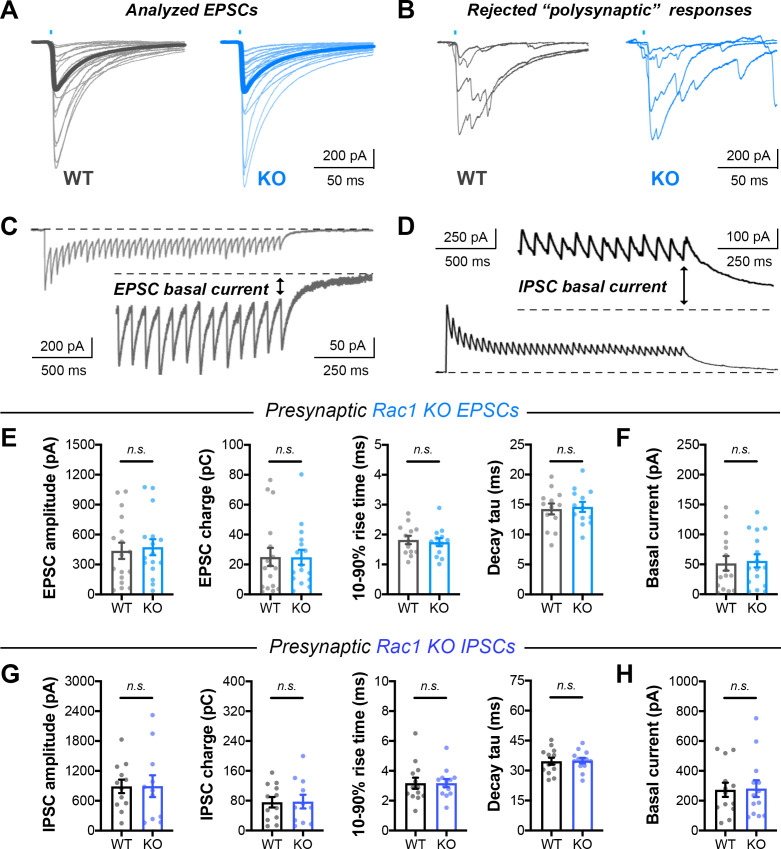
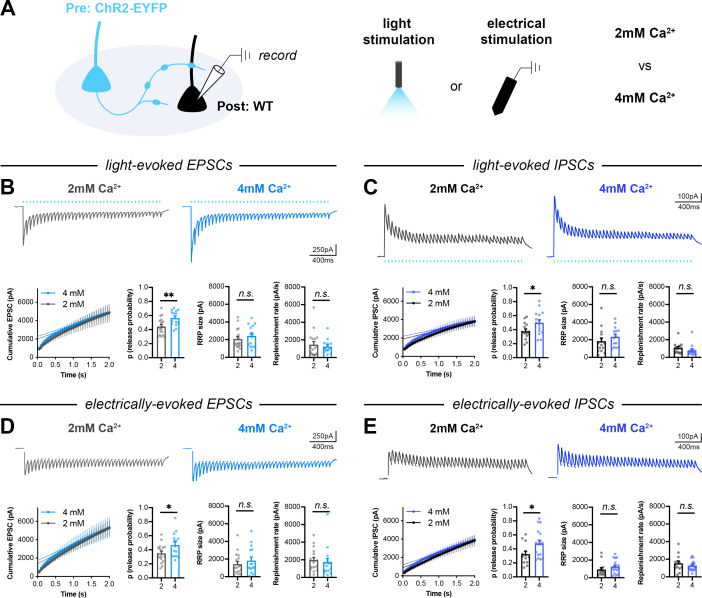
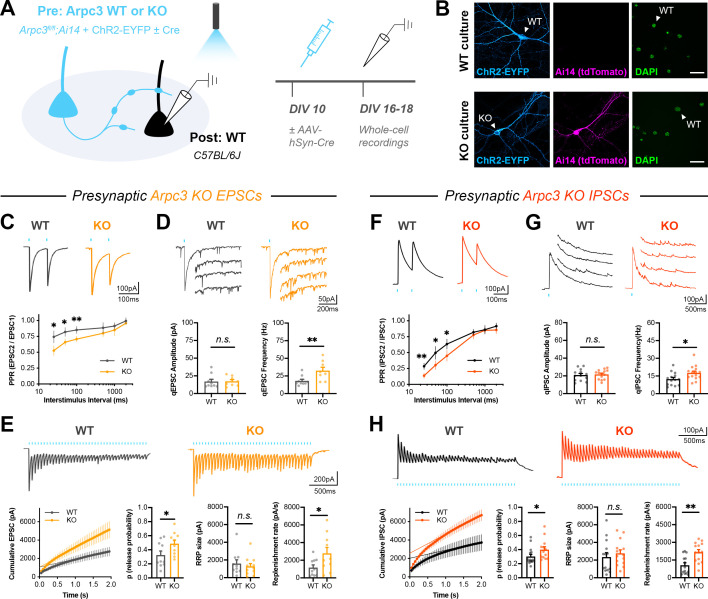
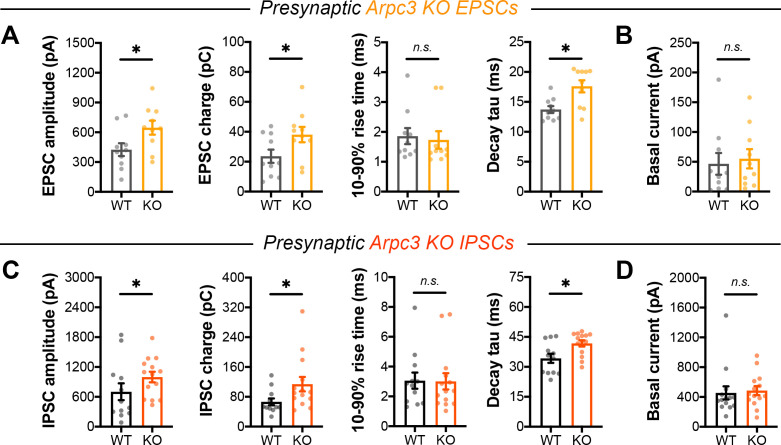
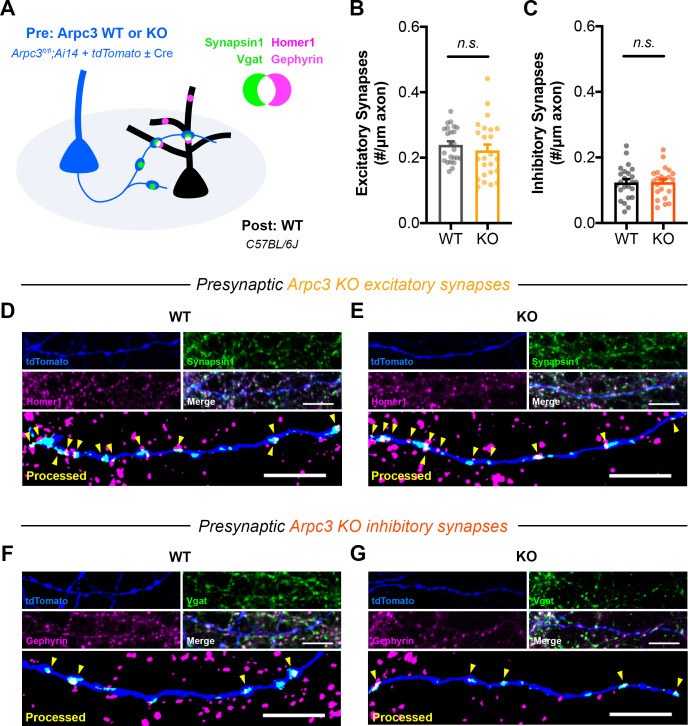
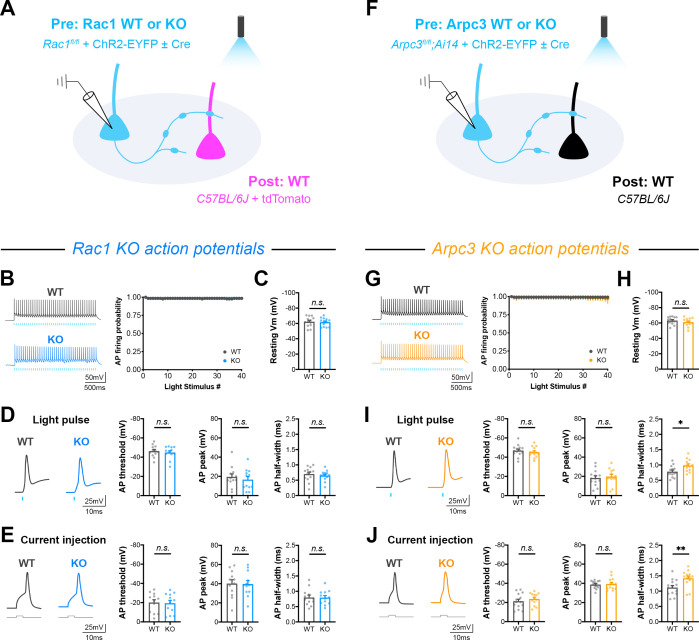
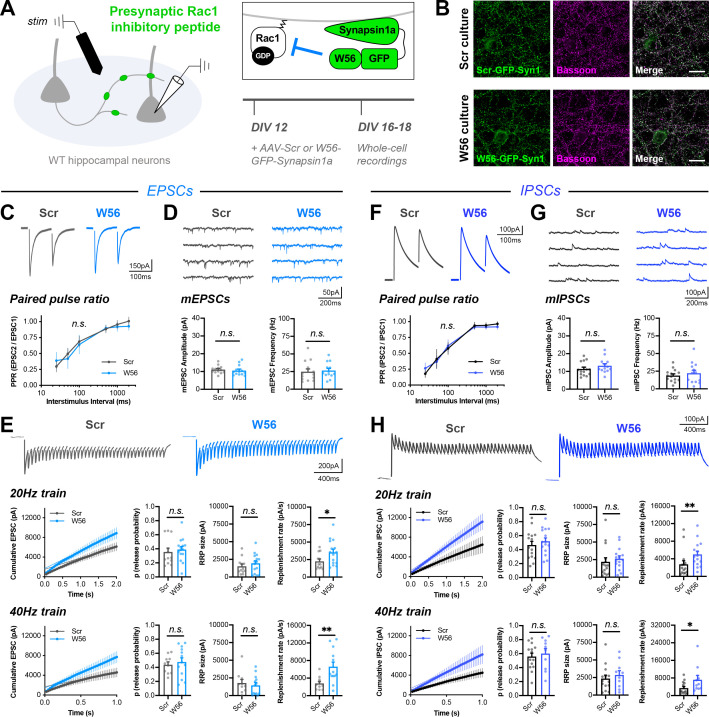
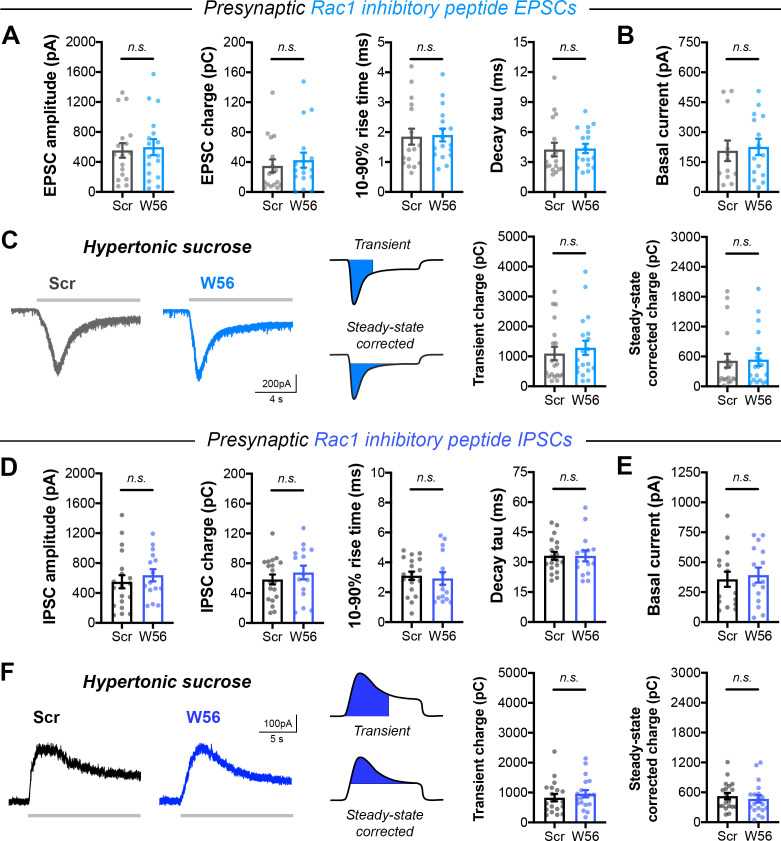
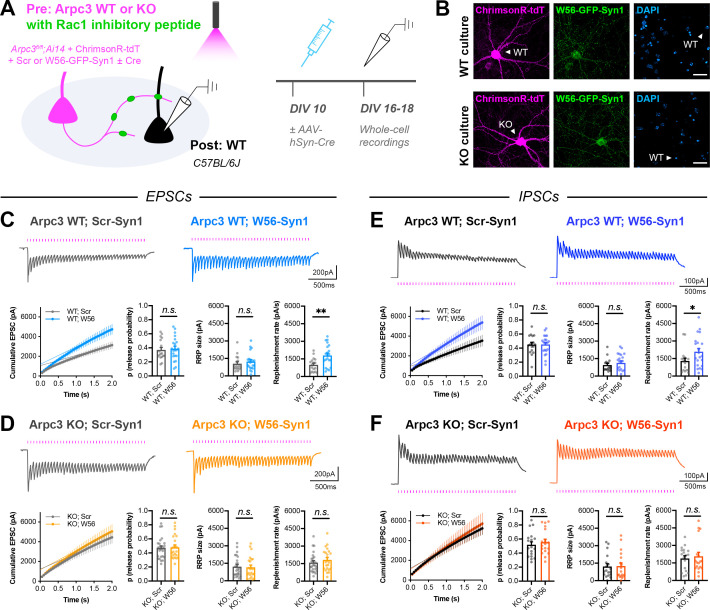
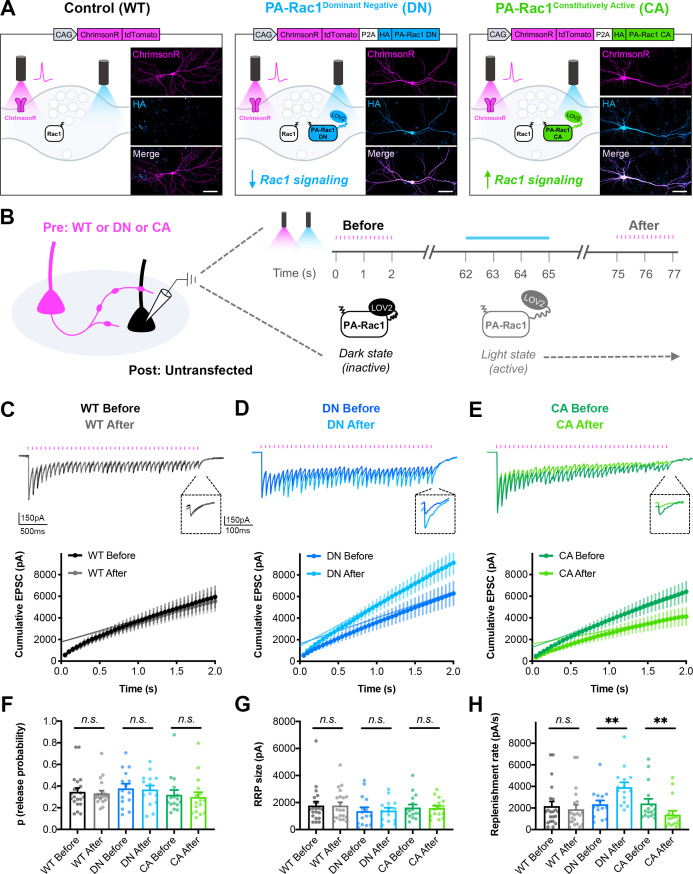
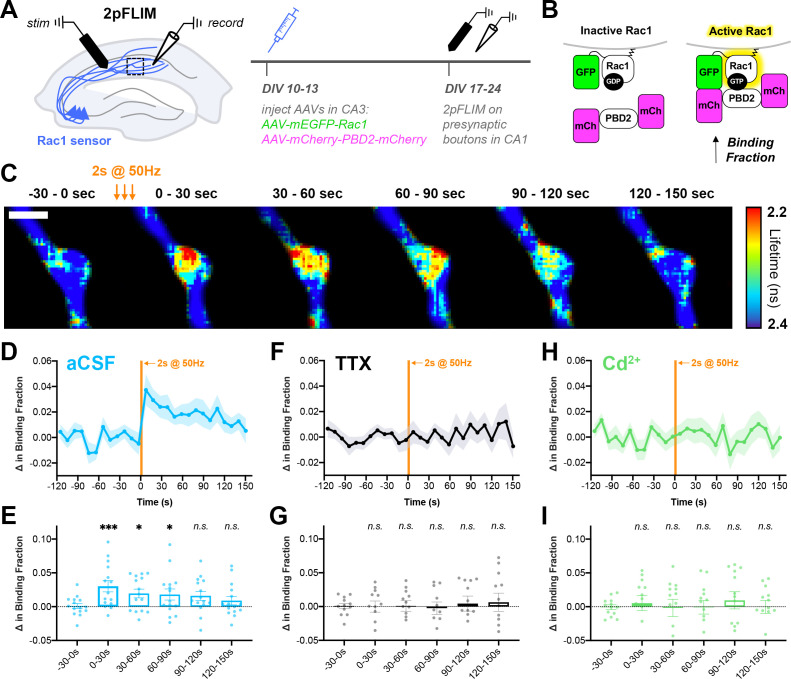
In contrast to their postsynaptic counterparts, the contributions of activity-dependent cytoskeletal signaling to presynaptic plasticity remain controversial and poorly understood. To identify and evaluate these signaling pathways, we conducted a proteomic analysis of the presynaptic cytomatrix using in vivo biotin identification (iBioID). The resultant proteome was heavily enriched for actin cytoskeleton regulators, including Rac1, a Rho GTPase that activates the Arp2/3 complex to nucleate branched actin filaments. Strikingly, we find Rac1 and Arp2/3 are closely associated with synaptic vesicle membranes in adult mice. Using three independent approaches to alter presynaptic Rac1 activity (genetic knockout, spatially restricted inhibition, and temporal optogenetic manipulation), we discover that this pathway negatively regulates synaptic vesicle replenishment at both excitatory and inhibitory synapses, bidirectionally sculpting short-term synaptic depression. Finally, we use two-photon fluorescence lifetime imaging to show that presynaptic Rac1 activation is coupled to action potentials by voltage-gated calcium influx. Thus, this study uncovers a previously unrecognized mechanism of actin-regulated short-term presynaptic plasticity that is conserved across excitatory and inhibitory terminals. It also provides a new proteomic framework for better understanding presynaptic physiology, along with a blueprint of experimental strategies to isolate the presynaptic effects of ubiquitously expressed proteins.

Keywords: 2pFLIM; Rac1; cell biology; cytoskeleton; mouse; neuroscience; presynapse; proteomics; short-term plasticity.


Conflict of interest statement

SO, BR, WB, ES No competing interests declared, YG has filed a patent application (16/968,904) related to the HiUGE technology, and the IP has been licensed to CasTag Biosciences. RY is a Reviewing Editor for eLife and is also a founder and shareholder of Florida Lifetime Imaging LLC, a company that helps people set up FLIM. SS has filed a patent application (16/968,904) related to the HiUGE technology, and the IP has been licensed to CasTag Biosciences, and is a founder of CasTag Biosciences. Duke as an institution holds equity in CasTag Biosciences.

Figures

Figure 1.
Figure 1.. Identification of the proteomic composition of the presynaptic cytomatrix using in vivo BioID.
(A) Schematic of the iBioID approach in presynaptic terminals. (B) Timeline of in vivo injections and sample collection. (C) Filters used to select proteins based on fold enrichment over negative control and FDR adjusted p-value (t-tests). (D) Synapsin iBioID identified a rich network of 200 known and previously unknown proteins enriched in presynaptic terminals. Node titles correspond to gene name, size represents fold enrichment over the BioID2 negative control (range 32.7–2275.1), shading represents FDR adjusted p-value with light blue being a lower p-value and darker blue a higher p-value (range 0.0003–0.049). Edges are previously reported protein-protein interactions in the HitPredict database or by hand annotation. (E) Clustergrams of proteins that are in synaptic vesicles (red, n=20/200 proteins) or active zones (orange, n=8); involved in endocytosis (green, n=22), exocytosis (cyan, n=30), or actin regulation (blue, n=54); have unknown function (navy, n=8); are implicated in neurological diseases (purple, n=46) as identified through DAVID analysis or hand annotation; and are known to be presynaptic (pink, n=108).
Figure 1—figure supplement 1.
Figure 1—figure supplement 1.. Validation of Synapsin iBioID probes in cultured hippocampal neurons.
(A–C) Representative images of localization (HA or GFP; green), biotinylation (Streptavidin; magenta), and a presynaptic marker (Bassoon; blue) in neurons expressing (A) BioID2-Linker-Synapsin1a-HA, the iBioID bait, (B) BioID2-HA, the negative control, and (C) GFP, a soluble fill. Scale bars, 40 μm. Insets show staining along axons. Scale bars, 10 μm. (D) Presynaptic enrichment of localization for all probes (BioID2 n=seven neurons/3 cultures, GFP n=8/3, BioID2-Synapsin n=7/3, Bassoon n=8/3); one-way ANOVA (F3,26=60.18, p<0.0001) with Tukey’s multiple comparisons test: BioID2 vs GFP (p=0.9526), BioID2 vs BioID2-Synapsin (p<0.0001), BioID2 vs Bassoon (p<0.0001), GFP vs BioID2-Synapsin (p<0.0001), GFP vs Bassoon (p<0.0001), BioID2-Synapsin vs Bassoon (p=0.9655). (E) Presynaptic enrichment of biotinylation for iBioID probes (BioID2 n=7/3, BioID2-Synapsin n=7/3); t-test (t12=5.943, p<0.0001). All data are mean ± SEM. ****p<0.0001, n.s. not significant.
Figure 2.
Figure 2.. Validation of the presynaptic localization of Synapsin iBioID proteins.
(A) Schematic of approach to tag endogenous proteins in neurons using HiUGE. Cultured hippocampal neurons were infected on DIV0 with AAVs containing the candidate sgRNA and a 2x-HA-V5-Myc HiUGE donor in the corresponding open reading frame. Neurons expressing a GFP cell fill were used as a control. (B) Quantification of presynaptic enrichment for GFP control (n=6 neurons), presynaptic marker Syn1 (Synapsin1, n=5), and candidate proteins (Abi2 n=6, Add1 n=5, Ctnnd2 n=5, Cttn n=5, Cttnbp2 n=5, Cyfip2 n=5, Dmtn n=5, Fam171b n=5, Lasp1 n=5, Nwd2 n=5, Ppp1r9b n=5, Tagln3 n=6, Trio n=5, Wipf3 n=6); one-way ANOVA (F15,68=5.401, p<0.0001) with Dunnett’s multiple comparisons test vs GFP: Syn1 (p<0.0001), Abi2 (p=0.0422), Add1 (p=0.0088), Ctnnd2 (p<0.0001), Cttn (p<0.0001), Cttnbp2 (p=0.0008), Cyfip2 (p=0.0032), Dmtn (p=0.0010), Fam171b (p=0.0215), Lasp1 (p=0.0156), Nwd2 (p<0.0001), Ppp1r9b (p=0.0030), Tagln3 (p=0.0437), Trio (p=0.0016), Wipf3 (p=0.0359). (C–Q) Representative images of the localization of candidate proteins (HA/V5/Myc or GFP; green) and a presynaptic marker (Synapsin1; magenta). Scale bars, 50 μm. Insets show staining along axons. The merged image contains only Synapsin1 puncta within the axon, and white arrows point to presynaptic terminals (colocalized puncta). Scale bars, 5 μm. All data are mean ± SEM. *p<0.05, **p<0.01, ***p<0.001, ****p<0.0001.
Figure 3.
Figure 3.. Actin signaling pathways in presynaptic terminals.
(A) Network showing the diversity of presynaptic actin signaling pathways in the Synapsin iBioID proteome. Node titles correspond to gene name, and node size emphasizes the proteins further studied. Colored nodes are actin regulators in the Synapsin iBioID network, while white nodes are proteins not enriched compared to negative control. Edges are previously reported protein-protein interactions in the HitPredict database or by hand annotation. (B) Regulators of actin nucleation in the Synapsin iBioID network converge on Arp2/3, which nucleates branched actin filaments, rather than on formins, which nucleate linear actin filaments; FDR-adjusted hypergeometric test on Synapsin iBioID vs mouse genome for Arp2/3 regulation (p=1.2x10⁻⁸) and formin regulation (p=0.2555). (C–D) Representative pre-embedding immunogold-labeled electron micrographs from 5- to 6-month-old mice in hippocampal CA1 for (C) Rac1 and (D) ArpC2. Dendritic spines are pseudocolored yellow, presynaptic terminals are pseudocolored blue, and yellow arrows point to synaptic clefts. Scale bars, 200 nm. (E–F) Axodendritic distribution of gold particles across the synapse coding for (E) Rac1 (n=30 synapses; 202 gold particles, blue; 428 synaptic vesicles, gray) and (F) ArpC2 (n=35 synapses; 452 gold particles, orange; 446 synaptic vesicles, gray). ****p<0.0001, n.s. not significant.
Figure 3—figure supplement 1.
Figure 3—figure supplement 1.. Additional analysis for immunogold electron microscopy.
(A) Four large overview images of Rac1 immunogold labeling in mouse hippocampal CA1. Scale bars, 1000 nm. (B) Distribution of presynaptic Rac1 gold particles among synaptic vesicles, plasma membranes, and mitochondria. (C) Four large overview images of ArpC2 immunogold labeling in mouse hippocampal CA1. Scale bars, 1000 nm. (D) Representative pre-embedding immunogold-labeled electron micrograph in mouse hippocampal CA1 with primary antibody omitted. Dendritic spines are pseudocolored yellow, presynaptic terminals are pseudocolored blue, and a yellow arrow points to the synaptic cleft. Scale bar, 200 nm. (E) Axodendritic distribution of gold particles across the synapse in negative control samples with primary antibody omitted (n=102 synapses; 164 gold particles, blue).
Figure 4.
Figure 4.. Presynaptic Rac1 negatively regulates synaptic vesicle replenishment.
(A) Schematic of mixed hippocampal neuron cultures to isolate effects of presynaptic Rac1 knockout. Whole-cell patch clamp recordings were conducted on tdTomato+ WT neurons with light delivered through the objective by a 460 nm LED. (B) Representative images of WT and KO cultures fixed on DIV16 and stained for ChR2-EYFP (blue), tdTomato (magenta), and Rac1 (green). Scale bars, 15 μm. (C–E) Light-evoked EPSCs in WT and KO cultures. Representative traces and quantification for: (C) PPR (WT n=15 neurons/3 cultures, KO n=17/3); two-way repeated measures ANOVA (F1,30=0.1462, p=0.7049). (D) Strontium-evoked qEPSCs (WT n=16/3, KO n=17/3) with amplitude (U=130, p=0.8451) and frequency (U=120, p=0.5814). (E) 20 Hz stimulation trains (WT n=15/3, KO n=16/3) with release probability (t29=0.4671, p=0.6439), RRP size (t29=1.271, p=0.2137), and replenishment rate (t29=2.574, p=0.0154). (F–H) Light-evoked IPSCs in WT and KO cultures. Representative traces and quantification for: (F) PPR (WT n=12/3, KO n=11/3); two-way repeated measures ANOVA (F1,21=0.04765, p=0.8293). (G) Strontium-evoked qIPSCs (WT n=13/3, KO n=12/3) with amplitude (t23=0.2064, p=0.6798) and frequency (t23=0.2064, p=0.8383). (H) 20 Hz stimulation trains (WT n=13/3, KO n=13/3) with release probability (t24=0.9657, p=0.3438), RRP size (t24=0.9253, p=0.3640), and replenishment rate (t29=2.382, p=0.0255). All data are mean ± SEM. *p<0.05, n.s. not significant. t values are t-tests, and U values are Mann-Whitney U-tests.
Figure 4—figure supplement 1.
Figure 4—figure supplement 1.. Characterization of neuronal cultures used for electrophysiology.
(A) Representative image of an entire coverslip used for presynaptic isolation. Presynaptic neurons expressing an opsin (ChR2-EYFP; green) were sparsely seeded amongst other neurons (NeuN; magenta). Scale bars, 2 mm and 250 μm (inset). (B) Number of presynaptic ChR2+ or ChrimsonR+ neurons per coverslip for each electrophysiology experiment. Figure 4 (WT n=three coverslips/3 cultures, KO n=3/3); t-test (t4=0.1364, p=0.8981). Figure 5 (WT n=3/3, KO n=3/3); t-test (t4=0.2703, p=0.8003). Figure 7 (WT Scr n=3/3, WT W56 n=3/3, KO Scr n=3/3, KO W56 n=3/3); one-way ANOVA (F3,8=0.1792, p=0.9075). Figure 8 (WT n=3/3, DN n=3/3, CA Scr n=3/3); one-way ANOVA (F2,6=0.6262, p=0.5663). (C) Schematic of CaMPARI2 experiment to assess the radius of activation by optical or electrical stimulation. (D) Representative images of entire coverslips without stimulation or with optical stimulation. All neurons are labeled by CaMPARI2-green (green), and activated neurons are labeled by CaMPARI2-red (magenta). Scale bars, 2 mm. (E) Representative image of a culture after electrical stimulation. All neurons are labeled by CaMPARI2-green (green), and activated neurons are labeled by CaMPARI2-red (magenta). Scale bar, 500 μm. (F–G) Estimated number of (F) excitatory and (G) inhibitory presynaptic neurons activated for each electrophysiology experiment. All data are mean ± SEM. n.s. not significant.
Figure 4—figure supplement 2.
Figure 4—figure supplement 2.. Single evoked currents and asynchronous release in Rac1 neurons.
(A) Traces of all analyzed EPSCs in presynaptic Rac1 KO experiments. (B) Examples of rejected responses contaminated by ‘polysynaptic’ or recurrent events. (C–D) Visual representation of steady-state basal current in (C) EPSC trains and (D) IPSC trains. (E) Quantification of single evoked EPSCs in Rac1 cultures (WT n=17 neurons/3 cultures, KO n=16/3) for amplitude (t31=0.3127, p=0.7566), charge (U=123, p=0.6567), rise time (t31=0.5223, p=0.6051), and decay time constant (t31=0.08846, p=0.9301). (F) Basal current in Rac1 EPSC trains (WT n=15/3, KO n=16/3; t29=0.2560, p=0.7998). (G) Quantification of IPSCs in Rac1 cultures (WT n=12/3, KO n=11/3) for amplitude (t21=0.01487, p=0.9883), charge (t21=0.07053, p=0.9444), rise time (t21=0.5311, p=0.6009), and decay time constant (t21=0.3887, p=0.7014). (H) Basal current in Rac1 IPSC trains (WT n=13/3, KO n=13/3; U=83, p=0.9598). All data are mean ± SEM. n.s. not significant. t values are t-tests, and U values are Mann-Whitney U-tests.
Figure 4—figure supplement 3.
Figure 4—figure supplement 3.. Comparison of optogenetic and electrical stimulation in elevated extracellular calcium.
(A) Schematic of mixed hippocampal cultures. Whole-cell patch clamp recordings were conducted on non-fluorescent WT neurons with light delivered through the objective by a 460 nm LED and electrical stimulation delivered by a bipolar electrode. Recordings were conducted in 2 mM or 4 mM extracellular calcium. (B) Light-evoked EPSCs. Representative traces and quantification for 20 Hz stimulation trains (2 mM n=17/3, 4 mM n=14/3) with release probability (t29=2.855, p=0.0079), RRP size (U=101, p=0.4928), and replenishment rate (U=118, p=0.9844). (C) Light-evoked IPSCs. Representative traces and quantification for 20 Hz stimulation trains (2 mM n=14/3, 4 mM n=15/3) with release probability (t27=2.207, p=0.0360), RRP size (U=71, p=0.1456), and replenishment rate (U=65, p=0.0848). (D) Electrically-evoked EPSCs. Representative traces and quantification for 20 Hz stimulation trains (2 mM n=17/3, 4 mM n=15/3) with release probability (t30=2.202, p=0.0355), RRP size (U=110, p=0.5261), and replenishment rate (U=96, p=0.2455). (E) Electrically evoked IPSCs. Representative traces and quantification for 20 Hz stimulation trains (2 mM n=13/3, 4 mM n=17/3) with release probability (t28=2.287, p=0.0300), RRP size (U=77, p=0.1698), and replenishment rate (t28=0.9130, p=0.3690). All data are mean ± SEM. *p<0.05, **p<0.01, n.s. not significant. t values are t-tests, and U values are Mann-Whitney U-tests.
Figure 5.
Figure 5.. Presynaptic Arp2/3 negatively regulates release probability and synaptic vesicle replenishment.
(A) Schematic of mixed hippocampal neuron cultures to isolate effects of presynaptic Arpc3 knockout. (B) Representative images of WT and KO cultures fixed on DIV16 and stained for ChR2-EYFP (blue), tdTomato (magenta), and DAPI (green). Scale bars, 25 μm. (C–E) Light-evoked EPSCs in WT and KO cultures. Traces and quantification for: (C) PPR (WT n=10 neurons/3 cultures, KO n=12/3); two-way repeated measures ANOVA (F1,20=22.50, p=0.0001) with Sidak’s multiple comparisons test: 25 ms (p=0.0435), 50 ms (p=0.0194), 100 ms (p=0.0099), 500 ms (p=0.2168), 1000 ms (p=0.2319), 2000 ms (p=0.6130). (D) Strontium-evoked qEPSCs (WT n=9/3, KO n=8/3) with amplitude (U=31, p=0.6730) and frequency (t15=2.973, p=0.0095). (E) 20 Hz stimulation trains (WT n=10/3, KO n=10/3) with release probability (t18=2.107, p=0.0494), RRP size (t18=0.3957, p=0.3957), and replenishment rate (t18=2.215, p=0.0399). (F–H) Light-evoked IPSCs in WT and KO cultures. Traces and quantification for: (F) PPR (WT n=14/3, KO n=13/3); two-way repeated measures ANOVA (F1,25=16.41, p=0.0004) with Sidak’s multiple comparisons test: 25 ms (p=0.0022), 50 ms (p=0.0117), 100 ms (p=0.0111), 500 ms (p=0.4100), 1000 ms (p=0.9999), 2000 ms (p=0.3992). (G) Strontium-evoked qIPSCs (WT n=14/3, KO n=15/3) with amplitude (t27=0.3989, p=0.6931) and frequency (t27=2.471, p=0.0201). (H) 20 Hz stimulation trains (WT n=14/3, KO n=14/3) with release probability (U=52, p=0.0350), RRP size (t26=0.6733, p=0.5067) and replenishment rate (t26=3.621, p=0.0012). All data are mean ± SEM. *p<0.05, **p<0.01, n.s. not significant. t values are t-tests, and U values are Mann-Whitney U-tests.
Figure 5—figure supplement 1.
Figure 5—figure supplement 1.. Single evoked currents and asynchronous release in Arpc3 neurons.
(A) Quantification of EPSCs in Arpc3 cultures (WT n=10/3, KO n=10/3) for amplitude (t18=2.323, p=0.0321), charge (t18=2.127, p=0.0475), rise time (U=38, p=0.3811), and decay time constant (U=17, p=0.0111). (B) Basal current in Arpc3 EPSC trains (WT n=10/3, KO n=10/3; U=42, p=0.5787). (C) Quantification of IPSCs in Arpc3 cultures (WT n=12/3, KO n=14/3) for amplitude (U=44, p=0.0407), charge (U=42, p=0.0310), rise time (U=78, p=0.7810), and decay time constant (U=36, p=0.0127). (D) Basal current in Arpc3 IPSC trains (WT n=14/3, KO n=14/3; U=72, p=0.2456). All data are mean ± SEM. *p<0.05, n.s. not significant. t values are t-tests, and U values are Mann-Whitney U-tests.
Figure 5—figure supplement 2.
Figure 5—figure supplement 2.. ArpC3 loss does not affect the density of synapses formed along axons.
(A) Schematic of mixed hippocampal neuron cultures to isolate effects of Arpc3 knockout on axonal synapse density. Arpc3fl/fl;Ai14 neurons were electroporated with tdTomato and sparsely seeded amongst WT neurons on DIV0. To limit developmental effects, AAV-hSyn-Cre was added on DIV10 to half the coverslips. Neurons were fixed on DIV16 and stained for excitatory (Synapsin1, Homer1) or inhibitory (Vgat, Gephyrin) synapse markers. (B) Excitatory synapse density along axons (WT n=24 neurons/3 cultures, KO n=24/3); t-test (t46=0.8180, p=0.4176). (C) Inhibitory synapse density along axons (WT n=24/3, KO n=23/3); t-test (t45=0.9572, p=0.9572). (D–E) Representative images of (D) WT and (E) KO axons stained for tdTomato (blue), Synapsin1 (green), and Homer1 (magenta). Synapsin1 puncta were masked inside tdTomato+ axons and counted as synapses (yellow arrows) if they colocalized with Homer1 puncta. Scale bars: 10 μm. (F–G) Representative images of (F) WT and (G) KO axons stained for tdTomato (blue), Vgat (green), and Gephyrin (magenta). Vgat puncta were masked inside tdTomato+ axons and counted as synapses (yellow arrows) if they colocalized with Gephyrin puncta. Scale bars, 10 μm. All data are mean ± SEM. n.s. not significant.
Figure 5—figure supplement 3.
Figure 5—figure supplement 3.. Action potential firing and intrinsic membrane properties in Rac1 and Arpc3 neurons.
(A) Schematic of Rac1 mixed hippocampal neuron cultures. Current clamp recordings were conducted from ChR2+ neurons with light delivered through the objective by a 460 nm LED (WT n=12 neurons/3 cultures, KO n=12/3). (B) Probability of firing action potentials during a 20 Hz light stimulation train (two-way repeated measures ANOVA, F1,22=0.004558, p=0.9468). (C) Resting membrane potential (t22=0.2579, p=0.7989). (D) Waveforms of light-evoked action potentials and quantification of threshold (U=65, p=0.7125), height (t22=0.6447, p=0.5258), and half-width (t22=0.8472, p=0.4060). (E) Waveforms of action potentials elicited by current injection and quantification of threshold (t22=0.1823, p=0.8571), height (t22=0.1056, p=0.9168), and half-width (t22=0.0502, p=0.9604). (F) Schematic of Arpc3 mixed hippocampal neuron cultures and current clamp recordings (WT n=14/3, KO n=13/3). (G) Probability of firing action potentials during a 20 Hz light stimulation train (two-way repeated measures ANOVA, F1,25=0.07845, p=0.7817). (H) Resting membrane potential (t25=1.068, p=0.2959). (I) Waveforms of light-evoked action potentials and quantification of threshold (t25=0.7780, p=0.4438), height (t25=0.4700, p=0.6424), and half-width (t25=2.745, p=0.0111). (J) Waveforms of action potentials elicited by current injection and quantification of threshold (t25=0.8628, p=0.3964), height (t25=0.2601, p=0.7969), and half-width (t25=2.991, p=0.0062). All data are mean ± SEM. *p<0.05, **p<0.01, n.s. not significant. t values are t-tests, and U values are Mann-Whitney U-tests.
Figure 6.
Figure 6.. Rac1 alters vesicle replenishment specifically at presynaptic terminals.
(A) Schematic of hippocampal cultures expressing presynaptic Rac1 inhibitory peptide (W56) or scrambled control (Scr). Whole-cell patch clamp recordings were conducted with local electrical stimulation. (B) Scr and W56 cultures fixed on DIV16 and stained for inhibitory peptide (green) and Bassoon (magenta). Scale bars, 15 μm. (C–E) Electrically-evoked EPSCs in Scr and W56 cultures. Traces and quantification for: (C) PPR (Scr n=16 neurons/3 cultures, W56 n=17/3); two-way repeated measures ANOVA (F1,31=1.615, p=0.2132). (D) mEPSCs (Scr n=13/3, W56 n=13/3) with amplitude (U=64, p=0.3107) and frequency (U=70, p=0.4793). (E) Above, 20 Hz trains (Scr n=12/3, W56 n=15/3) with release probability (U=70, p=0.3473), RRP size (t25=0.8585, p=0.3988), and replenishment rate (U=49, p=0.0469). Below, 40 Hz trains (Scr n=10/3, W56 n=13/3) with release probability (t21=0.5251, p=0.6050), RRP size (t21=0.5475, p=0.5898), and replenishment rate (t21=2.978, p=0.0072). (F–H) Electrically-evoked IPSCs in Scr and W56 cultures. Traces and quantification for: (F) PPR (Scr n=19 neurons/3 cultures, W56 n=15/3); two-way repeated measures ANOVA (F1,32=0.03661, p=0.8495). (G) mIPSCs (Scr n=14/3, W56 n=13/3) with amplitude (t25=1.179, p=0.2496) and frequency (t25=0.7157, p=0.4808). (H) Above, 20 Hz trains (Scr n=15/3, W56 n=15/3) with release probability (t28=0.7675, p=0.4492), RRP size (U=76, p=0.1370), and replenishment rate (U=47, p=0.0057). Below, 40 Hz trains (Scr n=14/3, W56 n=10/3) with release probability (t22=0.5199, p=0.6083), RRP size (U=58, p=0.5080), and replenishment rate (U=36, p=0.0484). All data are mean ± SEM. *p<0.05, **p<0.01, n.s. not significant. t values are t-tests, and U values are Mann-Whitney U-tests.
Figure 6—figure supplement 1.
Figure 6—figure supplement 1.. Single evoked currents and asynchronous release with presynaptic Rac1 inhibition.
(A) Quantification of EPSCs in cultures with presynaptic Rac1 inhibitory peptide (Scr n=17/3, W56 n=17/3) for amplitude (t32=0.3037, p=0.7634), charge (U=126, p=0.5401), rise time (U=125, p=0.5177), and decay time constant (U=123, p=0.4745). (B) Basal current in Rac1 inhibitory peptide EPSC trains (Scr n=12/3, W56 n=15/3; U=83, p=0.7551). (C) Representative traces and quantification for evoked excitatory responses with 500 mM hypertonic sucrose (Scr n=19/3, W56 n=19/3). Left, transient charge transfer (U=148, p=0.3543). Right, steady-state corrected charge transfer (U=171, p=0.7951). (D) Quantification of IPSCs in cultures with presynaptic Rac1 inhibitory peptide (Scr n=19/3, W56 n=15/3) for amplitude (t32=0.7145, p=0.4801), charge (t32=0.8440, p=0.4049), rise time (U=127, p=0.6074), and decay time constant (t32=0.01747, p=0.9862). (E) Basal current in Rac1 inhibitory peptide IPSC trains (Scr n=15/3, W56 n=15/3; t28=0.3981, p=0.6936). (F) Representative traces and quantification for evoked inhibitory responses with 500 mM hypertonic sucrose (Scr n=19/3, W56 n=19/3). Left, transient charge transfer (U=151, p=0.4016). Right, steady-state corrected charge transfer (t36=0.5580, p=0.5803). All data are mean ± SEM. n.s. not significant. t values are t-tests, and U values are Mann-Whitney U-tests.
Figure 7.
Figure 7.. Arp2/3 loss occludes replenishment rate changes by presynaptic Rac1.
(A) Schematic of mixed hippocampal cultures to inhibit presynaptic Rac1 in Arpc3 knockout neurons. Whole-cell patch clamp recordings were conducted on non-fluorescent WT neurons with light delivered through the objective by a 525–660 nm LED. (B) Representative images of WT and KO cultures fixed on DIV16 and stained for ChrimsonR-tdT (magenta), Rac1 inhibitory peptide (green), and DAPI (blue). Scale bars, 30 μm. (C) Light-evoked EPSCs in Arpc3 WT cultures. Representative traces and quantification for 20 Hz stimulation trains (Scr n=17/3, W56 n=21/3) with release probability (t36=0.3696, p=0.7139), RRP size (U=149, p=0.3990), and replenishment rate (t36=3.110, p=0.0036). (D) Light-evoked EPSCs in Arpc3 KO cultures. Representative traces and quantification for 20 Hz stimulation trains (Scr n=25/3, W56 n=23/3) with release probability (U=279, p=0.8701), RRP size (U=268, p=0.6976), and replenishment rate (U=243, p=0.3672). (E) Light-evoked IPSCs in Arpc3 WT cultures. Representative traces and quantification for 20 Hz stimulation trains (Scr n=17/3, W56 n=21/3) with release probability (t36=0.03395, p=0.9731), RRP size (U=146, p=0.3517), and replenishment rate (U=107, p=0.0360). (F) Light-evoked IPSCs in Arpc3 KO cultures. Representative traces and quantification for 20 Hz stimulation trains (Scr n=18/3, W56 n=18/3) with release probability (t34=0.6273, p=0.5346), RRP size (U=150, p=0.7193), and replenishment rate (U=153, p=0.7905). All data are mean ± SEM. *p<0.05, **p<0.01, n.s. not significant. t values are t-tests, and U values are Mann-Whitney U-tests.
Figure 8.
Figure 8.. Bidirectional control of presynaptic Rac1 signaling modulates short-term synaptic depression.
(A) Schematic of constructs created to control the firing of presynaptic neurons with reduced or enhanced Rac1 signaling. ChrimsonR-tdTomato was expressed alone as a control (WT), or co-expressed with HA-tagged photoactivatable Rac1 (PA-Rac1) with dominant negative (DN) or constitutively active (CA) mutations. Insets are representative images of WT, DN, and CA cultures fixed on DIV14 and stained for tdTomato (magenta) and HA (blue). Scale bars, 50 μm. (B) Schematic of experimental design. Whole-cell patch clamp recordings were conducted on non-fluorescent neurons with light delivered through the objective by an LED. The ‘Before’ 20 Hz train was evoked by 525–660 nm light. After waiting 1 min for recovery, PA-Rac1 was brought into the open configuration by 460 nm light to modulate presynaptic Rac1 signaling. Then, the ‘After’ 20 Hz train was evoked by 525–660 nm light. (C–E) Representative traces and quantification of before and after EPSC trains in (C) WT cultures (black, gray, n=21 neurons/3 cultures), (D) DN cultures (blue, cyan, n=15/3), and (E) CA cultures (green, lime, n=16/3). (F–H) Estimates from cumulative EPSCs in all cultures of: (F) Release probability; WT (U=217, p=0.9355), DN (t28=0.1803, p=0.8582), CA (U=108, p=0.4677). (G) RRP size; WT (U=217, p=0.9355), DN (t28=0.1081, p=0.9147), and CA (U=124, p=0.8965). (H) Replenishment rate; WT (U=182, p=0.3394), DN (t28=2.800, p=0.0092), CA (U=48, p=0.0019). All data are mean ± SEM. **p<0.01, n.s. not significant. t values are t-tests, and U values are Mann-Whitney U-tests.
Figure 9.
Figure 9.. Action potential trains activate Rac1 in presynaptic terminals.
(A) Experimental design in organotypic hippocampal slices. (B) Schematic of Rac1 sensor. Activation of Rac1 leads to its association with the GTPase-binding domain of Pak2R71C,S78A (PBD2), increasing FRET between GFP and mCherry. This is measured as a decrease in fluorescence lifetime, or an increase in binding fraction. (C) Representative 2pFLIM images of a bouton before and after stimulation for 2 s at 50 Hz. Scale bar, 1 μm. (D) Mean time course of the change in binding fraction of the Rac1 sensor in aCSF (cyan, n=15 boutons/5 slices) with (E) quantification; one-way repeated measures ANOVA (F6,84=3.89, p=0.0018) with Dunnett’s multiple comparisons test vs the baseline (−30–0 s): 0–30 s (p=0.0005), 30–60 s (p=0.0102), 60–90 s (p=0.0142), 90–120 s (p=0.2881), 120–150 s (p=0.6807). (F) Mean time course of Rac1 sensor in TTX (black, n=12/4) with (G) quantification; one-way repeated measures ANOVA (F6,66=0.8539, p=0.5334) with Dunnett’s multiple comparisons test vs the baseline (−30–0 s): 0–30 s (p=0.9930), 30–60 s (p=0.9839), 60–90 s (p=0.6430), 90–120 s (p=0.7654), 120–150 s (p=0.6548). (H) Mean time course of Rac1 sensor in Cd2+ (green, n=13/4) with (I) quantification; one-way repeated measures ANOVA (F6,72=0.2728, p=0.9479) with Dunnett’s multiple comparisons test vs the baseline (−30–0 s): 0–30 s (p>0.9999), 30–60 s (p=0.9996), 60–90 s (p=0.9996), 90–120 s (p=0.9997), 120–150 s (p=0.8896). All data are mean ± SEM. *p<0.05, ***p<0.001, n.s. not significant.
Figure 9—figure supplement 1.
Figure 9—figure supplement 1.. Presynaptic boutons in organotypic slices used for 2pFLIM contain Synapsin.
(A) Representative image of an organotypic hippocampal slice microinjected in CA3 with AAV-mEGFP-Rac1 and AAV-mCherry-PBD2-mCherry on DIV10 and fixed and stained on DIV20 for DAPI (blue), GFP (green), mCherry (magenta), and Synapsin1 (cyan). Scale bar, 300 μm. (B) Representative image of axons in CA1 expressing the Rac1 activity sensor. Green arrow points to a Synapsin1+ bouton, and magenta arrow points to a bouton without Synapsin1 staining. Scale bar, 15 μm. (C) Quantification of percent of GFP+ mCherry+ boutons with Synapsin1 staining (n=142 boutons/8 slices). All data are mean ± SEM.

References

    1. Abiria SA, Colbran RJ. CaMKII associates with CaV1.2 L-type calcium channels via selected beta subunits to enhance regulatory phosphorylation. Journal of Neurochemistry. 2010;112:150–161. doi: 10.1111/j.1471-4159.2009.06436.x. - DOI - PMC - PubMed
    1. Abul-Husn NS, Bushlin I, Morón JA, Jenkins SL, Dolios G, Wang R, Iyengar R, Ma'ayan A, Devi LA. Systems approach to explore components and interactions in the presynapse. Proteomics. 2009;9:3303–3315. doi: 10.1002/pmic.200800767. - DOI - PMC - PubMed
    1. Amendola J, Boumedine N, Sangiardi M, El Far O. Optimization of neuronal cultures from rat superior cervical ganglia for dual patch recording. Scientific Reports. 2015;5:14455. doi: 10.1038/srep14455. - DOI - PMC - PubMed
    1. Arai R, Ueda H, Kitayama A, Kamiya N, Nagamune T. Design of the linkers which effectively separate domains of a bifunctional fusion protein. Protein Engineering Design and Selection. 2001;14:529–532. doi: 10.1093/protein/14.8.529. - DOI - PubMed
    1. Aurnhammer C, Haase M, Muether N, Hausl M, Rauschhuber C, Huber I, Nitschko H, Busch U, Sing A, Ehrhardt A, Baiker A. Universal real-time PCR for the detection and quantification of adeno-associated virus serotype 2-derived inverted terminal repeat sequences. Human Gene Therapy Methods. 2012;23:18–28. doi: 10.1089/hgtb.2011.034. - DOI - PubMed

Publication types