

Impact of Anaerobic Antibacterial Spectrum on Cystic Fibrosis Airway Microbiome Diversity and Pulmonary Function
- PMID: 34269323
- PMCID: PMC8511214
- DOI: 10.1097/INF.0000000000003211
Impact of Anaerobic Antibacterial Spectrum on Cystic Fibrosis Airway Microbiome Diversity and Pulmonary Function
Abstract
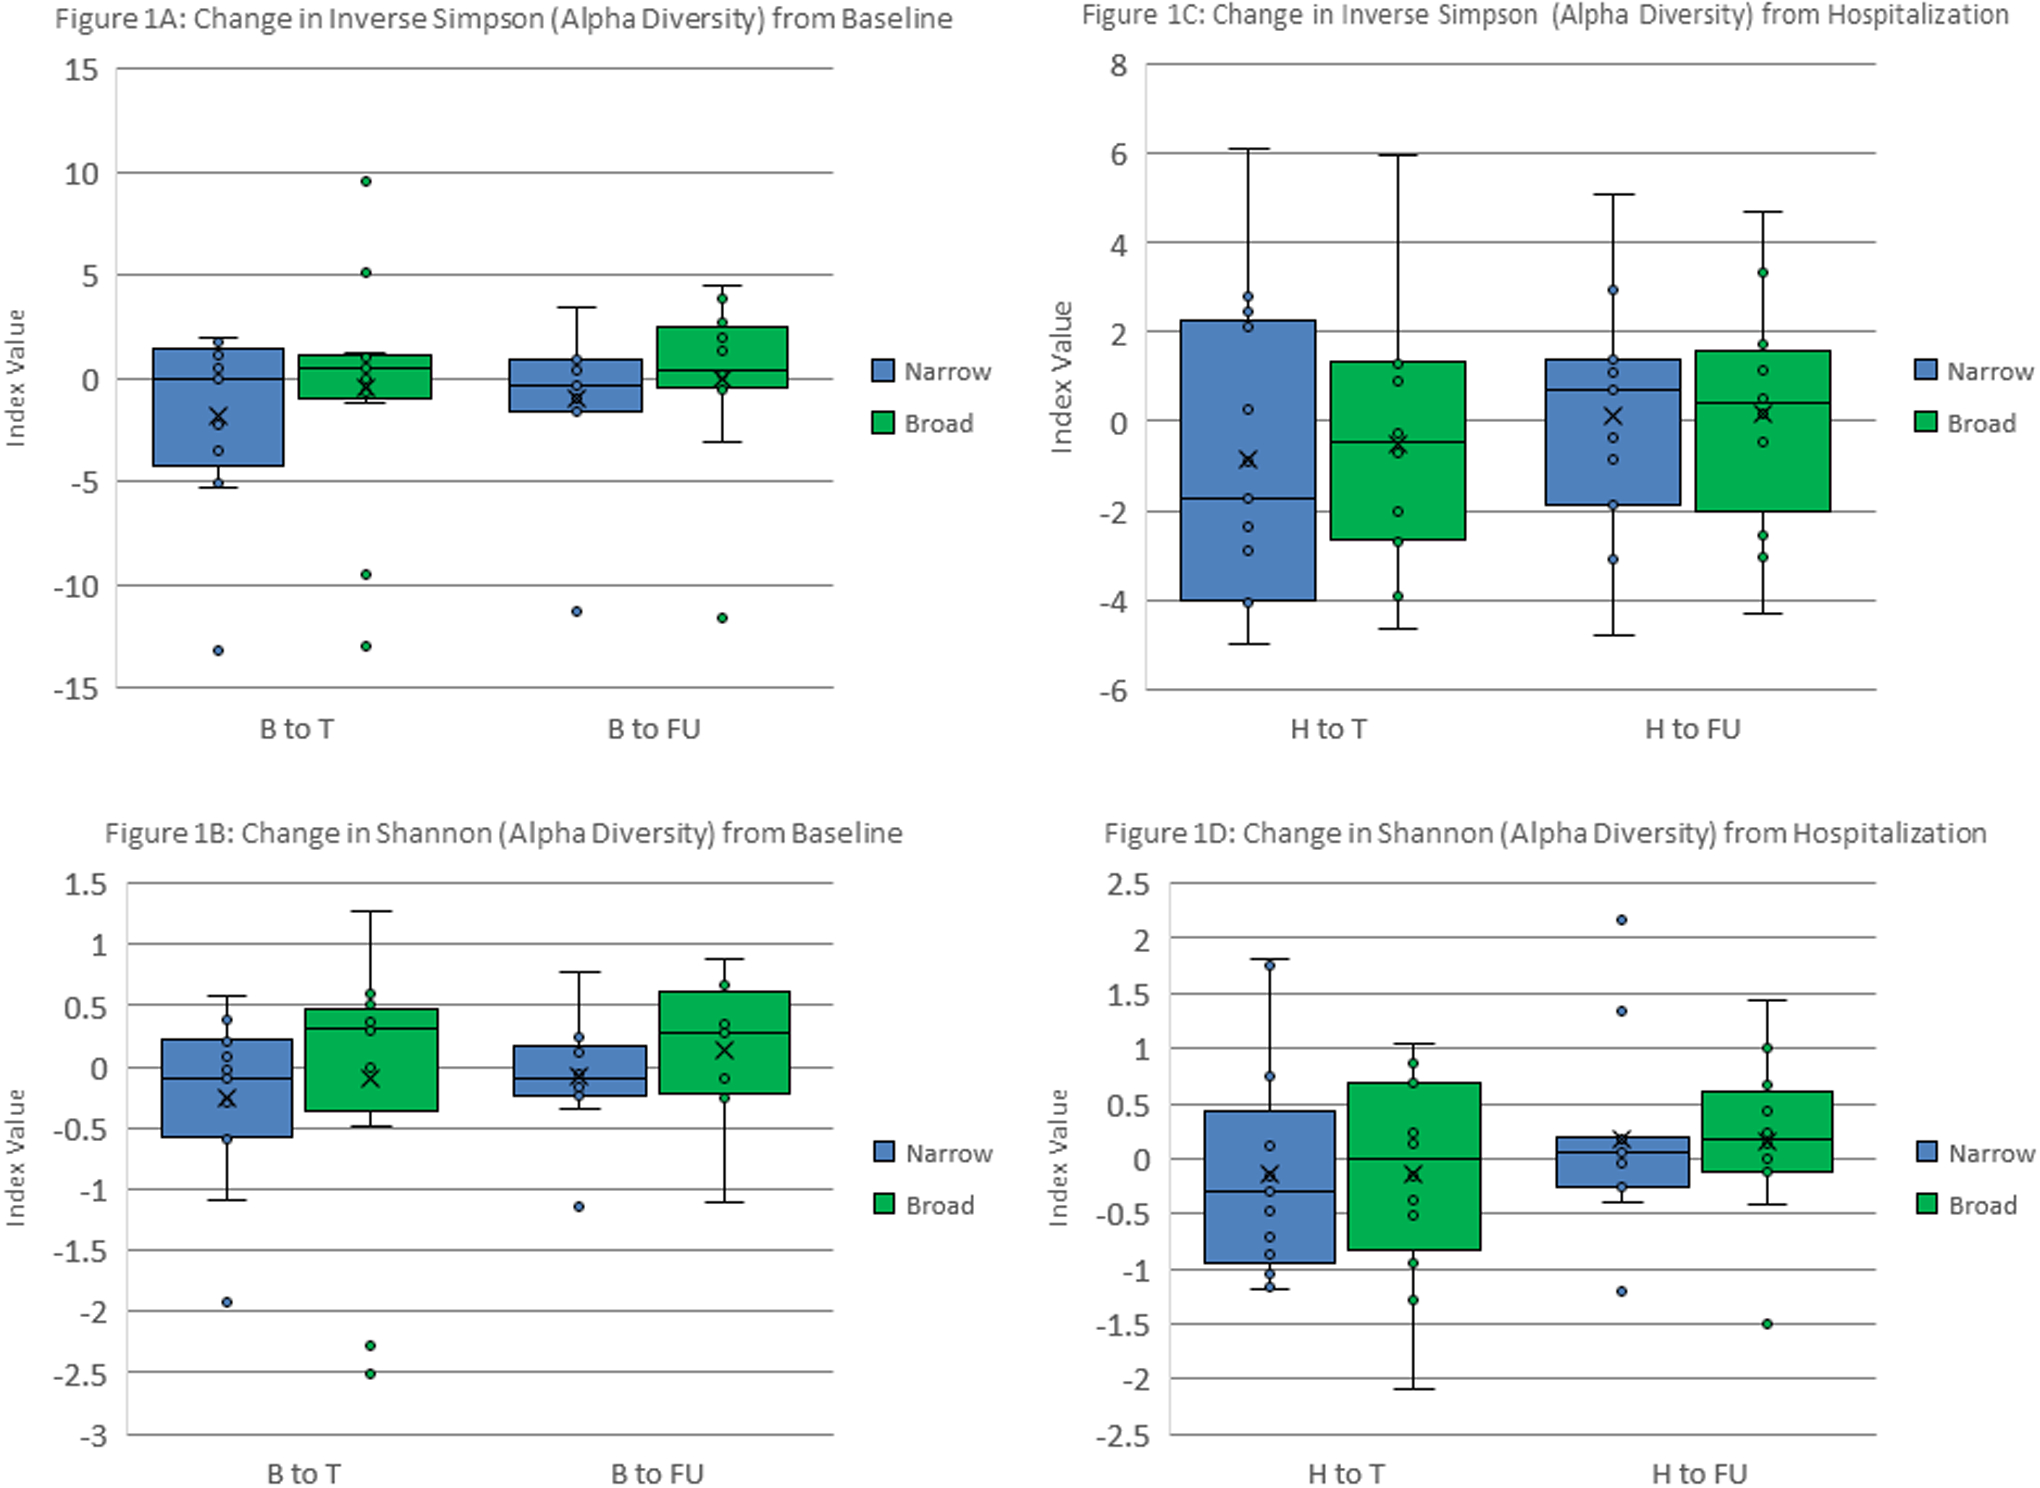
Background: The role of anaerobic organisms in the cystic fibrosis (CF) lung microbiome is unclear. Our objectives were to investigate the effect of broad (BS) versus narrow (NS) spectrum antianaerobic antibiotic activity on lung microbiome diversity and pulmonary function, hypothesizing that BS antibiotics would cause greater change in microbiome diversity without a significant improvement in lung function.
Methods: Pulmonary function tests and respiratory samples were collected prospectively in persons with CF before and after treatment for pulmonary exacerbations. Treatment antibiotics were classified as BS or NS. Gene sequencing data from 16S rRNA were used for diversity analysis and bacterial genera classification. We compared the effects of BS versus NS on diversity indices, lung function and anaerobic/aerobic ratios. Statistical significance was determined by multilevel mixed-effects generalized linear models and mixed-effects regression models.
Results: Twenty patients, 6-20 years of age, experienced 30 exacerbations. BS therapy had a greater effect on beta diversity than NS therapy when comparing time points before antibiotics to after and at recovery. After antibiotics, the NS therapy group had a greater return toward baseline forced expiratory volume at 1 second and forced expiratory flow 25%-75% values than the BS group. The ratio of anaerobic/aerobic organisms showed a predominance of anaerobes in the NS group with aerobes dominating in the BS group.
Conclusions: BS antianaerobic therapy had a greater and possibly longer lasting effect on the lung microbiome of persons with CF, without achieving the recovery of pulmonary function seen with the NS therapy. Specific antibiotic therapies may affect disease progression by changing the airway microbiome.
Copyright © 2021 Wolters Kluwer Health, Inc. All rights reserved.
Conflict of interest statement
A.H. and the data in this study were funded by the National Heart, Lung and Blood Institute award number K12HL119994; partially supported by the National Center for Advancing Translational Sciences, award number UL1TR000075. A.H. is also supported by a Harry Shwachman Award through the Cystic Fibrosis Foundation. The other authors have no conflicts of interest to disclose.
Figures


Similar articles
-
Changes in Airway Microbiome and Inflammation with Ivacaftor Treatment in Patients with Cystic Fibrosis and the G551D Mutation.Ann Am Thorac Soc. 2020 Feb;17(2):212-220. doi: 10.1513/AnnalsATS.201907-493OC. Ann Am Thorac Soc. 2020. PMID: 31604026 Free PMC article.
-
Lung function and microbiota diversity in cystic fibrosis.Microbiome. 2020 Apr 2;8(1):45. doi: 10.1186/s40168-020-00810-3. Microbiome. 2020. PMID: 32238195 Free PMC article.
-
The effects of inhaled aztreonam on the cystic fibrosis lung microbiome.Microbiome. 2017 May 5;5(1):51. doi: 10.1186/s40168-017-0265-7. Microbiome. 2017. PMID: 28476135 Free PMC article.
-
Microbiome in the pathogenesis of cystic fibrosis and lung transplant-related disease.Transl Res. 2017 Jan;179:84-96. doi: 10.1016/j.trsl.2016.07.022. Epub 2016 Aug 4. Transl Res. 2017. PMID: 27559681 Review.
-
Microbial diversity within the airway microbiome in chronic pediatric lung diseases.Infect Genet Evol. 2018 Sep;63:316-325. doi: 10.1016/j.meegid.2017.12.006. Epub 2017 Dec 7. Infect Genet Evol. 2018. PMID: 29225146 Free PMC article. Review.
Cited by
-
Therapeutic beta-lactam dosages and broad-spectrum antibiotics are associated with reductions in microbial richness and diversity in persons with cystic fibrosis.Sci Rep. 2023 Jan 21;13(1):1217. doi: 10.1038/s41598-023-27628-x. Sci Rep. 2023. PMID: 36681756 Free PMC article.
-
Physiology and pathophysiology of human airway mucus.Physiol Rev. 2022 Oct 1;102(4):1757-1836. doi: 10.1152/physrev.00004.2021. Epub 2022 Jan 10. Physiol Rev. 2022. PMID: 35001665 Free PMC article. Review.
-
Measuring the impact of an empiric antibiotic algorithm for pulmonary exacerbation in children and young adults with cystic fibrosis.Pediatr Pulmonol. 2022 Apr;57(4):965-975. doi: 10.1002/ppul.25840. Epub 2022 Feb 4. Pediatr Pulmonol. 2022. PMID: 35084122 Free PMC article.
-
Acute polymicrobial airway infections: analysis in cystic fibrosis mice.Microbiology (Reading). 2023 Jan;169(1):001290. doi: 10.1099/mic.0.001290. Microbiology (Reading). 2023. PMID: 36748431 Free PMC article.
References
-
- O’Sullivan BP, Freedman SD. Cystic fibrosis. The Lancet. 2009;373(9678):1891–1904. - PubMed
-
- Surette MG. The Cystic Fibrosis Lung Microbiome. Ann Am Thorac Soc. 2014;11(Supplement 1):S61–S65. - PubMed
-
- 2017 Cystic Fibrosis Patient Registry Annual Data Report. 2017:96.
-
- Gibson RL, Burns JL, Ramsey BW. Pathophysiology and Management of Pulmonary Infections in Cystic Fibrosis. Am J Respir Crit Care Med. 2003;168(8):918–951. - PubMed
Publication types
MeSH terms
Substances
Grants and funding
LinkOut - more resources
Full Text Sources
Medical
Miscellaneous
