. 2021 Sep 6;153(9):e202012854.
doi: 10.1085/jgp.202012854. Epub 2021 Jul 16.

L-type channel inactivation balances the increased peak calcium current due to absence of Rad in cardiomyocytes

Affiliations

L-type channel inactivation balances the increased peak calcium current due to absence of Rad in cardiomyocytes

Brooke M Ahern et al. J Gen Physiol. .

Abstract

The L-type Ca2+ channel (LTCC) provides trigger calcium to initiate cardiac contraction in a graded fashion that is regulated by L-type calcium current (ICa,L) amplitude and kinetics. Inactivation of LTCC is controlled to fine-tune calcium flux and is governed by voltage-dependent inactivation (VDI) and calcium-dependent inactivation (CDI). Rad is a monomeric G protein that regulates ICa,L and has recently been shown to be critical to β-adrenergic receptor (β-AR) modulation of ICa,L. Our previous work showed that cardiomyocyte-specific Rad knockout (cRadKO) resulted in elevated systolic function, underpinned by an increase in peak ICa,L, but without pathological remodeling. Here, we sought to test whether Rad-depleted LTCC contributes to the fight-or-flight response independently of β-AR function, resulting in ICa,L kinetic modifications to homeostatically balance cardiomyocyte function. We recorded whole-cell ICa,L from ventricular cardiomyocytes from inducible cRadKO and control (CTRL) mice. The kinetics of ICa,L stimulated with isoproterenol in CTRL cardiomyocytes were indistinguishable from those of unstimulated cRadKO cardiomyocytes. CDI and VDI are both enhanced in cRadKO cardiomyocytes without differences in action potential duration or QT interval. To confirm that Rad loss modulates LTCC independently of β-AR stimulation, we crossed a β1,β2-AR double-knockout mouse with cRadKO, resulting in a Rad-inducible triple-knockout mouse. Deletion of Rad in cardiomyocytes that do not express β1,β2-AR still yielded modulated ICa,L and elevated basal heart function. Thus, in the absence of Rad, increased Ca2+ influx is homeostatically balanced by accelerated CDI and VDI. Our results indicate that the absence of Rad can modulate the LTCC without contribution of β1,β2-AR signaling and that Rad deletion supersedes β-AR signaling to the LTCC to enhance in vivo heart function.


Figures

Figure 1.
Figure 1.
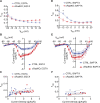
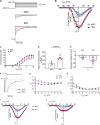
Rad deletion ICa,L phenocopies modulated ICa,L. (A) Exemplar Ca2+ currents with 10 mM EGTA for CTRL with ISO (green) and cRadKO (no ISO; red). Traces are normalized to peak current at 0 mV. Scale bar, 100 ms. Black dots indicate r30; black stars indicate r150. (B–E) Remaining current across voltage steps 30 ms after peak (B) and 150 ms after peak (C). ICa,L current density 30 ms (D) and 150 ms (E) after peak. Data in B and C were analyzed by two-way ANOVA plus Šídák’s multiple comparisons test. n = 4 mice, n = 7 cells for CTRL; n = 10 mice, n = 23 cells for cRadKO. (F) Facilitation measured as peak current (without ISO) across multiple pulses of cells at 1 Hz normalized to the first pulse, then pooled, demonstrating significant increase in current across pulses in cRadKO (*, P = 0.03; **, P = 0.002; ***, P = 0.0008); there was no significant difference in current across pulses in CTRL. Data are presented as mean ± SEM values. Data in F were analyzed by one-sample t test compared with a hypothetical mean of 1. Data in F are displayed from n = 4 mice, 11 cells for CTRL; n = 4 mice, n = 7 cells for cRadKO.
Figure S1.
Figure S1.
ISO effect on CTRL ICa,L. (A) CTRL ICa,L current density 30 ms after peak before and after treatment with ISO. (B) ISO significantly increased current density at r30 in CTRL (at +5 mV; **, P = 0.007). CTRL: n = 4 mice, n = 7 cells. Data in A are presented as mean ± SEM values.
Figure S2.
Figure S2.
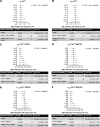
Two-way ANOVA 95% confidence intervals and tabular results. (A) 95% confidence intervals and tabular results for Fig. 1 B. (B) 95% confidence intervals and tabular results for Fig. 1 C. (C) 95% confidence intervals and tabular results for Fig. 2 B. (D) 95% confidence intervals and tabular results for Fig. 3 B. (E) 95% confidence intervals and tabular results for Fig. 5 A. (F) 95% confidence intervals and tabular results for Fig. 5 D. Data are presented as mean ± 95% confidence intervals.*, P < 0.05; **, P < 0.01; ***, P < 0.001; ****, P < 0.0001. DFn and DFd are degrees of freedom in the numberator and demoninator, respectively.
Figure 2.
Figure 2.
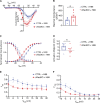
Rad deletion accelerates fast component of ICa,L decay. (A) Exemplar Ca2+ currents with 10 mM EGTA for CTRL (blue) and cRadKO (red). Traces were normalized to peak current at 0 mV. Scale bar, 100 ms. Black dots indicate r30. (B) Remaining current 30 ms after peak across voltage steps. (C) ICa,L current density 30 ms after peak. (D) Regression plot of the absolute values of current density versus r30 (CTRL: slope = −0.01, deviation from zero: P = 0.28, r2 = 0.5; cRadKO: slope = 0.03, deviation from zero: P = 0.002, r2 = 0.4; dotted lines represent 95% confidence intervals). Data in B and C are presented as mean ± SEM values. Data in B were analyzed by two-way ANOVA plus Šídák’s multiple comparisons test (for between CTRL and cRadKO: *, P < 0.05; **, P < 0.01; ***, P < 0.001; and ****, P < 0.0001, alternating asterisks for presentation clarity). Data in D were analyzed by simple linear regression. n = 10 mice, n = 25 cells for CTRL; n = 10 mice, n = 23 cells for cRadKO.
Figure 3.
Figure 3.
Rad regulation of ICa,L kinetics requires SR Ca2+ release. (A) Exemplar Ca2+ currents with 10 mM BAPTA for CTRL (blue) and cRadKO (red). Traces were normalized to peak current at 0 mV. Scale bar, 100 ms. Black dots indicate r30. (B) Remaining current 30 ms after peak across voltage steps. (C) ICa,L current density 30 ms after peak. (D) Regression plot of the absolute values of current density versus r30 (CTRL: slope = −0.003, deviation from zero: P = 0.91, r2 = 0.002; cRadKO: slope = 0.03, deviation from zero: P = 0.03, r2 = 0.6; dotted lines represent 95% confidence intervals). Data in B and C are presented as mean ± SEM values. Data in B were analyzed by two-way ANOVA plus Šídák’s multiple comparisons test. Data in D were analyzed by simple linear regression. n = 4 mice, n = 8 cells for CTRL; n = 4 mice, n = 7 cells for cRadKO.
Figure 4.
Figure 4.
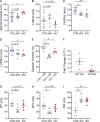
Rad deletion displays larger SR calcium content. (A) Representative transients before and after administration of 10 mM caffeine. CTRL in blue and cRadKO in red. (B) Peak twitch amplitude (**, P = 0.004). (C) Peak caffeine amplitude (*, P = 0.02). (D) Fractional amplitude between twitch and caffeine (P = 0.05). (E) Rate of decay of caffeine transient (P = 0.45). CTRL: n = 6 mice, n = 11 cells; cRadKO: n = 4 mice, n = 10 cells. Data in B–E are presented as mean ± SEM values. P values were calculated using Student’s unpaired t test for B–E.
Figure 5.
Figure 5.
The absence of Rad does not promote pathological alterations to late ICa,L kinetics. (A–C) Current measured with EGTA. (D–F) Current measured with BAPTA. (A) Remaining current 150 ms after peak across voltage steps. (B) ICa,L current density 150 ms after peak. (C) Regression plot of the absolute values of current density versus r150 (CTRL: slope = 0.04, deviation from zero: P = 0.03, r2 = 0.2; cRadKO: slope = 0.03, deviation from zero: P = 0.09, r2 = 0.2; dotted lines represent 95% confidence intervals). n = 10 mice, n = 25 cells for CTRL; n = 10 mice, n = 23 cells for cRadKO. (D) Remaining current 150 ms after peak across voltage steps. (E) ICa,L current density 150 ms after peak. (F) Regression plot of the absolute values of current density versus r150 (CTRL: slope = 0.02, deviation from zero: P = 0.54, r2 = 0.1; cRadKO: slope = 0.04, deviation from zero: P = 0.003, r2 = 0.9; dotted lines represent 95% confidence intervals). n = 4 mice, n = 8 cells for CTRL; n = 4 mice, n = 7 cells for cRadKO. Data in A, B, D, and E are presented as mean ± SEM values. Data in A and D analyzed by two-way ANOVA plus Šídák’s multiple comparisons test. For between CTRL and cRadKO: *, P = 0.03. Data in C and F were analyzed by simple linear regression.
Figure 6.
Figure 6.
Rad deletion enhances VDI. (A) Exemplar Ca2+ currents with 10 mM EGTA for CTRL (blue) and cRadKO (red). Traces were normalized to peak current at 0 mV. Scale bar, 100 ms. Black dots indicate r30. Black stars indicate r150. (B) Remaining current 30 ms after peak across voltage steps. (C) Remaining current 150 ms after peak across voltage steps. (D) ICa,L current density 30 ms after peak. (E) ICa,L current density 150 ms after peak. (F) Regression plot of the absolute values of current density versus r30 (CTRL: slope = −0.006, deviation from zero: P = 0.33, r2 = 0.2; cRadKO: slope = 0.02, deviation from zero: P = 0.10, r2 = 0.4; dotted lines represent 95% confidence intervals). (G) Regression plot of the absolute values of current density versus r150 (CTRL: slope = 0.04, deviation from zero: P = 0.73, r2 = 0.03; cRadKO: slope = 0.03, deviation from zero: P = 0.16, r2 = 0.3; dotted lines represent 95% confidence intervals). n = 3 mice, n = 7 cells for CTRL; n = 4 mice, n = 8 cells for cRadKO. Data in B–E are presented as mean ± SEM values. Data in A and D were analyzed by two-way ANOVA plus Šídák’s multiple comparisons test. Data in C and F were analyzed by simple linear regression.
Figure S3.
Figure S3.
Two-way ANOVA 95% confidence intervals and tabular results. (A) 95% confidence intervals and tabular results for Fig. 6 B. (B) 95% confidence intervals and tabular results for Fig. 6 C. (C) 95% confidence intervals and tabular results for Fig. 10 G. (D) 95% confidence intervals and tabular results for Fig. 10 H. Data are presented as mean ± 95% confidence intervals.
Figure 7.
Figure 7.
Rad deletion does not prolong APD or QT interval. (A and B) Exemplar APs (A) at baseline from CTRL (blue) and cRadKO (red) and (B) after ISO from CTRL (green) and cRadKO (black). Scale bars, 20 mV, 50 ms; arrows indicate the inflection point. (C) AP amplitude at baseline (P = 0.18). (D) APD50 at baseline (P = 0.81). (E) APD80 at baseline (*, P = 0.04). n = 2 mice, n = 9 cells for CTRL; n = 2 mice, n = 7 cells for cRadKO. (F) AP amplitude after ISO (CTRL: P = 0.10, cRadKO: P = 0.20). (G) APD50 after ISO (CTRL: P = 0.45; cRadKO: P = 0.38). (H) APD80 after ISO (CTRL: *, P = 0.05; cRadKO: P = 0.18). n = 2 mice, n = 9 cells for CTRL with ISO; n = 2 mice, n = 6 cells for cRadKO. (I) Representative raw QT interval of intrinsic heart rate from surface ECG of CTRL and cRadKO. Scale bar, 0.5 mV, 50 ms. (J) Raw QT interval (ms) is not significantly different (P = 0.35). (K) QTc (ms) is not significantly different (P = 0.41). CTRL: n = 6 mice; cRadKO: n = 7 mice. P values were calculated using Student’s unpaired t test comparing CTRL with cRadKO (C–E, F–H, and J and K) and Student’s paired t test comparing baseline with ISO (F–H). I and J were measured after administration of atropine (1 mg/kg) and propranolol (1 mg/kg). Data in C–E, J, and K are presented as mean ± SEM values.
Figure S4.
Figure S4.
Surface ECG measurements. (A) Representative raw QT interval of baseline heart rate from surface ECG of CTRL and cRadKO. Scale bar, 0.5 mV, 50 ms. (B) Raw QT interval (ms) is not significantly different (P = 0.16). (C) QTc (ms) is not significantly different (P = 0.14). (D) Baseline R-R interval (ms) is not significantly different (P = 0.97). (E) Intrinsic R-R interval (ms) is not significantly different (P = 0.48) CTRL: n = 6 mice; cRadKO: n = 7 mice. P values calculated using Student’s unpaired t test for B–E. Data in B–E are presented as mean ± SEM values.
Figure 8.
Figure 8.
Rad deletion yields modulated ICa,L in the presence of PKA inhibition. (A) Peak ICa,L measured from isolated ventricular cardiomyocytes incubated in 2 µM H89 demonstrates larger current density in cRadKO than CTRL. (B) Maximal conductance is significantly larger in cRadKO than in CTRL in the presence of H89 (*, P = 0.03). (C) Conductance transform of I-V curve normalized to maximal conductance demonstrates a negative shift in activation in cRadKO compared with CTRL. Smooth curves are Boltzmann distributions fitted to data. (D) Activation midpoint is significantly negatively shifted in cRadKO compared with CTRL in the presence of H89 (*, P = 0.04). (E) Remaining current across voltage steps 30 ms after peak. (F) Remaining current across voltage steps 150 ms after peak. CTRL: n = 3 mice, n = 7 cells; cRadKO: n = 3 mice, n = 10 cells. P values calculated using Student’s unpaired t test for C and D. Data are presented as mean ± SEM values. Data in E and F were analyzed by two-way ANOVA plus Šídák’s multiple comparisons test.
Figure S5.
Figure S5.
Two-way ANOVA 95% confidence intervals and tabular results. (A) 95% confidence intervals and tabular results for Fig. 8 E. (B) 95% confidence intervals and tabular results for Fig. 8 F.
Figure S6.
Figure S6.
Whole-heart measurements of dKO and tKO. (A) Ejection fraction (*, P = 0.03). (B) Left ventricular inner dimensions in diastole (LVID;d). (C) Left ventricular anterior wall thickness; diastole (LVAW;d; *, P = 0.01; **, P = 0.009). (D) Left ventricular posterior wall thickness; diastole (LVPW;d; *, P = 0.05). (E) Ejection fraction after acute ISO (30 mg/kg) administration. Data for CTRL + ISO taken from published dataset in Ahern et al. (2019). *, P = 0.01; ****, P < 0.0001. (F) qRT-PCR analysis of samples from dKO and tKO hearts. (G) Raw QT interval. (H) QTc qRT-PCR analysis of samples from dKO and tKO hearts. G shows raw QT interval, and H shows QTc.
Figure 9.
Figure 9.
Rad deletion increases heart function exclusive of β1β2-ARs. (A) Representative M-mode short-axis echocardiography from dKO and tKO mice. Scale bars, 1 s; 2 mm. (B) Ejection fraction (****, P < 0.0001). (C) Left ventricular inner dimensions; diastole (LVID;d; **, P = 0.003). (D and E) Left ventricular anterior wall; diastole (LVAW;d; P = 0.43; D) and left ventricular posterior wall; diastole (LVPW;d; P = 0.52; E) thickness. Dimensions in C–E were measured in diastole. dKO: n = 11 mice; tKO: n = 15 mice. (F) Representative raw QT interval from surface ECG of dKO and tKO. Scale bar, 0.5 mV, 50 ms. (G) Raw QT interval (ms) is not significantly different (P = 0.19). (H) QTc (ms) is not significantly different (P = 0.14). (I) R-R interval (ms) is not significantly different (P = 0.27). dKO: n = 6 mice; tKO: n = 8 mice. P values were calculated using Student’s unpaired t test for B–E and G–I. Data in B–E and G–I are presented as mean ± SEM values.
Figure 10.
Figure 10.
Rad deletion yields modulated ICa,L in the absence of β1β2-ARs. (A) Exemplar family of Ca2+ currents of dKO (dark blue) and tKO (dark red). Scale bar, 1 nA, 100 ms. (B) Peak ICa,L current density is larger in tKO than in dKO. (C and D) Conductance transform of I-V curve demonstrates higher maximal conductance in tKO than in dKO with quantification shown in D (****, P < 0.0001). (E) Activation midpoint is significantly negatively shifted in tKO (*, P = 0.04). (F) Exemplar Ca2+ currents with EGTA for dKO (dark blue) and tKO (dark red). Traces were normalized to peak current at 0 mV. Scale bar, 100 ms. Black dots indicate r30. Black stars indicate r150. (G and H) Remaining current across voltage steps 30 ms after peak (G) and 150 ms after peak (H). (I and J) ICa,L current density 30 ms (I) and 150 ms (J) after peak. dKO: n = 3 mice, n = 7 cells; tKO: n = 3 mice, n = 9 cells. P values were calculated using Student’s unpaired t test for D and E. Data in B–E and G–J are presented as mean ± SEM values. Data in G and H were analyzed by two-way ANOVA plus Šídák’s multiple comparisons test.
Figure 11.
Figure 11.
Rad modulates ICa,L independent of β-adrenergic signaling to confer systolic advantage. The absence of Rad results in modulated ICa,L that enhances cardiac contraction (early phase) without promoting electrical dysfunction because of accelerated decay kinetics (late phase).

References

    1. Ahern, B.M., and Satin J.. 2019. The L-type calcium channel current modulation mechanism: the plot thickens and fogs. J. Clin. Invest. 129:496–498. 10.1172/JCI125958 - DOI - PMC - PubMed
    1. Ahern, B.M., Levitan B.M., Veeranki S., Shah M., Ali N., Sebastian A., Su W., Gong M.C., Li J., Stelzer J.E., et al. . 2019. Myocardial-restricted ablation of the GTPase RAD results in a pro-adaptive heart response in mice. J. Biol. Chem. 294:10913–10927. 10.1074/jbc.RA119.008782 - DOI - PMC - PubMed
    1. Alseikhan, B.A., DeMaria C.D., Colecraft H.M., and Yue D.T.. 2002. Engineered calmodulins reveal the unexpected eminence of Ca2+ channel inactivation in controlling heart excitation. Proc. Natl. Acad. Sci. USA. 99:17185–17190. 10.1073/pnas.262372999 - DOI - PMC - PubMed
    1. Bayer, K.U., De Koninck P., Leonard A.S., Hell J.W., and Schulman H.. 2001. Interaction with the NMDA receptor locks CaMKII in an active conformation. Nature. 411:801–805. 10.1038/35081080 - DOI - PubMed
    1. Bean, B.P., Nowycky M.C., and Tsien R.W.. 1984. β-adrenergic modulation of calcium channels in frog ventricular heart cells. Nature. 307:371–375. 10.1038/307371a0 - DOI - PubMed

Publication types