. 2021 Dec;86(6):3304-3320.
doi: 10.1002/mrm.28926. Epub 2021 Jul 16.

MASiVar: Multisite, multiscanner, and multisubject acquisitions for studying variability in diffusion weighted MRI

Affiliations

MASiVar: Multisite, multiscanner, and multisubject acquisitions for studying variability in diffusion weighted MRI

Leon Y Cai et al. Magn Reson Med. 2021 Dec.

Abstract

Purpose: Diffusion-weighted imaging allows investigators to identify structural, microstructural, and connectivity-based differences between subjects, but variability due to session and scanner biases is a challenge.

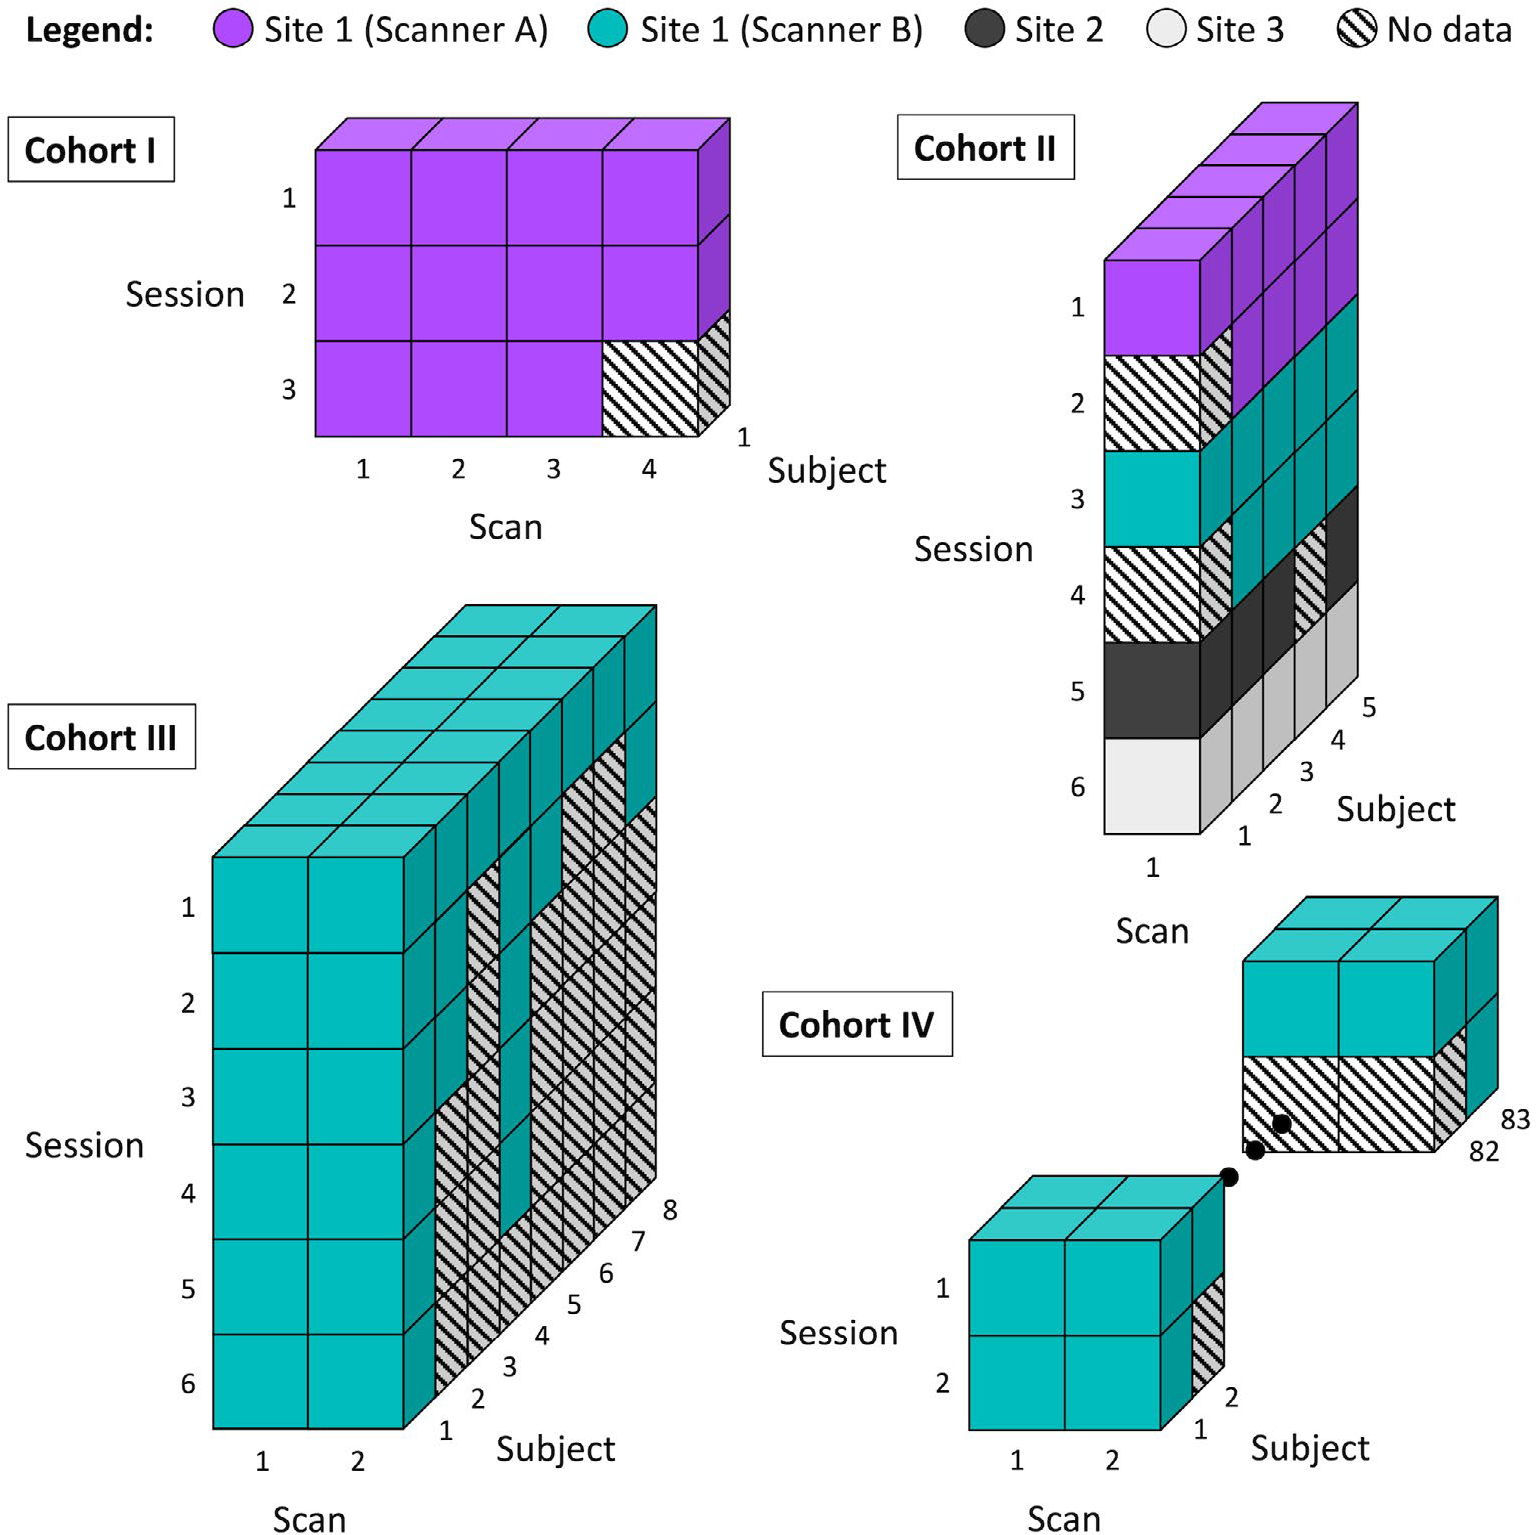
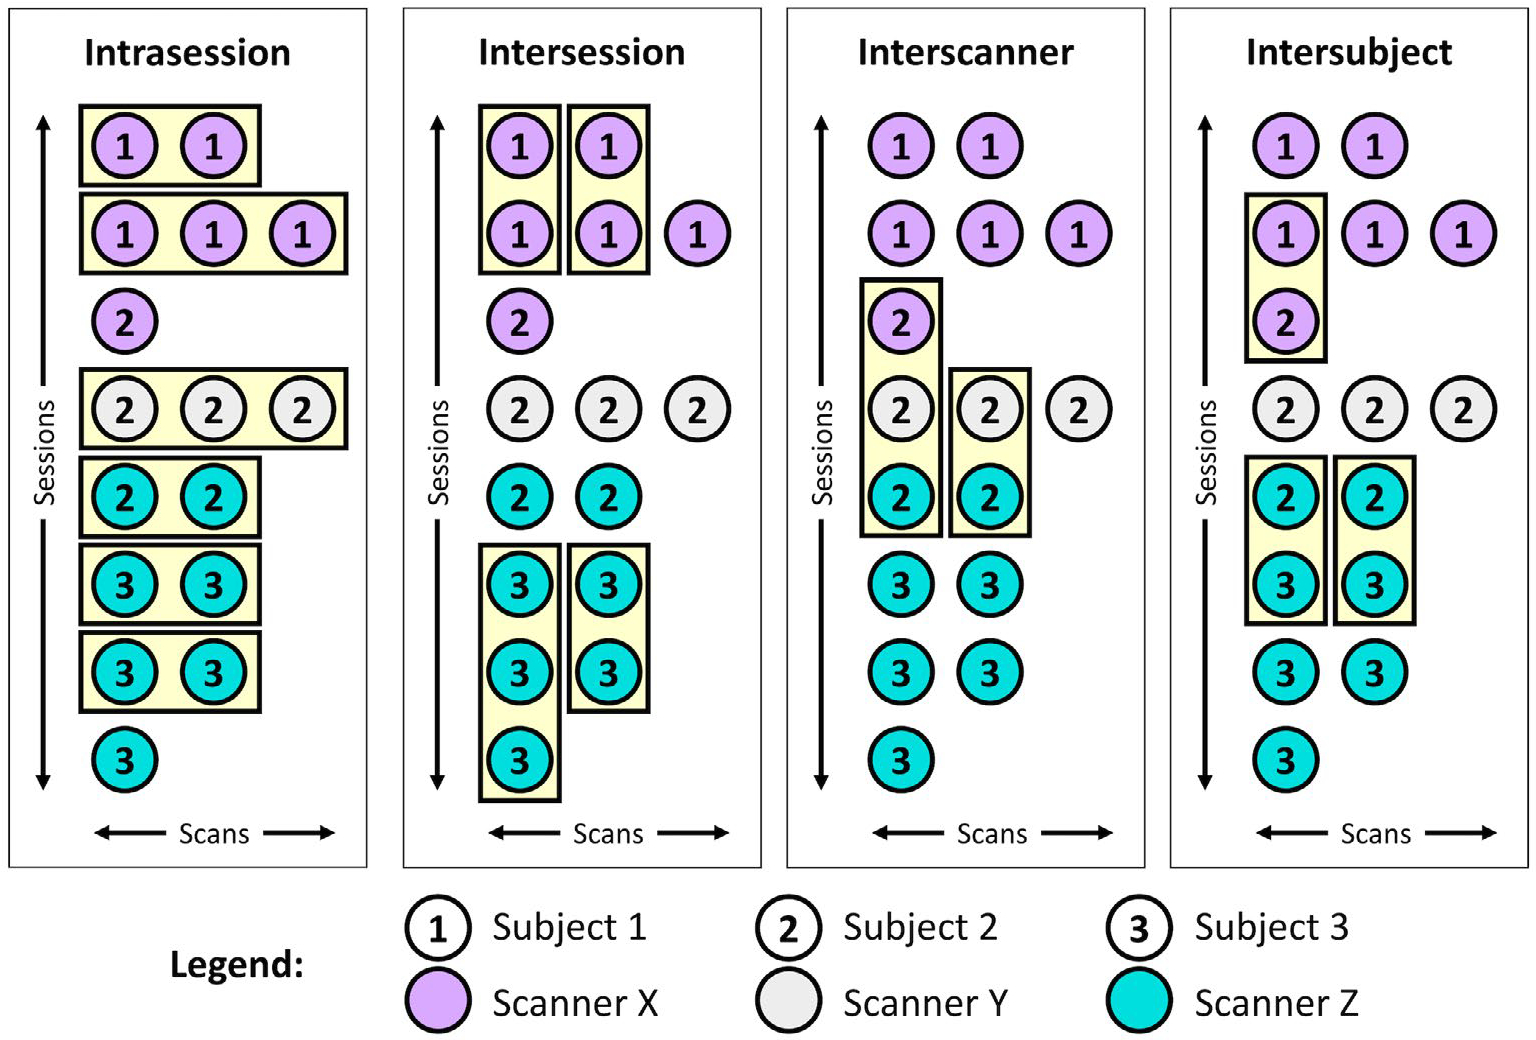
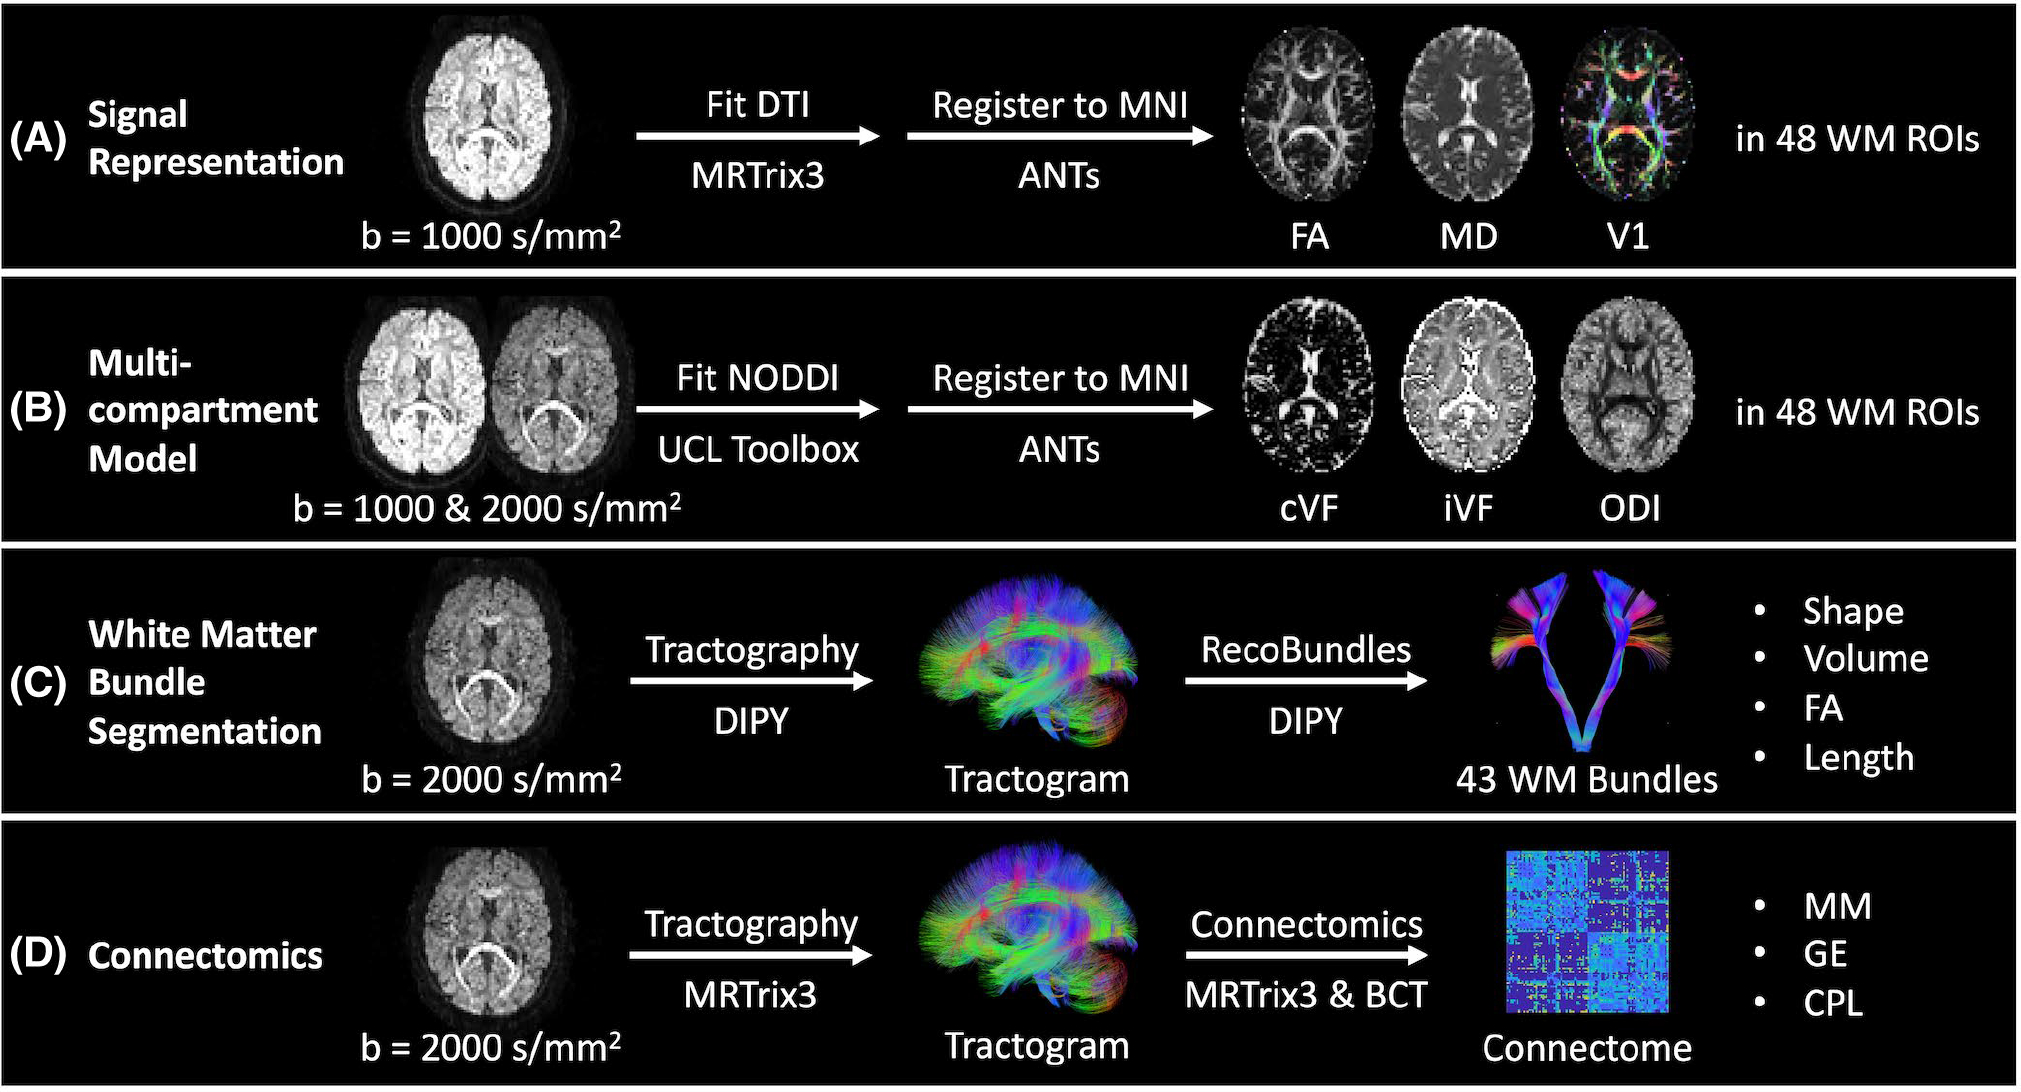
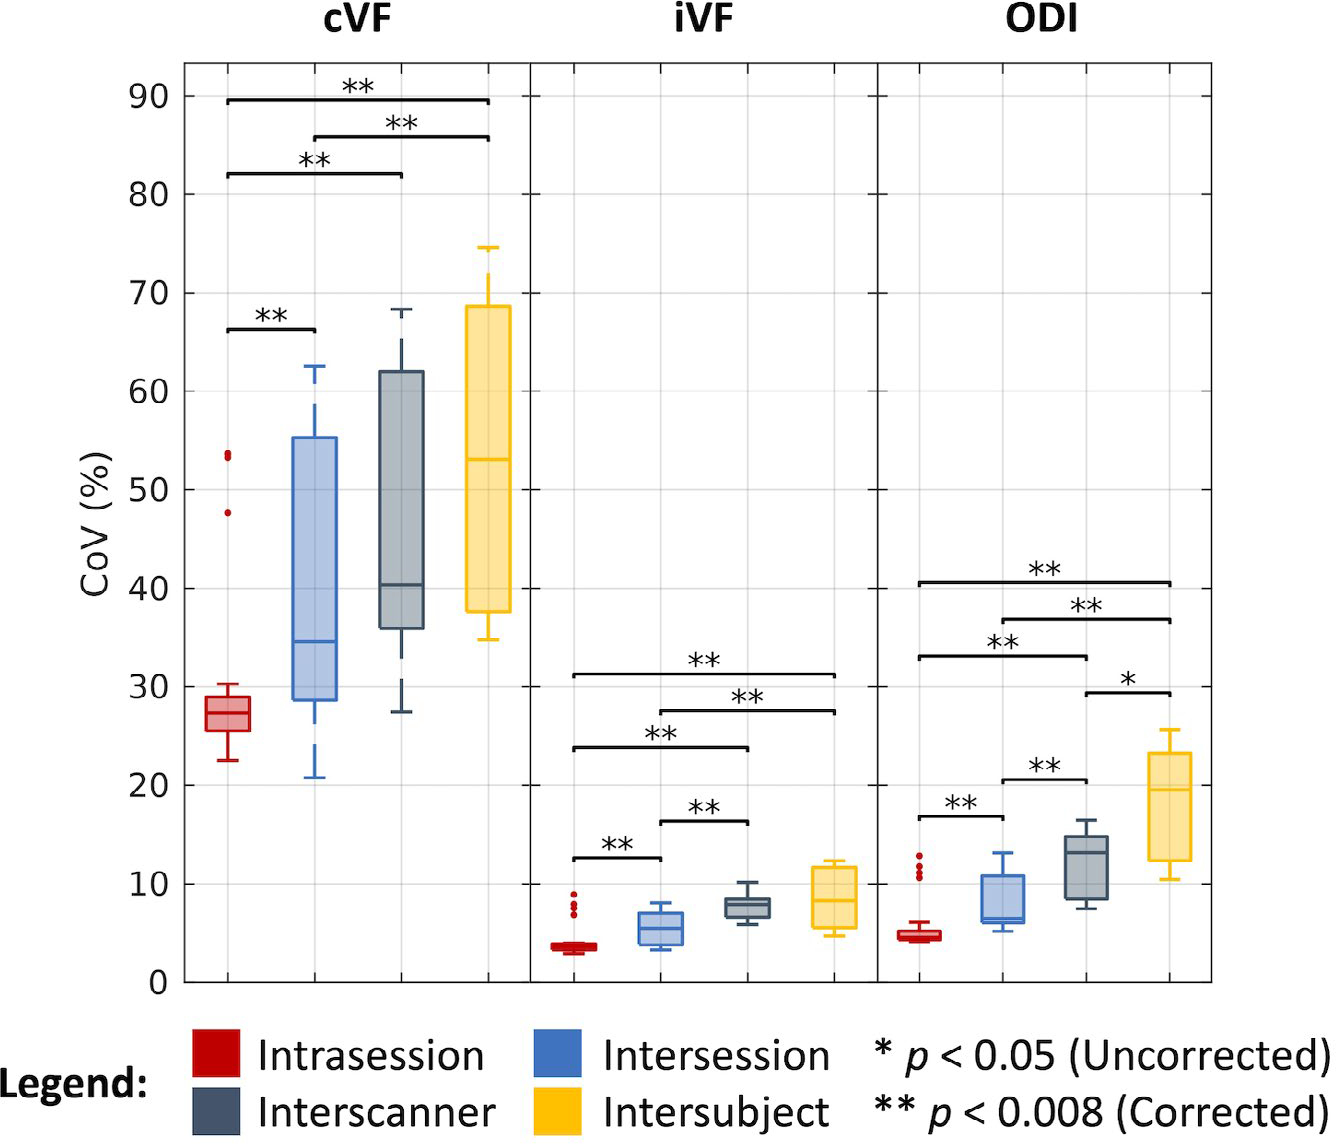
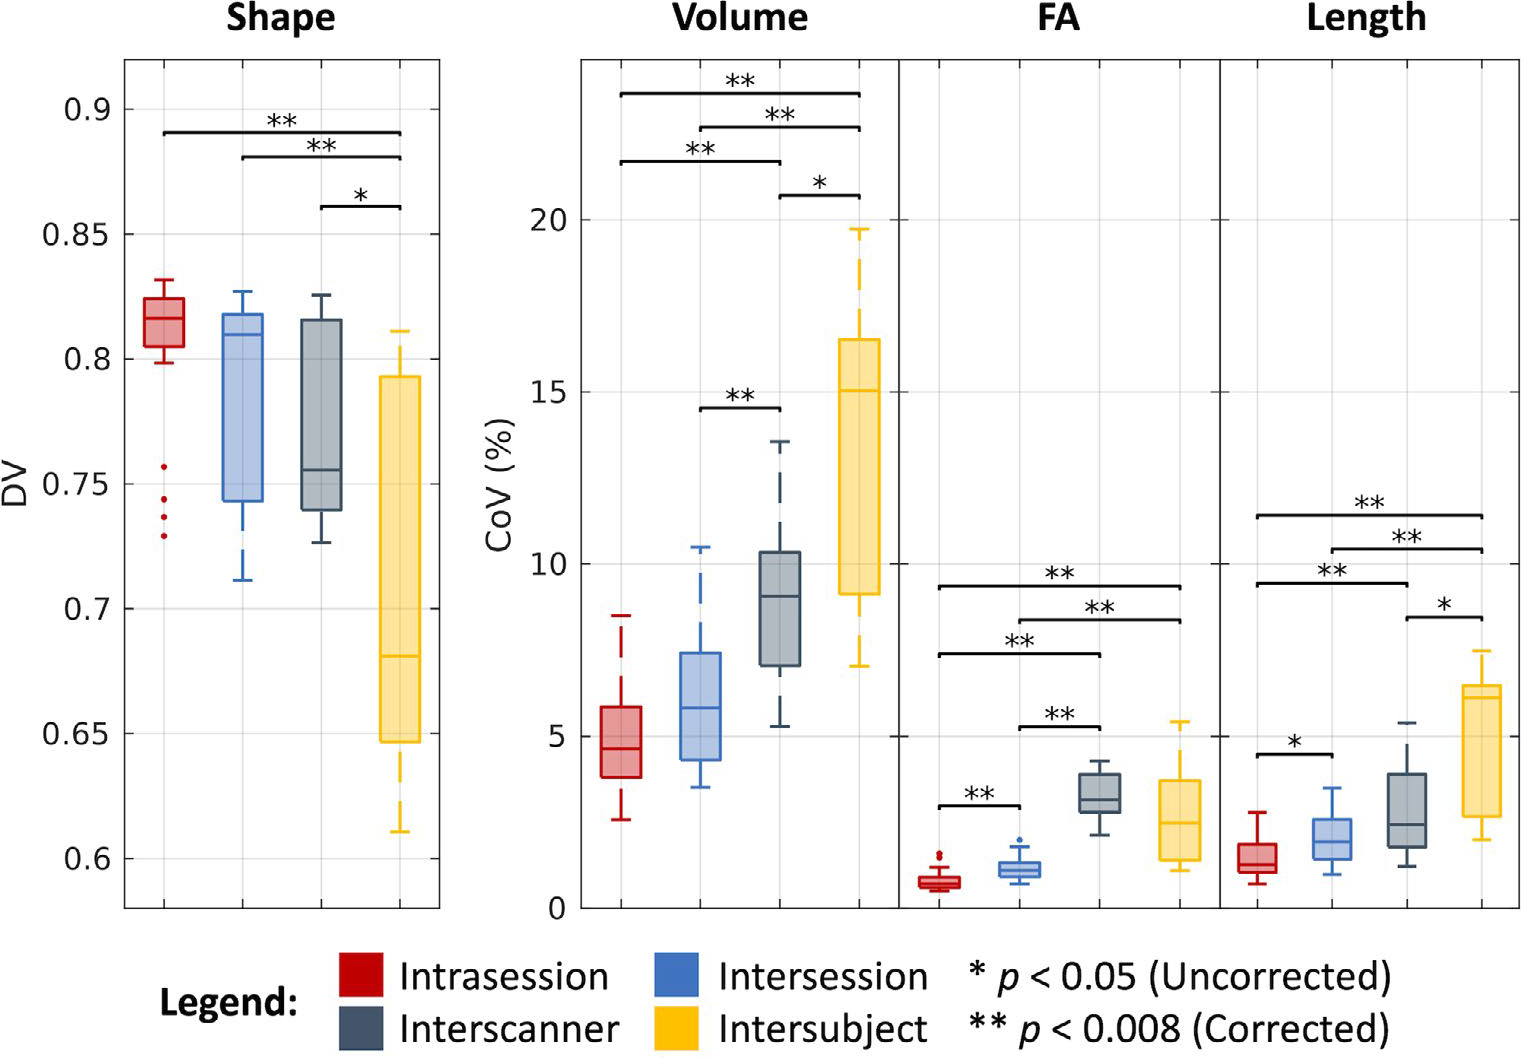
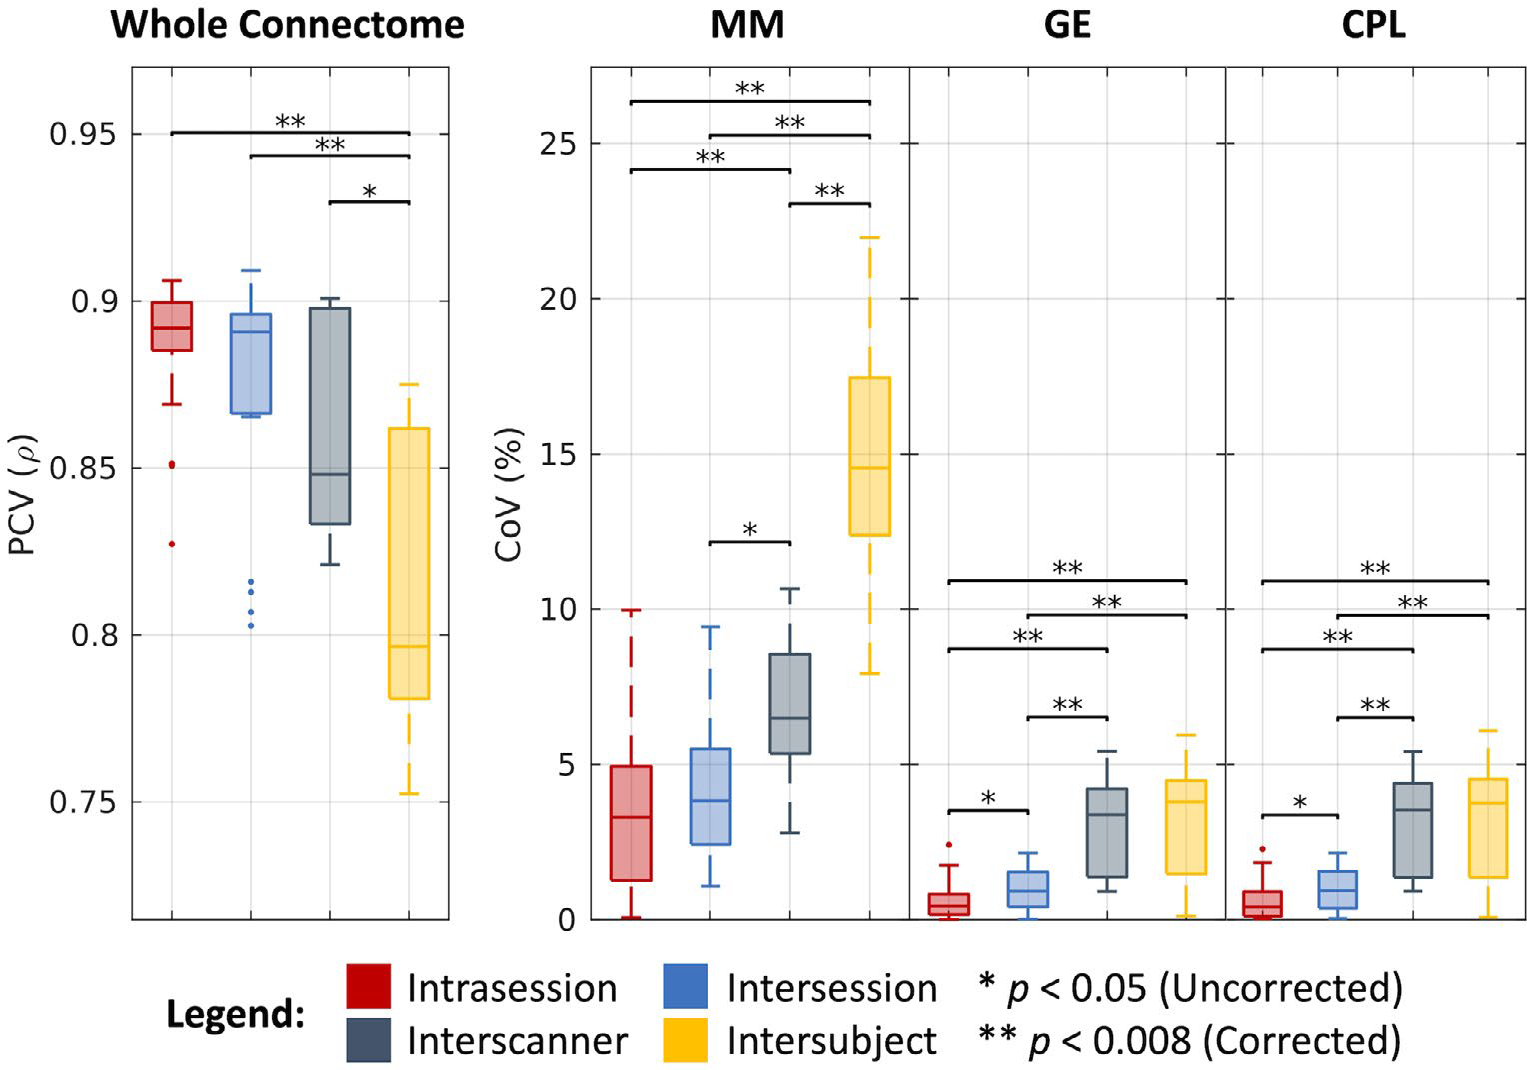
Methods: To investigate DWI variability, we present MASiVar, a multisite data set consisting of 319 diffusion scans acquired at 3 T from b = 1000 to 3000 s/mm2 across 14 healthy adults, 83 healthy children (5 to 8 years), three sites, and four scanners as a publicly available, preprocessed, and de-identified data set. With the adult data, we demonstrate the capacity of MASiVar to simultaneously quantify the intrasession, intersession, interscanner, and intersubject variability of four common DWI processing approaches: (1) a tensor signal representation, (2) a multi-compartment neurite orientation dispersion and density model, (3) white-matter bundle segmentation, and (4) structural connectomics. Respectively, we evaluate region-wise fractional anisotropy, mean diffusivity, and principal eigenvector; region-wise CSF volume fraction, intracellular volume fraction, and orientation dispersion index; bundle-wise shape, volume, fractional anisotropy, and length; and whole connectome correlation and maximized modularity, global efficiency, and characteristic path length.

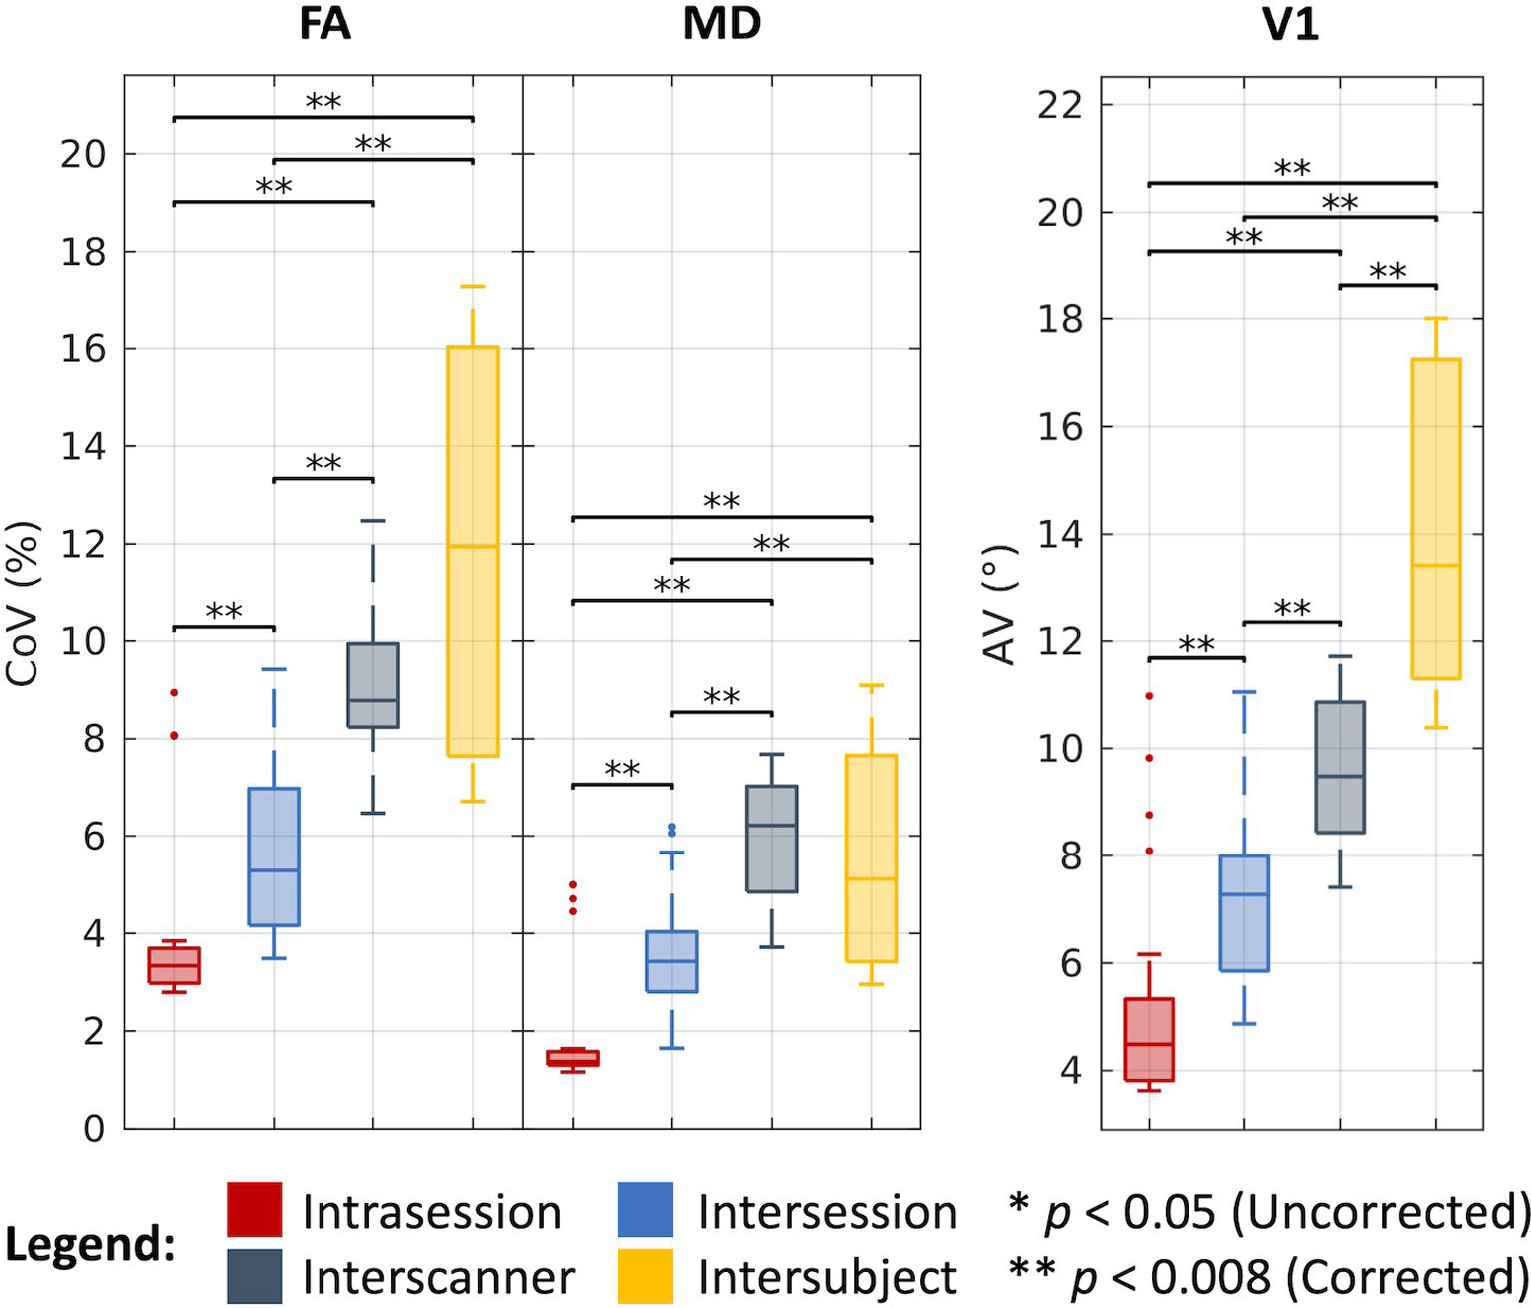
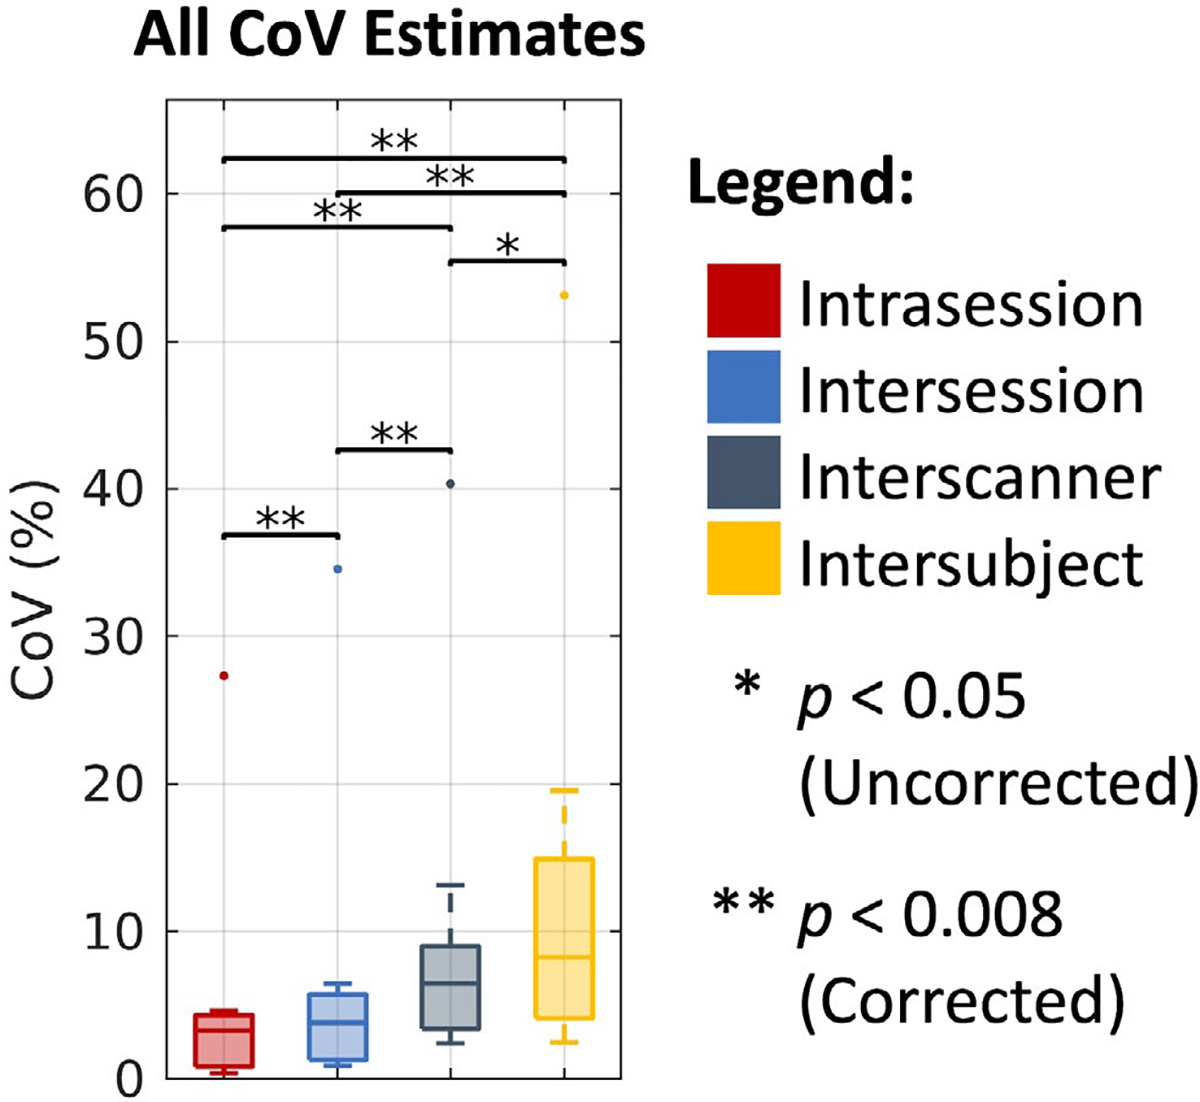
Results: We plot the variability in these measures at each level and find that it consistently increases with intrasession to intersession to interscanner to intersubject effects across all processing approaches and that sometimes interscanner variability can approach intersubject variability.

Conclusions: This study demonstrates the potential of MASiVar to more globally investigate DWI variability across multiple levels and processing approaches simultaneously and suggests harmonization between scanners for multisite analyses should be considered before inference of group differences on subjects.

Keywords: DTI; NODDI; bundle segmentation; connectome; reproducibility; variability.


Figures

FIGURE 1
FIGURE 1
Overview of the MASiVar data set. This data set consists of four cohorts. Cohort I consists of 1 adult subject scanned repeatedly on one scanner. This subject underwent three separate imaging sessions and acquired three to four scans per session. Cohort II consists of 5 adult subjects each scanned on three to four different scanners across three institutions. Each subject underwent one to two sessions on each scanner and had one scan acquired per session. Cohort III consists of 8 adult subjects, all scanned on one scanner. Each subject underwent one to six sessions on the scanner and had two scans acquired per session. Cohort IV consists of 83 child subjects, all scanned on one scanner. Each subject underwent one to two sessions on the scanner and had two scans acquired per session.
FIGURE 2
FIGURE 2
Example identification of scan groups at the four levels of variation. The MASiVar data set consists of scans across multiple sessions, scanners, and subjects that can be grouped in order to satisfy intrasession, intersession, interscanner, and intersubject criteria. The scans in each of these groups should produce the same measurements; thus, quantification of variation within groups provides an estimate of variability. For the intersession, interscanner, and intersubject groups, scans are randomly shuffled within sessions before grouping.
FIGURE 3
FIGURE 3
Outline of processing and measurements investigated presently in four common diffusion MRI analysis approaches. A,B, We quantify variability in the tensor-based fractional anisotropy (FA), mean diffusivity (MD), and principal eigenvector (V1) measurements and neurite orientation dispersion and density imaging (NODDI)-based CSF volume fraction (cVF), intracellular volume fraction (iVF), and orientation dispersion index (ODI) measurements in Montreal Neurological Institute (MNI) space in 48 Johns Hopkins white matter atlas regions. C, We quantify variability in bundle shape, volume, FA, and length for 43 white matter bundles (Supporting Information Table S1) identified with the RecoBundles segmentation method. D, We quantify variability in whole-brain structural connectomes and the maximum modularity (MM), global efficiency (GE), and characteristic path length (CPL) scalar graph measures.
FIGURE 4
FIGURE 4
Variability in DTI. Visualization of variation across intrasession, intersession, interscanner, and intersubject groups illustrates increased variability with session, scanner, and subject effects. Statistical significance was determined with the Wilcoxon rank-sum test with and without Bonferroni correction.
FIGURE 5
FIGURE 5
Variability in NODDI. Visualization of variation across intrasession, intersession, interscanner, and intersubject groups illustrates increased variability with session, scanner, and subject effects. Statistical significance was determined with the Wilcoxon rank-sum test with and without Bonferroni correction.
FIGURE 6
FIGURE 6
Variability in bundle segmentation. Visualization of variation across intrasession, intersession, interscanner, and intersubject groups illustrates increased variability with session, scanner, and subject effects. Statistical significance was determined with the Wilcoxon rank-sum test with and without Bonferroni correction.
FIGURE 7
FIGURE 7
Variability in connectomics. Visualization of variation across intrasession, intersession, interscanner, and intersubject groups illustrates increased variability with session, scanner, and subject effects. Statistical significance was determined with the Wilcoxon rank-sum test with and without Bonferroni correction.
FIGURE 8
FIGURE 8
Overall trends in coefficient of variation (CoV) across DTI, NODDI, bundle segmentation, and connectomics. Visualization of median CoV across all four processing approaches on the intrasession, intersession, interscanner, and intersubject levels illustrates consistently increased variability with session, scanner, and subject effects. Statistical significance was determined with the Wilcoxon signed-rank test with and without Bonferroni correction. The outlying points correspond to the NODDI cVF approach in white matter where absolute cVF values are expected to be low.

References

    1. O’Donnell LJ, Westin CF. An introduction to diffusion tensor image analysis. Neurosurg Clin N Am. 2011;22:185–196. - PMC - PubMed
    1. Assaf Y, Pasternak O. Diffusion tensor imaging (DTI)-based white matter mapping in brain research: a review. J Mol Neurosci. 2008;34:51–61. - PubMed
    1. Basser PJ, Mattiello J, LeBihan D. MR diffusion tensor spectroscopy and imaging. Biophys J. 1994;66:259–267. - PMC - PubMed
    1. Zhang H, Schneider T, Wheeler-Kingshott CA, Alexander DC. NODDI: practical in vivo neurite orientation dispersion and density imaging of the human brain. Neuroimage. 2012;61:1000–1016. - PubMed
    1. Stanisz GJ, Szafer A, Wright GA, Henkelman RM. An analytical model of restricted diffusion in bovine optic nerve. Magn Reson Med. 1997;37:103–111. - PubMed

Publication types