Review
. 2021 Aug;5(8):e514-e525.
doi: 10.1016/S2542-5196(21)00179-0. Epub 2021 Jul 14.

Systematic mapping of global research on climate and health: a machine learning review

Affiliations
Review

Systematic mapping of global research on climate and health: a machine learning review

Lea Berrang-Ford et al. Lancet Planet Health. 2021 Aug.

Abstract

Background: The global literature on the links between climate change and human health is large, increasing exponentially, and it is no longer feasible to collate and synthesise using traditional systematic evidence mapping approaches. We aimed to use machine learning methods to systematically synthesise an evidence base on climate change and human health.

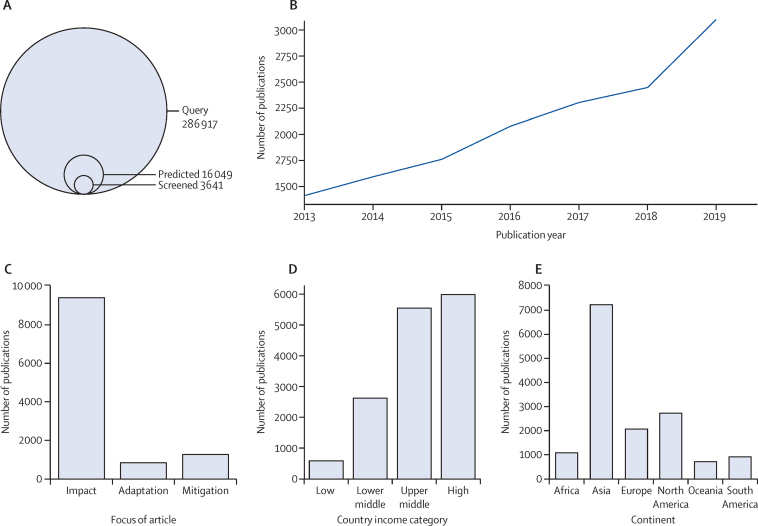
Methods: We used supervised machine learning and other natural language processing methods (topic modelling and geoparsing) to systematically identify and map the scientific literature on climate change and health published between Jan 1, 2013, and April 9, 2020. Only literature indexed in English were included. We searched Web of Science Core Collection, Scopus, and PubMed using title, abstract, and keywords only. We searched for papers including both a health component and an explicit mention of either climate change, climate variability, or climate change-relevant weather phenomena. We classified relevant publications according to the fields of climate research, climate drivers, health impact, date, and geography. We used supervised and unsupervised machine learning to identify and classify relevant articles in the field of climate and health, with outputs including evidence heat maps, geographical maps, and narrative synthesis of trends in climate health-related publications. We included empirical literature of any study design that reported on health pathways associated with climate impacts, mitigation, or adaptation.

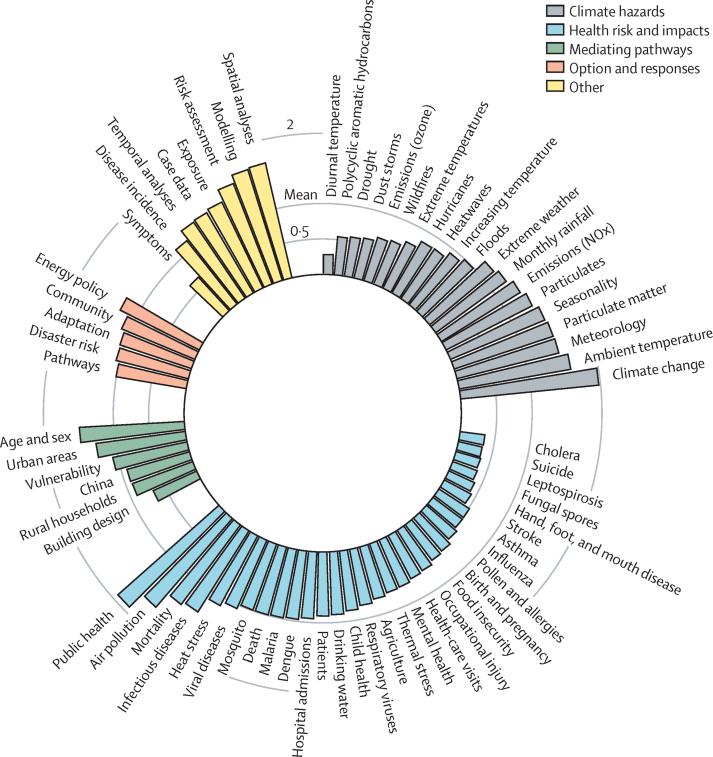
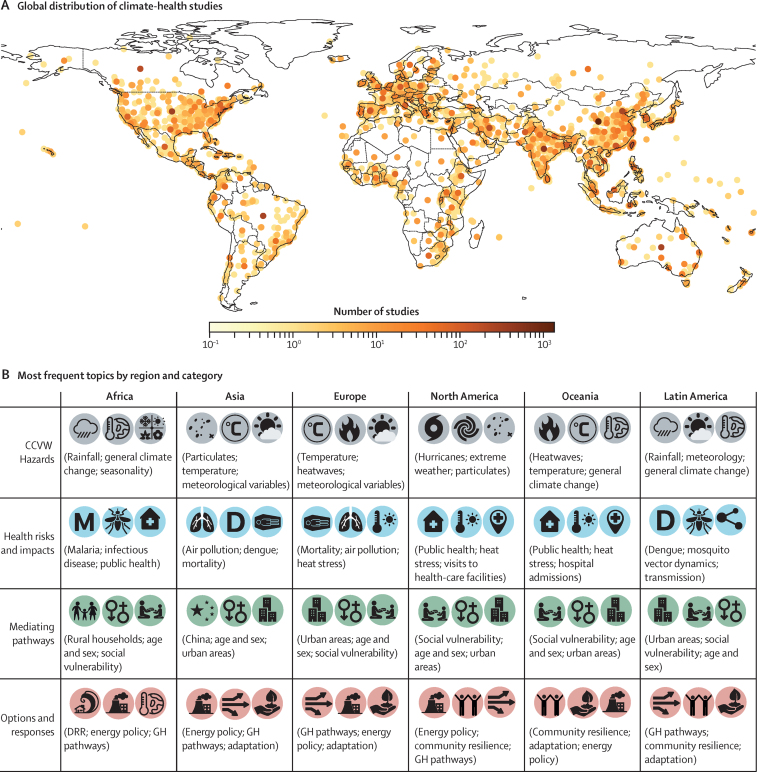
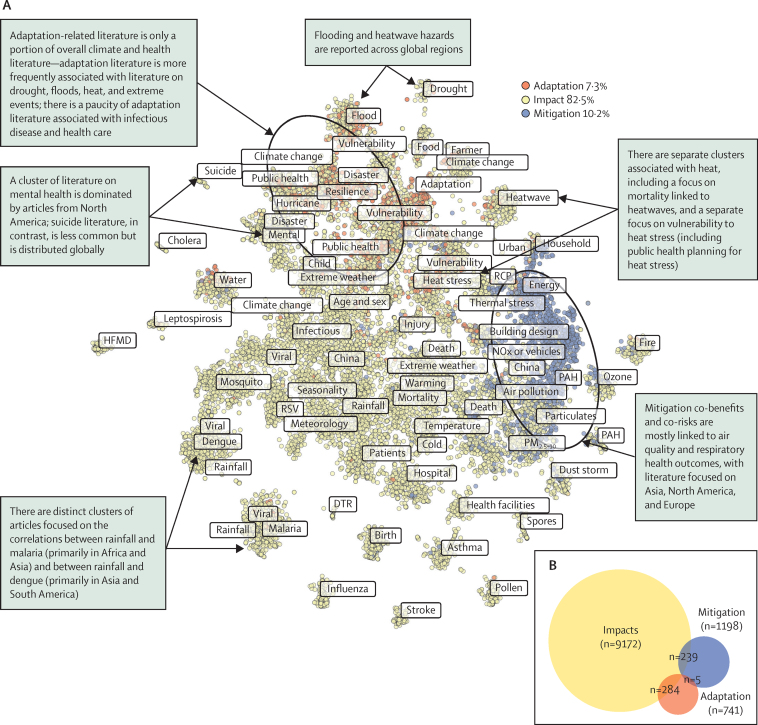
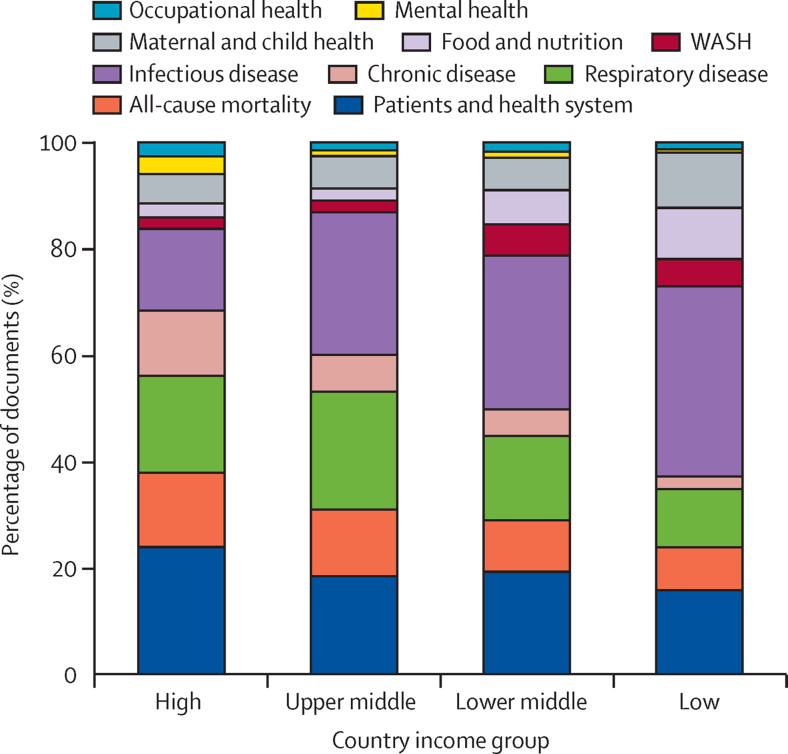
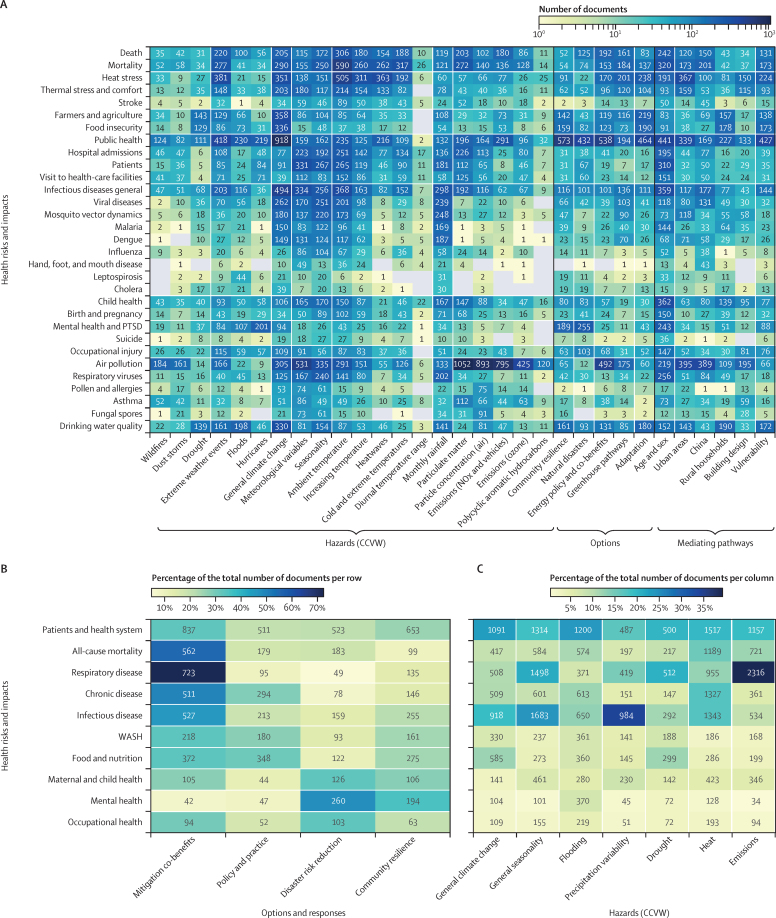
Findings: We predict that there are 15 963 studies in the field of climate and health published between 2013 and 2019. Climate health literature is dominated by impact studies, with mitigation and adaptation responses and their co-benefits and co-risks remaining niche topics. Air quality and heat stress are the most frequently studied exposures, with all-cause mortality and infectious disease incidence being the most frequently studied health outcomes. Seasonality, extreme weather events, heat, and weather variability are the most frequently studied climate-related hazards. We found major gaps in evidence on climate health research for mental health, undernutrition, and maternal and child health. Geographically, the evidence base is dominated by studies from high-income countries and China, with scant evidence from low-income counties, which often suffer most from the health consequences of climate change.

Interpretation: Our findings show the importance and feasibility of using automated machine learning to comprehensively map the science on climate change and human health in the age of big literature. These can provide key inputs into global climate and health assessments. The scant evidence on climate change response options is concerning and could significantly hamper the design of evidence-based pathways to reduce the effects on health of climate change. In the post-2015 Paris Agreement era of climate solutions, we believe much more attention should be given to climate adaptation and mitigation options and their effects on human health.

Funding: Foreign, Commonwealth & Development Office.


Conflict of interest statement

Declaration of interests We declare no competing interests.

Figures

Figure 1
Figure 1
Descriptive summary of included articles (A) Sampling frame, indicating the number of articles that were manually screened by investigators and those that were predicted to be relevant (final dataset for inclusion), compared with the initial number of documents retrieved from search string queries. (B) For relevant abstracts, trends in publications over time indicate a continued increase in the volume of literature on climate and health. Literature published between Jan 1, 2013, and April 9, 2020, were included. Bar graphs show the number of publications by impact, adaptation, and mitigation categories (C), national income category as per World Bank classifications (D), and global regions (E).
Figure 2
Figure 2
Prevalence of topics within included articles, organised by meta-topic The axis is a normalised scale that reflects topic prevalence relative to the mean score (reference=1). For example, a bar with a value on the axis of 2 would mean that topic is twice as prevalent as the mean of all topics. A bar with a value of 0·5 would be a topic that occurs half as often as the mean. Topics are identified based on words used in article titles, keywords, and abstracts, and can thus reflect several meanings. Community, for example, includes articles related to community resilience, community perceptions, community-level studies, and community participation. Viewing the detailed words within this topic (appendix 1 p 7) shows that much of the literature driving this topic is associated with community and resilience as dominant co-occurring words.
Figure 3
Figure 3
Geographical distribution of included studies where location information was available (A) and most frequent topics by region and category (B) Legend in map shows total number of articles. For studies conducted at the national level, points appear in the geographic centre of the region or country. CCVW=climate change, climate variability, and weather. DRR=disaster risk reduction. GH=greenhouse.
Figure 4
Figure 4
Visualisation of topics and climate research categories in the dataset (A) Topic map in which each dot represents a document, coloured according to the categories of impact, adaptation, or mitigation. There are no axes per se; the graphic reflects a conceptual space where similar documents are placed closer together, and dissimilar documents are farther apart. Clusters of dots represent areas of literature that have similar topic scores, meaning that they use similar words and are presumed to be about related subjects. Labels show the most frequent topics. Arrow boxes show illustrative trends emerging from the map. (B) Summary of the number of documents in each category, and the number of documents that span multiple categories. Numbers are based on machine learning predictions (ie, assigned a score of >0·5 by the classifier). DTR=diurnal temperature range. HFMD=hand, foot, and mouth disease. PAH=polycyclic aromatic hydrocarbons. PM=particulate matter. RCP=representative concentration pathways. RSV=respiratory syncytial virus. In the case of adaptation and to some extent mitigation, these are likely underestimates. Up to 36% of adaptation abstracts and 18% of mitigation abstracts might be misclassified as impacts articles, based on 10 k-fold cross-validation. Even when accounting for this, only a minority of articles focus on adaptation or mitigation compared with impacts, and only five articles focus on both mitigation and adaptation.
Figure 5
Figure 5
Frequency of health risk and impact topics for countries in different income classes Data are from documents on health impacts per country income group, subdivided by aggregated topic as a percentage of the group total. WASH=water, sanitation, and hygiene.
Figure 6
Figure 6
Heat maps showing the co-occurrence of documents by individual topics (A) and aggregated categories (B, C) (A) Detailed co-occurrence of topics by health risks and impacts versus hazards, options and responses, and mediating pathways. Aggregated health categories versus options and responses (B) and aggregated hazard categories (C). All heat maps give the number of documents classified by the topic model as including both topics within the same document. A document is counted when the topic score is above 0·015. Colour scale set by the percentage of the total number of documents per row for (B) and by the column total for (C). CCVW=climate change, climate variability, and weather. PTSD=post-traumatic stress disorder. WASH=water, sanitation, and hygiene.

References

    1. Minx JC, Callaghan M, Lamb WF, Garard J, Edenhofer O. Learning about climate change solutions in the IPCC and beyond. Environ Sci Policy. 2017;77:252–259.
    1. Sheridan SC, Allen MJ. Temporal trends in human vulnerability to excessive heat. Environ Res Lett. 2018;13
    1. Gautier D, Denis D, Locatelli B. Impacts of drought and responses of rural populations in West Africa: a systematic review. Wiley Interdiscip Rev Clim Change. 2016;7:666–681.
    1. Jolly WM, Cochrane MA, Freeborn PH. Climate-induced variations in global wildfire danger from 1979 to 2013. Nat Commun. 2015;6 - PMC - PubMed
    1. Phalkey RK, Aranda-Jan C, Marx S, Höfle B, Sauerborn R. Systematic review of current efforts to quantify the impacts of climate change on undernutrition. Proc Natl Acad Sci USA. 2015;112:E4522–E4529. - PMC - PubMed

Publication types