Review
. 2021 Sep 15;109(18):2820-2846.
doi: 10.1016/j.neuron.2021.06.016. Epub 2021 Jul 15.

Neurodevelopment of the association cortices: Patterns, mechanisms, and implications for psychopathology

Affiliations
Review

Neurodevelopment of the association cortices: Patterns, mechanisms, and implications for psychopathology

Valerie J Sydnor et al. Neuron. .

Abstract

The human brain undergoes a prolonged period of cortical development that spans multiple decades. During childhood and adolescence, cortical development progresses from lower-order, primary and unimodal cortices with sensory and motor functions to higher-order, transmodal association cortices subserving executive, socioemotional, and mentalizing functions. The spatiotemporal patterning of cortical maturation thus proceeds in a hierarchical manner, conforming to an evolutionarily rooted, sensorimotor-to-association axis of cortical organization. This developmental program has been characterized by data derived from multimodal human neuroimaging and is linked to the hierarchical unfolding of plasticity-related neurobiological events. Critically, this developmental program serves to enhance feature variation between lower-order and higher-order regions, thus endowing the brain's association cortices with unique functional properties. However, accumulating evidence suggests that protracted plasticity within late-maturing association cortices, which represents a defining feature of the human developmental program, also confers risk for diverse developmental psychopathologies.

Keywords: MRI; adolescence; association cortex; axis; evolution; gradient; microscale; neurodevelopment; neuroimaging; psychopathology.


Conflict of interest statement

Declaration of interests The authors declare no competing interests.

Figures

Figure 1.
Figure 1.. Anatomical, functional, and evolutionary cortical hierarchies
Anatomical hierarchy: the human cortical anatomical hierarchy is revealed by inter-regional variation in the neuroimaging-derived T1-weighted-to-T2-weighted (T1w/T2w) ratio. The T1w/T2w ratio strongly negatively correlates with hierarchy level as estimated from the laminar origins of tract-traced cortical connections in the macaque, validating it as a robust in vivo measure of anatomical hierarchy. Lower hierarchical ranking, pale yellow; higher hierarchical ranking, dark purple. rs, Spearman’s rank correlation coefficient. Functional hierarchy: the spatial embedding of the human cortical functional hierarchy—which captures a spectrum of faculties ranging from motor and visual functions to executive, emotional, and social functions—depicted across the cortical mantle. A NeuroSynth-based meta-analysis of 24 terms was conducted to map functions to cortical regions that are ranked along the hierarchy. Lower hierarchical ranking, dark blue; higher hierarchical ranking, dark red. Evolutionary hierarchy: quantification of vertex-wise macaque to human surface area expansion captures the human cortical evolutionary hierarchy. Regions low in this hierarchy are predominantly sensory and motor cortices that are cortically dominant in mammals lower in the evolutionary tree and that have expanded less in primate evolution. Regions high in this hierarchy are transmodal association cortices that are cortically dominant in the primate lineage and that underwent marked cortical expansion in humans. Lower hierarchical ranking, blue; higher hierarchical ranking, red. Anatomical hierarchy adapted from Burt et al. (2018), copyright 2018 with permission from Springer Nature, Nature Neuroscience. Functional hierarchy adapted with permission from Margulies et al. (2016), copyright 2016 via the PNAS License to Publish. Evolutionary hierarchy reprinted from Xu et al. (2020) with permission(https://creativecommons.org/licenses/by-nc-nd/4.0/) (top) and adapted from Krubitzer (2007), copyright 2007 and Krubitzer and Kahn (2003), copyright 2003 with permission from Elsevier (bottom).
Figure 2.
Figure 2.. The sensorimotor-association axis of cortical organization
Diverse neurobiological properties reveal a principal sensorimotor-association (S-A) axis of topographical feature variation and organization. Cortical measures derived from ten different data types were independently averaged within 180 left hemisphere parcels (Glasser et al., 2016), and parcels were rank-ordered on the basis of value from 1 (low rank; yellow; sensorimotor-like) to 180 (high rank; purple; association-like). (A) Individual parcel rankings from the ten cortical maps displayed in (B) were averaged to derive an archetypal S-A axis. (B) Cortical maps for ten fundamental brain features are colored by parcel rankings. These macrostructural, microstructural, functional, metabolic, transcriptomic, and evolutionary features exhibit systematic variation between lower order primary sensorimotor regions and higher order transmodal association regions along the S-A cortical axis. Cortical maps (and data sources) displayed include anatomical hierarchy (AH), quantified by the T1-weighted-to-T2-weighted ratio (data from Glasser and Van Essen, 2011); functional hierarchy (FH), quantified by the principal gradient of functional connectivity (data from Margulies et al., 2016); evolutionary hierarchy (EH), quantified by macaque-to-human cortical expansion (data from Hill et al., 2010a); allometric scaling (AS), quantified as the relative extent of areal scaling with scaling of overall brain size (data from Reardon et al., 2018); aerobic glycolysis (AG), quantified from positron emission tomography measures of oxygen consumption and glucose use (data from Vaishnavi et al., 2010); cerebral blood flow (CB); quantified via arterial spin labeling (data from Satterthwaite et al., 2014); gene expression (GE), quantified by the first principal component of brain-expressed genes (analysis conducted as in Burt et al., 2018); NeuroSynth (NS), quantified by the first principal component of NeuroSynth meta-analytic decodings (Yarkoni et al., 2011); externopyramidization (EX), quantified as the ratio of supragranular pyramidal neuron soma size to infragranular pyramidal neuron soma size (data from Paquola et al., 2020a); and cortical thickness (CT), quantified from structural MRI (Human Connectome Project S1200 data). (C) A Spearman’s rank (rs) correlation matrix for the ten cortical features. Correlation significance (pspin) was assessed using a conservative parcel-based spatial permutation spin test that preserves spatial covariance structure, as implemented by Váša et al. (2018). (D) The archetypical S-A axis shown in (A) captures divergence between sensorimotor and association cortices across all ten cortical features, as revealed by average sensorimotor tertile versus association tertile feature Z scores. Sensorimotor and association tertiles include 60 cortical parcels with the lowest and the highest average ranks, respectively, on the basis of the multimodal map computed in (A).
Figure 3.
Figure 3.. Hierarchical neurodevelopment in youth
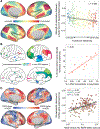
(A–E) The magnitude and timing of development-related changes varies across the cortical mantle during childhood and adolescence and is linked to anatomical, functional, and evolutionary hierarchies. Consequently, compared with primary and unimodal visual, auditory, somatosensory, and motor cortices, transmodal association cortices tend to exhibit greater total surface area expansion (A), enhanced adolescent cortical thinning (B), a later age of peak intracortical myelin growth (C), temporally delayed functional system maturation (D), and a larger increase in structure-function coupling (E), with continuous variation being evident along the S-A axis. VIS, visual; SM, somatomotor; FP, frontoparietal; DA, dorsal attention; VA, ventral attention; LIM, limbic; DM, default mode; r, Pearson’s correlation coefficient. (A) Adapted with permission from Hill et al. (2010a), copyright 2010 via the PNAS License to Publish. (B and E) Adapted from Ball et al. (2020b) and Baum et al. (2020), copyright 2020 with permission(https://creativecommons.org/licenses/by-nc-nd/4.0/). (C) Adapted from Grydeland et al. (2019), copyright 2019 with permission(https://creativecommons.org/licenses/by/4.0/). (D) Adapted from Dong et al. (2020), copyright 2020 with permission(https://creativecommons.org/licenses/by-nc/4.0/).
Figure 4.
Figure 4.. Multi-scale temporal neurodevelopment in sensorimotor and association cortex
The time course and tempo of major developmental changes in sensorimotor cortex (SM; yellow) and association cortex (ASSOC; purple) are illustrated; darker shading indicates larger magnitude changes. This qualitative synthesis of the reviewed literature underscores how the temporal neurodevelopmental axis indexes heterochronous changes between lower order versus high-order cortical regions. This synthesis further reveals prolonged association cortex neurodevelopment marked by substantial changes in late childhood and adolescence. Convergent data arise from neuroimaging-derived measures and plasticity-related cellular changes. E, early; M, middle; L, late; PV, parvalbumin.
Figure 5.
Figure 5.. Excitatory and inhibitory feature variability produces a gradient of information processing timescales
(A) Results from an anatomically informed computational model of the macaque cortex support a link between longer intrinsic timescales and stronger local and long-range excitatory inputs. Each bar represents a cortical region that was modeled. The strength of local and long-range excitatory inputs varied by region (excitatory strength increasing from purple to red) and was informed by pyramidal neuron dendritic spine count data and tract tracing data. The cortical regions modeled include (from purple to red) V1, V4, 8m, 8I, TEO, 2, 7A, 10, 9/46v, 9/46d, TEpd, 7m, 7B, 24c. Adapted from Chaudhuri et al. (2015), copyright 2015 with permission from Elsevier. (B and C) The integration of human electrocorticography recordings and post-mortem human brain gene expression data uncovers an association between longer intrinsic timescales and both higher expression of the excitatory NMDA receptor subunit NR2B (B) and lower expression of parvalbumin inhibitory interneurons (C). Adapted from Gao et al. (2020) copyright 2020 with permission(https://creativecommons.org/licenses/by/4.0/). (D) Patterned variability in these excitatory and inhibitory features along the S-A axis facilitates a hierarchical gradient of intrinsic timescales characterized by transient responding in early sensory and motor cortices and sustained responding in transmodal association cortices. Adapted with permission from Raut et al. (2020) copyright 2020 via the PNAS License to Publish.
Figure 6.
Figure 6.. Inter-individual variability in functional and structural properties across the cortical mantle
Inter-individual variability in functional system topography, cortico-cortical functional connectivity architecture, proportional surface area, and sulcal depth varies by the S-A organizational axis and is generally highest in transmodal heteromodal association regions. Functional system topography adapted from Cui et al. (2020), copyright 2020 with permission from Elsevier. Corticocortical connectivity and sulcal depth adapted from Mueller et al. (2013), copyright 2013 with permission from Elsevier. Proportional surface area data from Reardon et al. (2018).
Figure 7.
Figure 7.. Psychopathology-linked cortical phenotypes and potential cellular correlates
(A) The strength of the association between more severe generalized psychopathology (p-factor) and reduced cortical thickness (CT) increases along the cortical functional hierarchy, with stronger effects in transmodal (orange/red) than in unimodal (blue/green) cortices. (B) Cortical regions that exhibit larger alterations in macroscale structural connectivity in individuals with psychosis (in vivo diffusion-weighted imaging [DWI] data) additionally display greater reductions in neuron spine density in psychotic individuals (post-mortem data). (C) The across-cortex pattern of resting state functional amplitude (RSFA) differences between individuals with a history of major depressive disorder (MDD) and healthy controls (HC) (indexed by Cohen’s d) corresponds to the spatial distribution of three somatostatin inhibitory interneuron markers, somatostatin (SST), cortistatin (CORT), and neuropeptide Y (NPY). rs, Spearman’s rank correlation coefficient; r, Pearson’s correlation coefficient. (A) adapted from Romer et al. (2021) with permission from the American Journal of Psychiatry, (copyright 2021). American Psychiatric Association. All rights reserved. (B) adapted from van den Heuvel et al. (2016a) copyright 2016 with permission from Elsevier. (C) Adapted from Anderson et al. (2020b) copyright 2020 with permission(https://creativecommons.org/licenses/by-nc-nd/4.0/).

References

    1. Aflalo TN, and Graziano MS (2011). Organization of the macaque extrastriate visual cortex re-examined using the principle of spatial continuity of function. J. Neurophysiol 105, 305–320. - PMC - PubMed
    1. Alexander-Bloch AF, Raznahan A, Vandekar SN, Seidlitz J, Lu Z, Mathias SR, Knowles E, Mollon J, Rodrigue A, Curran JE, et al. (2020). Imaging local genetic influences on cortical folding. Proc. Natl. Acad. Sci. U S A 117, 7430–7436. - PMC - PubMed
    1. Alnæs D, Kaufmann T, Doan NT, Córdova-Palomera A, Wang Y, Bettella F, Moberget T, Andreassen OA, and Westlye LT (2018). Association of heritable cognitive ability and psychopathology with white matter properties in children and adolescents. JAMA Psychiatry 75, 287–295. - PMC - PubMed
    1. Alnæs D, Kaufmann T, Marquand AF, Smith SM, and Westlye LT (2020). Patterns of sociocognitive stratification and perinatal risk in the child brain. Proc. Natl. Acad. Sci. U S A 117, 12419–12427. - PMC - PubMed
    1. Amlien IK, Fjell AM, Tamnes CK, Grydeland H, Krogsrud SK, Chaplin TA, Rosa MGP, and Walhovd KB (2016). Organizing principles of human cortical development—thickness and area from 4 to 30 years: insights from comparative primate neuroanatomy. Cereb. Cortex 26, 257–267. - PubMed

Publication types

MeSH terms