

Prediction of combination therapies based on topological modeling of the immune signaling network in multiple sclerosis
- PMID: 34271980
- PMCID: PMC8284018
- DOI: 10.1186/s13073-021-00925-8
Prediction of combination therapies based on topological modeling of the immune signaling network in multiple sclerosis
Abstract
Background: Multiple sclerosis (MS) is a major health problem, leading to a significant disability and patient suffering. Although chronic activation of the immune system is a hallmark of the disease, its pathogenesis is poorly understood, while current treatments only ameliorate the disease and may produce severe side effects.
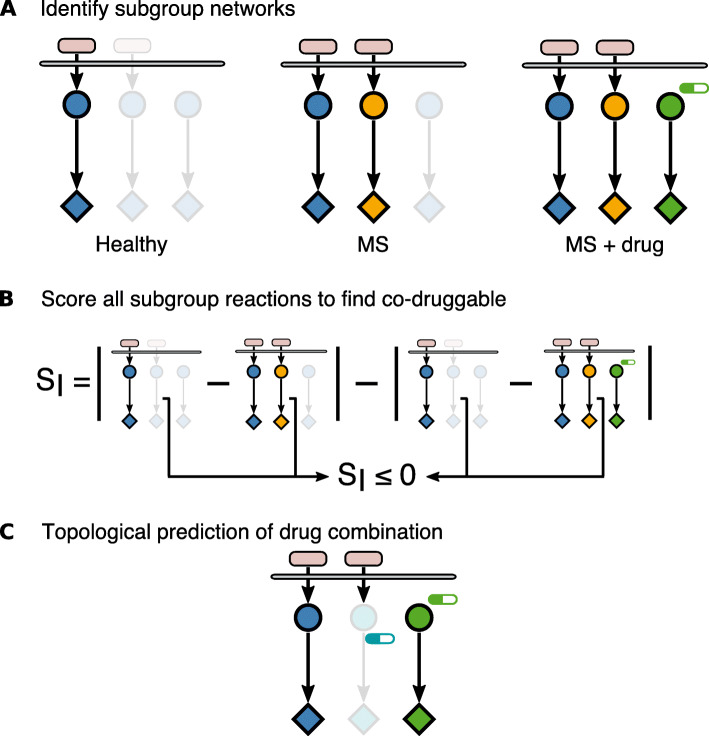
Methods: Here, we applied a network-based modeling approach based on phosphoproteomic data to uncover the differential activation in signaling wiring between healthy donors, untreated patients, and those under different treatments. Based in the patient-specific networks, we aimed to create a new approach to identify drug combinations that revert signaling to a healthy-like state. We performed ex vivo multiplexed phosphoproteomic assays upon perturbations with multiple drugs and ligands in primary immune cells from 169 subjects (MS patients, n=129 and matched healthy controls, n=40). Patients were either untreated or treated with fingolimod, natalizumab, interferon-β, glatiramer acetate, or the experimental therapy epigallocatechin gallate (EGCG). We generated for each donor a dynamic logic model by fitting a bespoke literature-derived network of MS-related pathways to the perturbation data. Last, we developed an approach based on network topology to identify deregulated interactions whose activity could be reverted to a "healthy-like" status by combination therapy. The experimental autoimmune encephalomyelitis (EAE) mouse model of MS was used to validate the prediction of combination therapies.
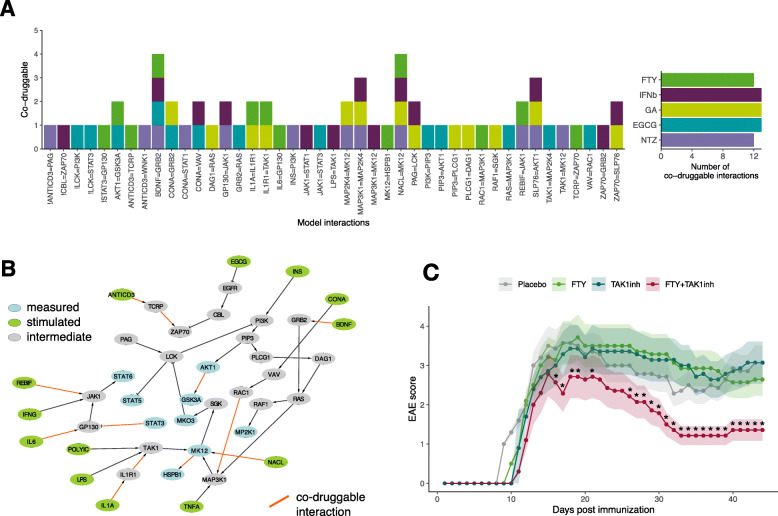
Results: Analysis of the models uncovered features of healthy-, disease-, and drug-specific signaling networks. We predicted several combinations with approved MS drugs that could revert signaling to a healthy-like state. Specifically, TGF-β activated kinase 1 (TAK1) kinase, involved in Transforming growth factor β-1 proprotein (TGF-β), Toll-like receptor, B cell receptor, and response to inflammation pathways, was found to be highly deregulated and co-druggable with all MS drugs studied. One of these predicted combinations, fingolimod with a TAK1 inhibitor, was validated in an animal model of MS.
Conclusions: Our approach based on donor-specific signaling networks enables prediction of targets for combination therapy for MS and other complex diseases.
Keywords: Combination therapy; Immunotherapy; Kinases; Logic modeling; Multiple sclerosis; Network modeling; Pathways; Personalized medicine; Phosphoproteomics; Signaling networks; Treatment; xMAP assay.
© 2021. The Author(s).
Conflict of interest statement
DEM is an employee of ProtATonce; TO has received honoraria for lectures and/or advisory boards as well as unrestricted multiple sclerosis research grants from Allmiral, Astrazeneca, Biogen, Genzyme, Merck, and Novartis; RM reports grants and personal compensation from Biogen, personal fees from Genzyme Sanofi Aventis, grants and personal fees from Novartis, and personal fees from Merck Serono, Roche, Neuway, and CellProtect, outside the submitted work; FP has received research grants and personal compensation for activities with Alexion, Bayer, Chugai, Novartis, Merck, Teva, Sanofi, Genzyme, Biogen, and MedImmune; LGA is the founder and hold stocks at ProtATonce; PV holds stocks and has received consultancy fees from Bionure Farma SL, Spiral Therapeutics Inc., Spire Bioventures Inc., Attune Neurosciences Inc., QMenta Inc., and Health Engineering SL; JSR declares funding from GSK and Sanofi and consultant fees from Travere Therapeutics. The other authors declare that they have no competing interests.
Figures
References
-
- Owens J. Determining druggability. Nat Rev Drug Discov. 2007;6(3):187. doi: 10.1038/nrd2275. - DOI
-
- Klinger B, Sieber A, Fritsche-Guenther R, Witzel F, Berry L, Schumacher D, Yan Y, Durek P, Merchant M, Schäfer R, Sers C, Blüthgen N. Network quantification of EGFR signaling unveils potential for targeted combination therapy. Mol Syst Biol. 2013;9(1):673. doi: 10.1038/msb.2013.29. - DOI - PMC - PubMed
-
- Bozic I, Reiter JG, Allen B, Antal T, Chatterjee K, Shah P, Moon YS, Yaqubie A, Kelly N, le DT, Lipson EJ, Chapman PB, Diaz LA, Jr, Vogelstein B, Nowak MA. Evolutionary dynamics of cancer in response to targeted combination therapy. Elife. 2013;2:e00747. doi: 10.7554/eLife.00747. - DOI - PMC - PubMed
Publication types
MeSH terms
Substances
LinkOut - more resources
Full Text Sources
Medical
Miscellaneous
