. 2021 Jul 16;7(29):eabf4335.
doi: 10.1126/sciadv.abf4335. Print 2021 Jul.

FOXC2 controls adult lymphatic endothelial specialization, function, and gut lymphatic barrier preventing multiorgan failure

Affiliations

FOXC2 controls adult lymphatic endothelial specialization, function, and gut lymphatic barrier preventing multiorgan failure

Alejandra González-Loyola et al. Sci Adv. .

Abstract

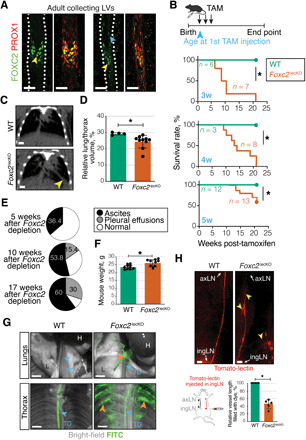
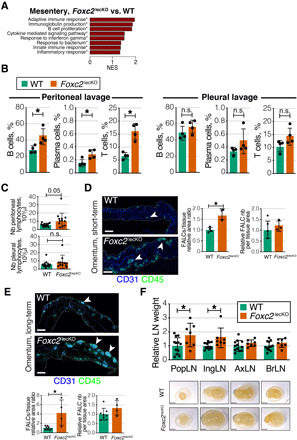
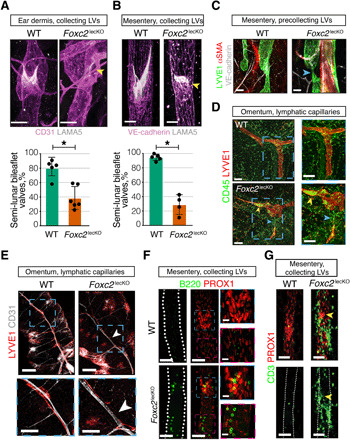
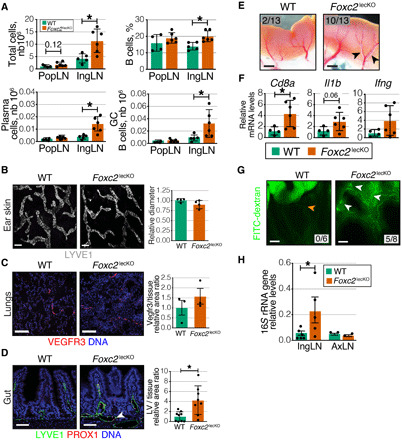
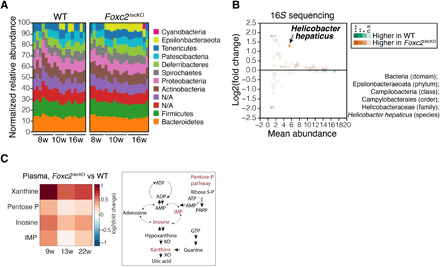
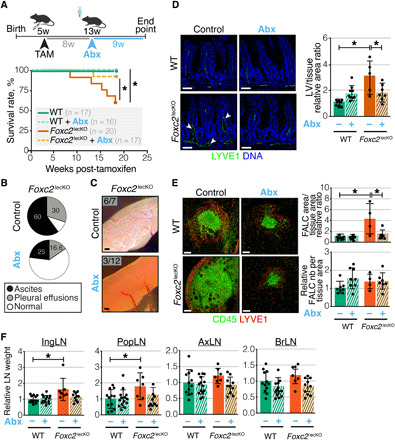
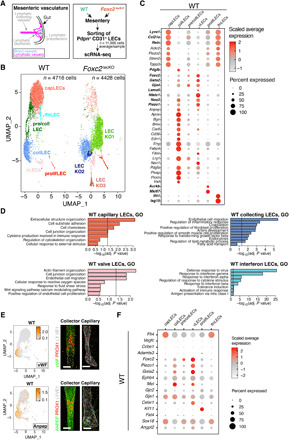
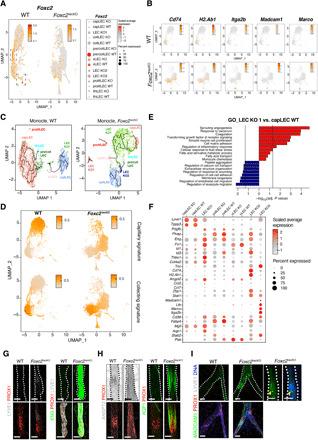
The mechanisms maintaining adult lymphatic vascular specialization throughout life and their role in coordinating inter-organ communication to sustain homeostasis remain elusive. We report that inactivation of the mechanosensitive transcription factor Foxc2 in adult lymphatic endothelium leads to a stepwise intestine-to-lung systemic failure. Foxc2 loss compromised the gut epithelial barrier, promoted dysbiosis and bacterial translocation to peripheral lymph nodes, and increased circulating levels of purine metabolites and angiopoietin-2. Commensal microbiota depletion dampened systemic pro-inflammatory cytokine levels, corrected intestinal lymphatic dysfunction, and improved survival. Foxc2 loss skewed the specialization of lymphatic endothelial subsets, leading to populations with mixed, pro-fibrotic identities and to emergence of lymph node-like endothelial cells. Our study uncovers a cross-talk between lymphatic vascular function and commensal microbiota, provides single-cell atlas of lymphatic endothelial subtypes, and reveals organ-specific and systemic effects of dysfunctional lymphatics. These effects potentially contribute to the pathogenesis of diseases, such as inflammatory bowel disease, cancer, or lymphedema.


Figures

Fig. 1
Fig. 1. Foxc2 loss disrupts transport function of adult lymphatics.
(A) FOXC2 in adult mesenteric LVs. Green, FOXC2; red, PROX1. Scale bars, 50 μm. Yellow arrowheads, FOXC2high vLECs; blue arrowhead, FOXC2+ lymphangion LECs. (B) Kaplan-Meier curve of WT or Foxc2lecKO mice survival. Tamoxifen administration at 3 weeks (*P < 0.001; n = 6 WT; n = 7 Foxc2lecKO), 4 weeks (*P < 0.01; n = 3 WT; n = 8 Foxc2lecKO), and 5 weeks of age (*P < 0.01; n = 12 WT; n = 13 Foxc2lecKO). (C) Computed tomography (CT) image of WT and Foxc2lecKO lungs. Yellow arrowhead, fluid accumulation. Scale bar, 0.25 cm. Tamoxifen administration at 5 weeks, analysis at 22 weeks. (D) Normalized WT and Foxc2lecKO lung volume. *P < 0.05; n = 4 WT; n = 10 Foxc2lecKO. (E) Ascites and pleural effusions at 5 weeks (n = 11), 10 weeks (n = 26), and 17 weeks (n = 10) after Foxc2 inactivation. (F) Increased weight of Foxc2lecKO mice. *P < 0.05; n = 10 WT; n = 9 16-week depleted Foxc2lecKO. (G) Backflow into lungs and intercostal Foxc2lecKO LVs following intraperitoneal injection of fluorescein isothiocyanate (FITC)–dextran (green). Orange arrowheads, backflow; blue arrowheads, thoracic duct (TD), lung (L), and heart (H). Scale bars, 2 mm. (H) Backflow in efferent skin Foxc2lecKO collecting vessel. Tomato-lectin injection into the inguinal LN (ingLN). Yellow arrowheads, backflow/lymph stasis. axLN, axillary LN. Scale bars, 2 mm. *P < 0.0001; n = 7 WT; n = 5 Foxc2lecKO mice. Data are means ± SD.
Fig. 2
Fig. 2. Foxc2 deficiency generates organ-specific immune response.
(A) Pathways enriched in transcriptomes of 10-week depleted Foxc2lecKO versus WT mesenteries. n = 3 WT; n = 4 Foxc2lecKO. NES, normalized enrichment score. Asterisks: Adjusted P value ≤ 0.05. (B) Increased percentage of CD45+B220+CD19+ B cells, CD45+B220+CD19+GL7CD138+ plasma cells, and CD45+CD90+CD19 T cells in the peritoneal, but not pleural cavity of Foxc2lecKO mice. *P ≤ 0.05; n = 4 WT; n = 4 Foxc2lecKO. n.s., not significant. (C) Total lymphocyte number in the peritoneal and pleural cavities of WT and long-term depleted Foxc2lecKO mice. *P < 0.05; n = 14 WT; n = 12 Foxc2lecKO. (D) Increased size, but not number, of omental FALCs after short-term, 5-week Foxc2 depletion. Green, CD45; blue, CD31. Scale bars, 400 μm. *P < 0.05; n = 4 WT; n = 3 Foxc2lecKO. (E) Increased size, but not number, of omental FALCs after long-term Foxc2 depletion. Green, CD45; blue, CD31. Scale bars, 400 μm. *P < 0.01; n = 8 WT; n = 4 Foxc2lecKO. (F) Normalized weights of popliteal (popLN), inguinal (ingLN), axillary (axLN), and brachial (BrLN) LNs 16 weeks after Foxc2 deletion. *P < 0.05; n = 12 WT; n = 7 Foxc2lecKO mice. Scale bars, 2 mm. Data are means ± SD.
Fig. 3
Fig. 3. Foxc2 inactivation disrupts hierarchical organization of lymphatic network in an organ-specific manner.
(A) Lymphatic valve leaflet degeneration in dermal vessels of 16-week depleted adult Foxc2lecKO mice ears. Pink, CD31; white, LAMA5. Yellow arrowhead, degenerated valve. Scale bars, 30 μm. Quantification of valves with mature semi-lunar shape in WT and Foxc2lecKO mice. *P < 0.001; n = 5 WT; n = 6 Foxc2lecKO. (B) Lymphatic valve leaflet degeneration in mesenteric vessels of adult Foxc2lecKO mice 16 weeks after tamoxifen administration. Staining for VE-cadherin (pink) and LAMA5 (white). Scale bars, 30 μm. Quantification of valves with mature semi-lunar shape in WT and Foxc2lecKO mice. *P < 0.001; n = 5 WT; n = 4 Foxc2lecKO. (C) Thinning of lymphatic precollecting vessels in mesentery of long-term depleted Foxc2lecKO mice. Green, LYVE1; red, αSMA; white, VE-cadherin. Blue arrow, vessel thinning. Scale bars, 50 μm. (D) Immune cell accumulation in omental lymphatic capillaries of Foxc2lecKO mice. Red, LYVE1; green, CD45. Yellow arrowhead, immune cells; blue arrowhead, LV disruption. Scale bars, 100 μm. (E) Omental lymphatic capillary disruption in Foxc2lecKO mice. Red, LYVE1; white, CD31. n = 6 WT; n = 4 Foxc2lecKO mice. White arrowheads, the point of LV disruption. Scale bars, 200 and 100 μm in magnified pictures. (F) B cells accumulate within LVs of Foxc2lecKO mice. Red, PROX1; green, B220. Blue square, accumulation of B cells within lymphatic valve sinuses. Pink square, accumulation of B cells within lymphangion. Scale bars, 50 and 20 μm for left and right images. (G) T cells around defective mesenteric lymphatic valves in Foxc2lecKO mice. Red, PROX1; green, CD3. Yellow arrowhead, defective valve. Scale bars, 50 μm.
Fig. 4
Fig. 4. Intestinal lymphangiectasia and gut epithelial barrier disruption in Foxc2lecKO mice.
(A) Increased average cell count and frequency of B cells, plasma cells number, and germinal center (GC) B cells in popliteal (popLN) and inguinal (ingLN) LNs of 16-week depleted Foxc2lecKO mice. *P ≤ 0.05; popLN, n = 4 WT, n = 6 Foxc2lecKO; ingLN, n = 5 WT, n = 6 Foxc2lecKO. (B) Normal ear lymphatic capillary organization in WT and 16-week depleted Foxc2lecKO mice. White, LYVE1. Capillary diameter normalized to WT mice. n.s.; n = 4 WT, n = 4 Foxc2lecKO. Scale bars, 50 μm. (C) Comparable lung LV organization in WT and 16-week depleted Foxc2lecKO mice. Red, vascular endothelial growth factor receptor 3 (VEGFR3); blue, 4′,6-diamidino-2-phenylindole (DAPI). VEGFR3+ area normalized to tissue area and WT values. n.s. n = 4 WT, n = 4 Foxc2lecKO. Scale bars, 400 μm. (D) Intestinal lymphangiectasia in 16-week depleted Foxc2lecKO mice. Green, LYVE1; red, PROX1; blue, DAPI. Scale bars, 50 μm. LV area normalized to tissue area and WT values. *P < 0.01; n = 9 WT; n = 8 Foxc2lecKO. (E) Chyle stasis in 16-week depleted Foxc2lecKO mice. Scale bars, 1 mm. (F) Increased CD8a in Foxc2lecKO intestine. RT-qPCR for the indicated transcripts. *P < 0.05; n = 4 WT, n = 6 Foxc2lecKO. (G) Gavaged FITC-dextran fills mesenteric LVs in Foxc2lecKO mice (white arrow), but not in WT mice (orange arrow). n = 6 WT, n = 8 Foxc2lecKO mice. Scale bars, 0.5 cm. (H) Bacterial translocation to Foxc2lecKO LNs. 16S rRNA levels in ingLNs and axLNs of WT and Foxc2lecKO mice, normalized to gut values. *P < 0.05; n = 6 WT, n = 5 Foxc2lecKO; axLN, n.s., n = 2 WT, n = 2 Foxc2lecKO.
Fig. 5
Fig. 5. Foxc2 loss modifies gut microbiome and increases circulating levels of purine metabolites.
(A) A higher proportion of Foxc2lecKO mice harbor members of the phylum Epsilonbacteraeota after 2 months of Foxc2 depletion. Stacked bar plots: relative bacterial amplicon sequence variant (ASV) abundance at the phylum level 8 weeks (n = 7 WT, n = 6 Foxc2lecKO), 10 weeks (n = 4 WT, n = 8 Foxc2lecKO), and 16 weeks (n = 7 WT, n = 7 Foxc2lecKO) after Foxc2 deletion. (B) Increased abundance of H. hepaticus in Foxc2lecKO mice. MA plot: The mean relative bacterial species abundance versus the log-transformed fold change of bacterial species relative abundance in the feces of WT and 8- to 16-week depleted Foxc2lecKO mice. Circles, species with calculated fold change abundance; triangles, species with infinite fold difference due to zero abundance. Color intensity proportional to the relative species abundance. n = 18 WT, n = 21 Foxc2lecKO. (C) Increased blood xanthine levels in Foxc2lecKO mice. Heatmap: Fold change of induced (red) or reduced (blue) metabolites in Foxc2lecKO versus WT mice. n = 6 WT, n = 7 Foxc2lecKO mice. Metabolites ordered by m/z (mass/charge ratio), adjusted P < 0.05. On the right, purine metabolic pathway is depicted.
Fig. 6
Fig. 6. Microbiota depletion rescues the phenotype of Foxc2lecKO mice.
(A) Antibiotics improve Foxc2lecKO mice survival. Treatment scheme and Kaplan-Meier survival curve of untreated and antibiotic-treated (Abx) WT mice and Foxc2lecKO mice *P < 0.05; n = 17 WT, n = 16 WT + Abx, n = 20 Foxc2lecKO, n = 17 Foxc2lecKO + Abx. (B) Ascites and pleural effusions in untreated and Abx-treated Foxc2lecKO mice. n = 10 Foxc2lecKO, n = 12 Foxc2lecKO + Abx. (C) Microbiota depletion rescues chyle stasis of Foxc2lecKO mice. Bright-field pictures, n = 7 Foxc2lecKO, n = 12 Foxc2lecKO + Abx. Scale bars, 1 mm. (D) Intestinal lymphangiectasia in Foxc2lecKO mice. Green, LYVE1; blue, DAPI. Scale bars, 50 μm. LV area normalized to tissue area. *P < 0.01; n = 9 WT, n = 9 WT + Abx, n = 5 Foxc2lecKO, n = 7 Foxc2lecKO + Abx. (E) Microbiota depletion abrogates omental FALC enlargement of Foxc2lecKO mice. Green, CD45; red, LYVE1. Scale bars, 100 μm. FALC size and number normalized to tissue area in WT and Foxc2lecKO mice. *P < 0.001 WT versus Foxc2lecKO; *P < 0.01 Foxc2lecKO versus Foxc2lecKO + Abx, n = 8 WT; n = 8 WT + Abx, n = 4 Foxc2lecKO; n = 7 Foxc2lecKO + Abx. (F) Microbiota depletion abrogates enlargement of peripheral Foxc2lecKO LNs. *P < 0.01 inguinal LN (ingLN) in WT versus Foxc2lecKO; *P < 0.05, popliteal LN (popLN) in WT versus Foxc2lecKO, n = 12 WT, n = 14 WT + Abx, n = 7 Foxc2lecKO, n = 10 Foxc2lecKO + Abx. Data are means ± SD.
Fig. 7
Fig. 7. Single-cell transcriptome profiling defines molecular and functional subsets of adult LECs.
(A) Workflow of the scRNA-seq experiment. Cells were sorted from mesenteries of 6-week-old WT and Foxc2lecKO mice 3 weeks after Foxc2 depletion. n = 3 per genotype. (B) UMAP plot of WT and Foxc2lecKO LECs. Six major clusters of LECs in WT mice and nine major clusters in Foxc2lecKO mice were identified. (C) Dot plot of known markers (in bold) and selected new genes for WT LEC clusters: capillary (capLECs), collecting (collLECs), precollecting and collecting (pre/collLECs), valve (vLECs), proliferative (prolifLECs), and IFN (IfnLECs). The color code indicates scaled average expression level in each cluster, and the dot size indicates the percent of cells in each cluster expressing the given gene. (D) Bar plots of a subset of GO gene sets that were overrepresented among genes up-regulated in capLEC, collLEC, vLEC, and IfnLEC clusters of WT mice. (E) Expression level per cell (ln[normalized counts + 1]) of the new WT LEC markers vWF and Anpep overlaid on the UMAP and staining of adult mesenteric lymphatic collLVs and capillaries showing expression of vWF or ANPEP (green) and PROX1 (red). Scale bars, 50 μm. (F) Dot plot of expression of hereditary lymphedema–related genes in adult LEC subsets of WT mice. The color code indicates scaled average expression level in each cluster, and the dot size indicates the percent of cells in each cluster expressing the given gene.
Fig. 8
Fig. 8. Foxc2 loss modifies the molecular identity of the entire lymphatic vascular network.
(A) Foxc2 inactivation eliminates Foxc2high LECs. Foxc2 expression per cell (ln[normalized counts + 1]) overlaid on UMAP plot, split by genotype. Square area: Foxc2 expression in WT LECs. Color code: Scaled average expression level in each cluster; the dot size denotes the percent of Foxc2+ cells in each cluster. (B) New Foxc2lecKO immune-related LEC subsets. Expression level per cell (ln[normalized counts + 1]) of the indicated transcripts overlaid on WT or Foxc2lecKO UMAP plots. (C) Trajectory analysis of WT and Foxc2lecKO LECs. UMAP was generated independently for each genotype using Monocle3. (D) capLEC and collLEC phenotypes converge upon loss of Foxc2. Module score per cell overlaid on UMAP plot, split by genotype. Scores calculated using WT collLECs versus capLECs up- or down-regulated transcripts. Higher score indicates that more signature genes are expressed in a cell. (E) GO terms overrepresented among up-regulated (red bars) or down-regulated (blue bars) LEC cluster KO1 transcripts versus WT capLECs. Vertical lines: Adjusted P value = 0.05. (F) Dot plot of markers for the indicated LEC subsets in WT and Foxc2lecKO LECs. Color code: Scaled average expression level in each cluster; the dot size denotes the percent of cells in each cluster expressing the given gene. (G) LYVE1 and ENG are reexpressed in Foxc2lecKO collLVs (collecting LVs) or capLVs (capillary LVs). Scale bars, 50 μm. (H) Increased ANGPT2 (white) and AQP1 (green) in PROX1+ (red) Foxc2lecKO LVs. Scale bars, 50 μm. (I) LN LEC cells are located in Foxc2lecKO collLVs. Green, MADCAM1; red, PROX1; white, LYVE1; blue, DNA. Right: Accumulating DAPI+ (blue) cells inside the MADCAM1+ (green) LVs. Scale bars, 50 μm.

References

    1. Petrova T. V., Koh G. Y., Biological functions of lymphatic vessels. Science 369, eaax4063 (2020). - PubMed
    1. Oliver G., Kipnis J., Randolph G. J., Harvey N. L., The lymphatic vasculature in the 21st century: Novel functional roles in homeostasis and disease. Cell 182, 270–296 (2020). - PMC - PubMed
    1. González-Loyola A., Petrova T. V., Development and aging of the lymphatic vascular system. Adv. Drug Deliv. Rev. 169, 63–78 (2021). - PubMed
    1. Ulvmar M. H., Mäkinen T., Heterogeneity in the lymphatic vascular system and its origin. Cardiovasc. Res. 111, 310–321 (2016). - PMC - PubMed
    1. Sabine A., Bovay E., Demir C. S., Kimura W., Jaquet M., Agalarov Y., Zangger N., Scallan J. P., Graber W., Gulpinar E., Kwak B. R., Makinen T., Martinez-Corral I., Ortega S., Delorenzi M., Kiefer F., Davis M. J., Djonov V., Miura N., Petrova T. V., FOXC2 and fluid shear stress stabilize postnatal lymphatic vasculature. J. Clin. Invest. 125, 3861–3877 (2015). - PMC - PubMed

Publication types

MeSH terms

Substances