. 2021 Jul 16;7(29):eabg1556.
doi: 10.1126/sciadv.abg1556. Print 2021 Jul.

Polycomb-group recruitment to a Drosophila target gene is the default state that is inhibited by a transcriptional activator

Affiliations

Polycomb-group recruitment to a Drosophila target gene is the default state that is inhibited by a transcriptional activator

Elnaz Ghotbi et al. Sci Adv. .

Abstract

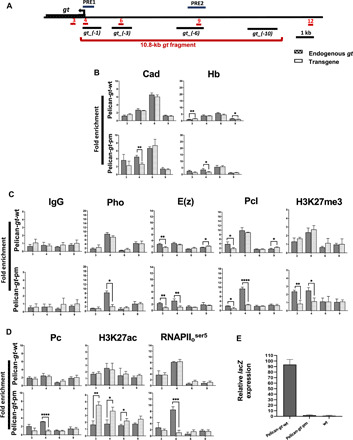
Polycomb-group (PcG) proteins are epigenetic regulators that maintain the transcriptional repression of target genes following their initial repression by transcription factors. PcG target genes are repressed in some cells, but active in others. Therefore, a mechanism must exist by which PcG proteins distinguish between the repressed and active states and only assemble repressive chromatin environments at target genes that are repressed. Here, we present experimental evidence that the repressed state of a Drosophila PcG target gene, giant (gt), is not identified by the presence of a repressor. Rather, de novo establishment of PcG-mediated silencing at gt is the default state that is prevented by the presence of an activator or coactivator, which may inhibit the catalytic activity of Polycomb-repressive complex 2 (PRC2).


Figures

Fig. 1
Fig. 1. Effects of RNAi-mediated depletion of Hb and/or Cad.
(A) Map of the gt genomic region containing two PREs and four enhancers. Locations of PRE1 and PRE2 are indicated above. Below, numbers and positions of PCR amplified regions are shown in red; gt enhancers are shown in black. (B and C) ChIP-qPCR performed with anti-Hb and anti-Cad antibodies, as indicated, using (B) nc13 and (C) nc14b embryos. Maternal genotypes and the expression state of gt are indicated. ChIP signals are presented as fold enrichment relative to signals at Pka-C1, which have a value of 1. (D) qRT-PCR assays of gt mRNA expression in the indicated embryos. Values are shown relative to levels of gt in wild-type embryos, which has a value of 100. Signals from three biological replicas are presented. Error bars show the SD for three biological replicates. *P < 0.05; **P < 0.01; ***P < 0.001; ****P < 0.0001.
Fig. 2
Fig. 2. Distribution of PcG proteins, histone modifications, and RNAP II at gt in the presence or absence of Hb and/or Cad.
(A and B) ChIP-qPCR performed in nc14b embryos with the indicated antibodies. Genotypes of embryos are indicated in the key. (A) IgG, anti-Pho, anti-E(z), and anti-H3K27me3. (B) Anti-Pcl, anti-Pc, anti-H3K27ac, and anti-RNAPIIoser5. Maternal genotypes and the expression state of gt are indicated. Signals for histone modifications were normalized to total H3 signals that were obtained using an anti-H3 antibody. ChIP signals are presented as fold enrichment relative to signals at Pka-C1, as in Fig. 1, except for anti-H3K27ac and anti- RNAPIIoser5 signals, which are presented as fold enrichment relative to signals at gt region 12. Error bars show the SD for three biological replicates. *P < 0.05; **P < 0.01; ***P < 0.001.
Fig. 3
Fig. 3. PcG recruitment is not determined by the transcriptional state of a gt transgene.
(A) Map of gt genomic region as in Fig. 1. The location of the genomic fragment in Pelican constructs is below. (B to D) ChIP-qPCR of (B) nc13 and (C and D) nc14b embryos from Hb-KD-bcd osk tsl females crossed to males that contained the transgene indicated on the left. Antibodies indicated above. ChIP signals from three biological replicates are presented as in Fig. 2. (E) qRT-PCR showing lacZ levels in nc13–nc14a Pelican-gt-pm, Pelican-gt-wt, and wild-type (wt; no transgene) embryos. Y-axis, qPCR signals relative to Pelican-gt-wt. Signals from three biological replicates are presented. *P < 0.05; **P < 0.01; ***P < 0.001; ****P < 0.0001.
Fig. 4
Fig. 4. Model for regulation of PcG recruitment.
(A) In the presence of an activator (Act) (e.g., Cad) and absence of a repressor (Rep) (e.g., Hb), PhoRC binding is permitted, but stable PRC2 recruitment is inhibited. This may be due to recruitment of CBP, which acetylates H3K27, inhibiting H3K27me3 deposition and stable recruitment of PRC2 and PRC1. CBP may be directly recruited by the activator as a coactivator or as a component of an independent complex. (B) When both repressor and activator are present, the repressor sufficiently inhibits the inhibitory effect of the activator, permitting PRC2-dependent H3K27me3 deposition and stable recruitment of PRC2 and PRC1. This may be due to the deacetylase activity of an HDAC recruited by the repressor. (C) When the repressor is present, but the activator is absent, recruitment is similar to when the activator is also present. (D) In the absence of both activator and repressor, the default state is a stable recruitment of PcG complexes. The observed gt expression state in the presence or absence of an activator and/or repressor is indicated on the right. Solid outlines indicate the presence of proteins or complexes based on our observations. Dashed outlines indicate the presence of proteins based on previous reports.

References

    1. Oktaba K., Gutiérrez L., Gagneur J., Girardot C., Sengupta A. K., Furlong E. E. M., Müller J., Dynamic regulation by polycomb group protein complexes controls pattern formation and the cell cycle in Drosophila. Dev. Cell 15, 877–889 (2008). - PubMed
    1. Jones R. S., Gelbart W. M., Genetic analysis of the enhancer of zeste locus and its role in gene regulation in Drosophila melanogaster. Genetics 126, 185–199 (1990). - PMC - PubMed
    1. Struhl G., Akam M., Altered distributions of Ultrabithorax transcripts in extra sex combs mutant embryos of Drosophila. EMBO J. 4, 3259–3264 (1985). - PMC - PubMed
    1. White R. A. H., Lehmann R., A gap gene, hunchback, regulates the spatial expression of Ultrabithorax. Cell 47, 311–321 (1986). - PubMed
    1. Kuroda M. I., Kang H., De S., Kassis J. A., Dynamic competition of Polycomb and Trithorax in transcriptional programming. Annu. Rev. Biochem. 89, 235–253 (2020). - PMC - PubMed

LinkOut - more resources