

Dosimetric Quantities in Neuroendocrine Tumors over Treatment Cycles with 177Lu-DOTATATE
- PMID: 34272319
- PMCID: PMC8978188
- DOI: 10.2967/jnumed.121.262069
Dosimetric Quantities in Neuroendocrine Tumors over Treatment Cycles with 177Lu-DOTATATE
Abstract
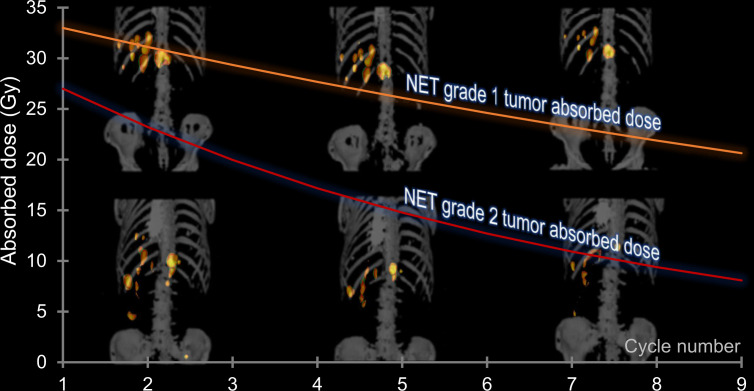
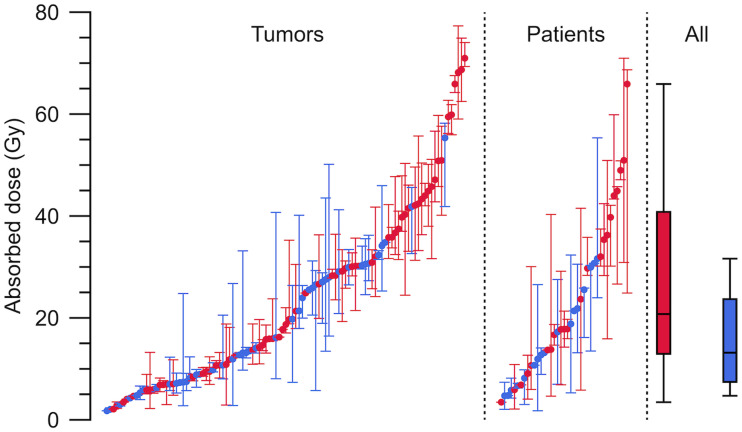
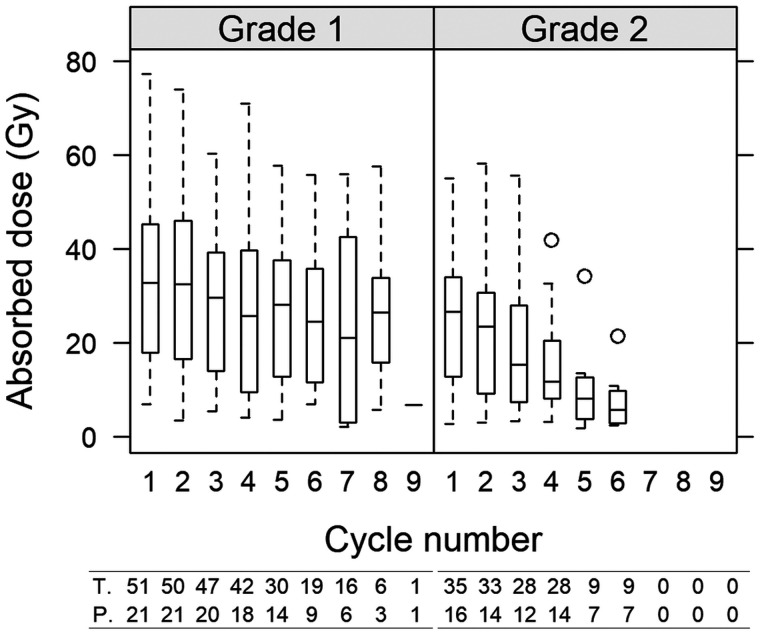
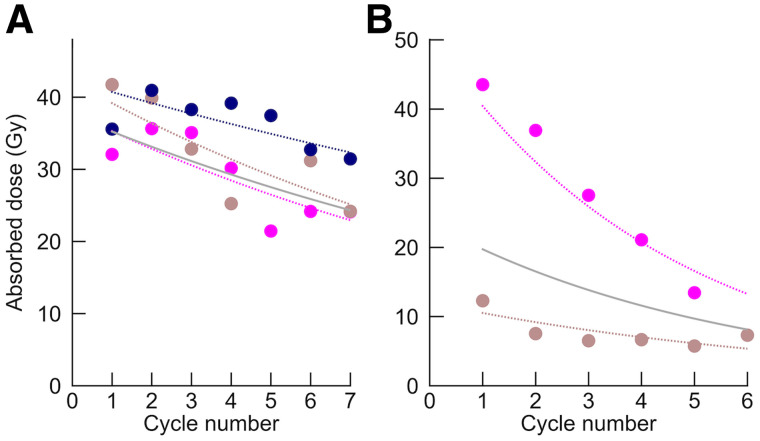
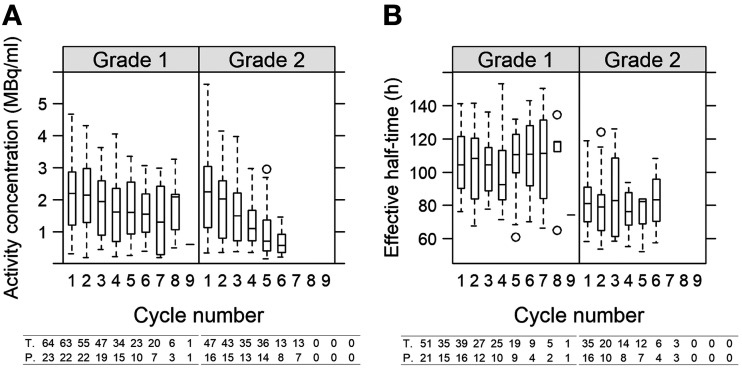
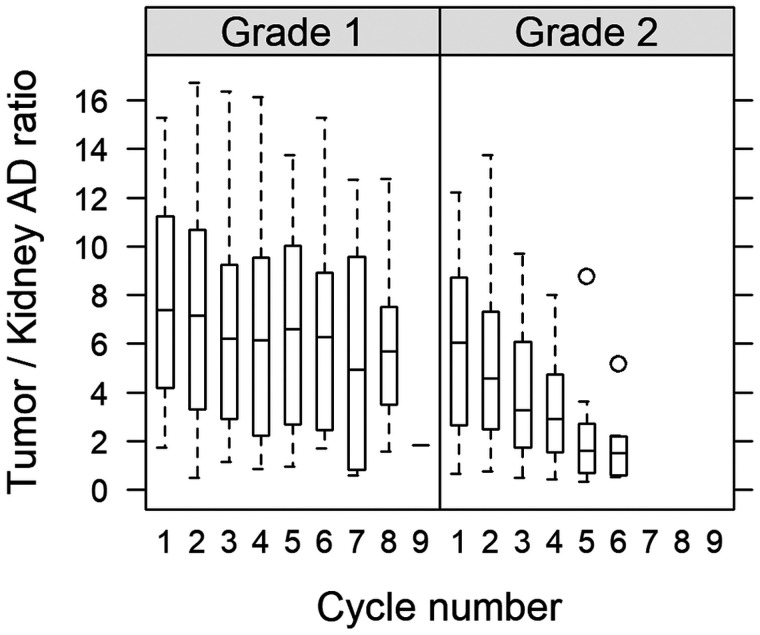
Tumor dosimetry was performed for 177Lu-DOTATATE with the aims of better understanding the range and variation of the tumor-absorbed doses (ADs), how different dosimetric quantities evolve over the treatment cycles, and whether this evolution differs depending on the tumor grade. Such information is important for radiobiologic interpretation and may inform the design of alternative administration schemes. Methods: The data came from 41 patients with neuroendocrine tumors (NETs) of grade 1 (n = 23) or 2 (n = 18) who had received between 2 and 9 treatment cycles. Dosimetry was performed for 182 individual lesions, giving a total of 880 individual AD assessments across all cycles. Hybrid planar-SPECT/CT imaging was used, including quantitative SPECT reconstruction, voxel-based absorbed-dose-rate calculation, semiautomatic image segmentation, and partial-volume correction. Linear mixed-effect models were used to analyze changes in tumor ADs over cycles, absorbed-dose rates and activity concentrations on day 1, effective half-times, and tumor volumes. Tumors smaller than 8 cm3 were excluded from analyses. Results: Tumor ADs ranged between 2 and 77 Gy per cycle. On average, the AD decreased over the cycles, with significantly different rates (P < 0.05) of 6% and 14% per cycle for grade 1 and 2 NETs, respectively. The absorbed-dose rates and activity concentrations on day 1 decreased by similar amounts. The effective half-times were less variable but shorter for grade 2 than for grade 1 (P < 0.001). For grade 2 NETs, the tumor volumes decreased, with a similar tendency in grade 1. Conclusion: The tumor AD, absorbed-dose rate, and activity uptake decrease, in parallel with tumor volumes, between 177Lu-DOTATATE treatment cycles, particularly for grade 2 NETs. The effective half-times vary less but are lower for grade 2 than grade 1 NETs. These results may indicate the development of radiation-induced fibrosis and could have implications for the design of future treatment and dosimetry protocols.
Keywords: 177Lu-DOTATATE; absorbed dose; fractionation; neuroendocrine tumors.
© 2022 by the Society of Nuclear Medicine and Molecular Imaging.
Figures
References
-
- Kwekkeboom DJ, de Herder WW, Kam BL, et al. . Treatment with the radiolabeled somatostatin analog [177Lu-DOTA0, Tyr3]octreotate: toxicity, efficacy, and survival. J Clin Oncol. 2008;26:2124–2130. - PubMed
-
- Kim SJ, Pak K, Koo PJ, Kwak JJ, Chang S. The efficacy of 177Lu-labelled peptide receptor radionuclide therapy in patients with neuroendocrine tumours: a meta-analysis. Eur J Nucl Med Mol Imaging. 2015;42:1964–1970. - PubMed
-
- Barone R, Borson-Chazot F, Valkema R, et al. . Patient-specific dosimetry in predicting renal toxicity with 90Y-DOTATOC: relevance of kidney volume and dose rate in finding a dose-effect relationship. J Nucl Med. 2005;46(suppl 1):99S–106S. - PubMed
MeSH terms
Substances
LinkOut - more resources
Full Text Sources
Miscellaneous