. 2021 Jul 16;12(1):4365.
doi: 10.1038/s41467-021-24562-2.

Biochemical and functional characterization of mutant KRAS epitopes validates this oncoprotein for immunological targeting

Affiliations

Biochemical and functional characterization of mutant KRAS epitopes validates this oncoprotein for immunological targeting

Adham S Bear et al. Nat Commun. .

Abstract

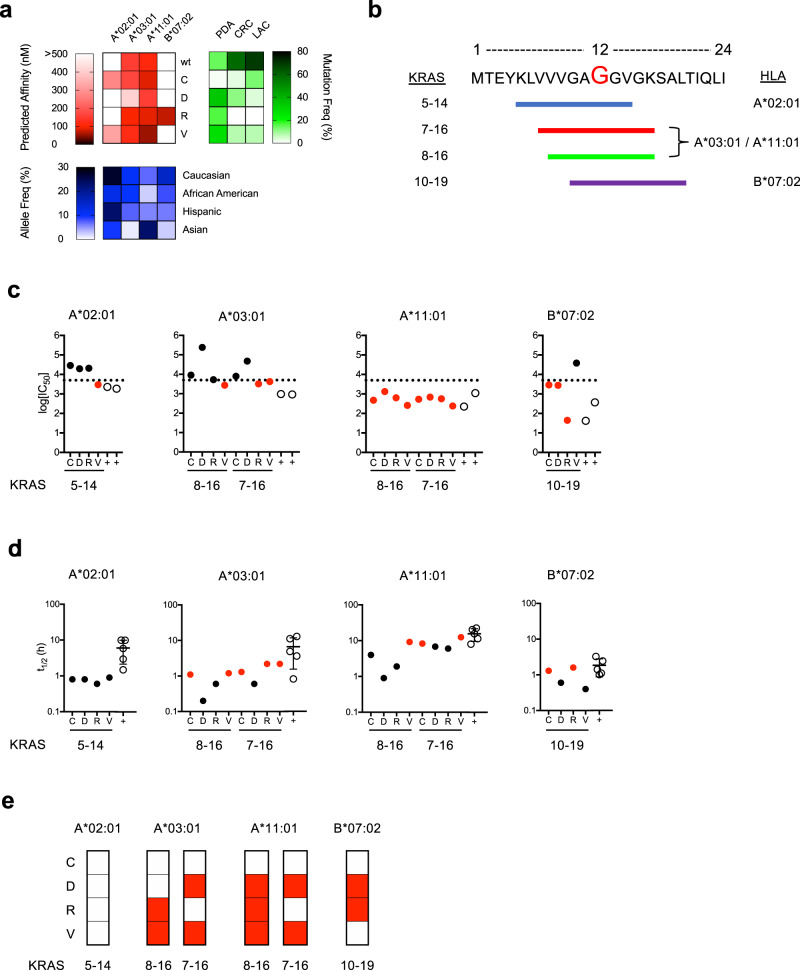
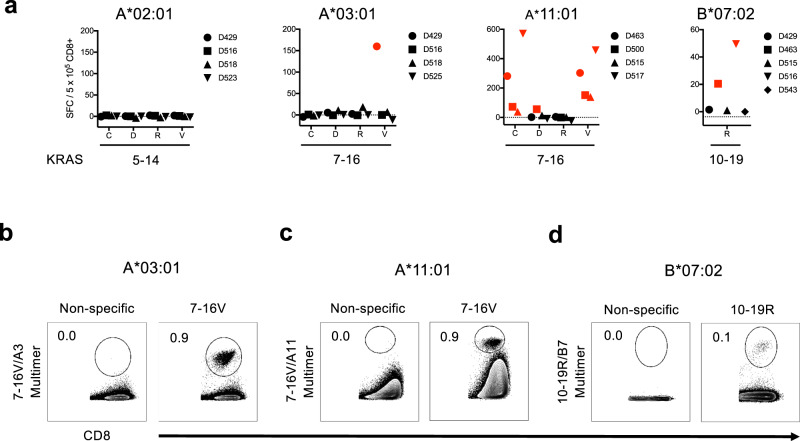
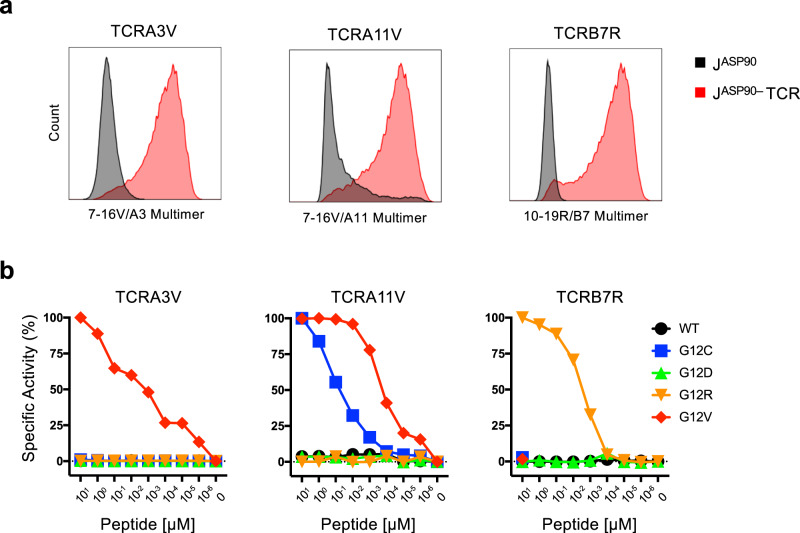
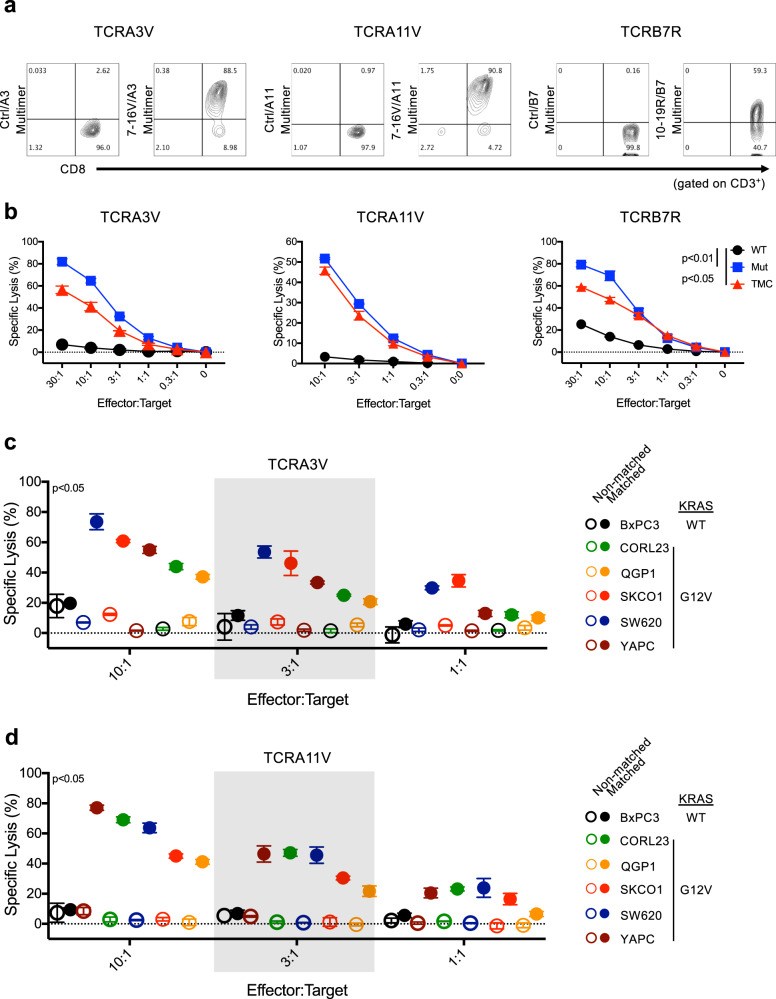
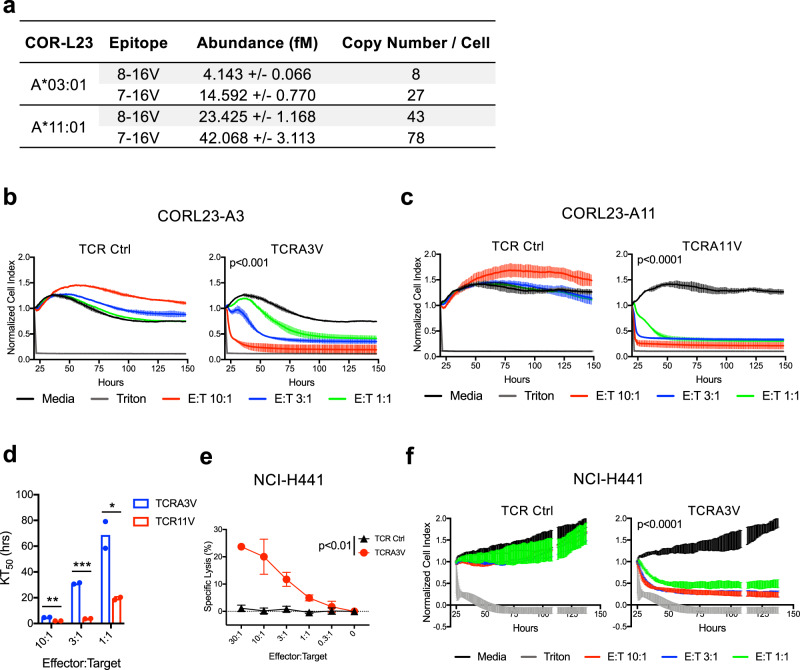
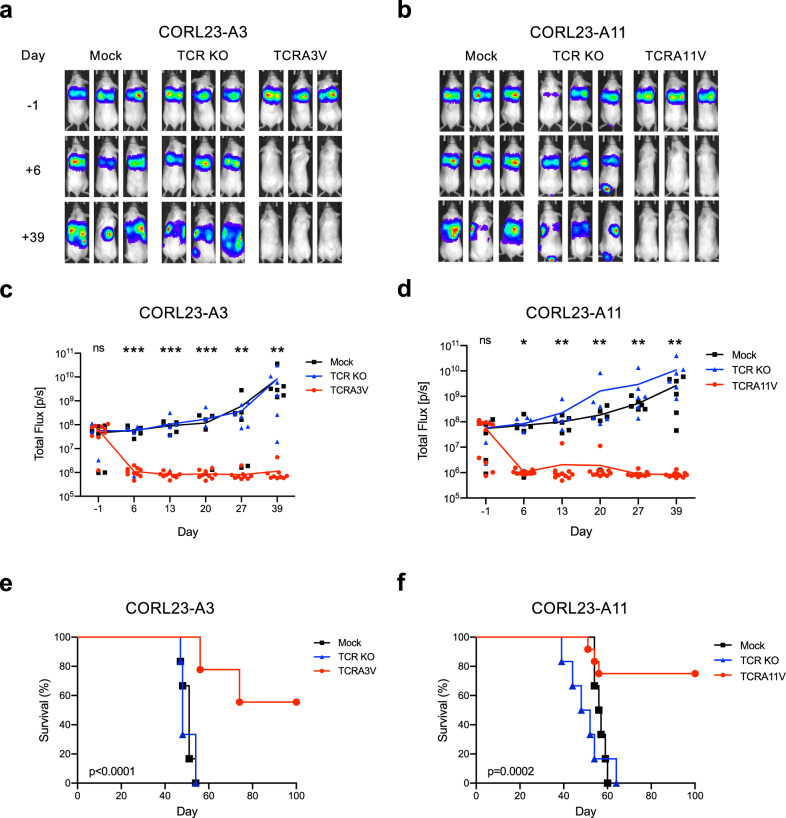
Activating RAS missense mutations are among the most prevalent genomic alterations observed in human cancers and drive oncogenesis in the three most lethal tumor types. Emerging evidence suggests mutant KRAS (mKRAS) may be targeted immunologically, but mKRAS epitopes remain poorly defined. Here we employ a multi-omics approach to characterize HLA class I-restricted mKRAS epitopes. We provide proteomic evidence of mKRAS epitope processing and presentation by high prevalence HLA class I alleles. Select epitopes are immunogenic enabling mKRAS-specific TCRαβ isolation. TCR transfer to primary CD8+ T cells confers cytotoxicity against mKRAS tumor cell lines independent of histologic origin, and the kinetics of lytic activity correlates with mKRAS peptide-HLA class I complex abundance. Adoptive transfer of mKRAS-TCR engineered CD8+ T cells leads to tumor eradication in a xenograft model of metastatic lung cancer. This study validates mKRAS peptides as bona fide epitopes facilitating the development of immune therapies targeting this oncoprotein.


Conflict of interest statement

R.H.V. reports having received consulting fees or honoraria from Medimmune and Verastem; and research funding from Fibrogen, Janssen, and Lilly. He is an inventor on a licensed patent relating to cancer cellular immunotherapy and cancer vaccines, and receives royalties from Children’s Hospital Boston for a licensed research-only monoclonal antibody. A.S.B., R.H.V., G.P.L., and B.M.C. have filed a patent application (PCT/US2020/014988) related to the targeting of KRAS for immunotherapy entitled “Compositions and Methods for Targeting Mutant RAS”. A.S., A.D.P., and D.J.P. have filed a patent application (PCT/US2019/026378) that incorporates discoveries related to the NFAT reporter system used in this study entitled “Methods and Compositions Comprising a Viral Vector for Expression of a Transgene and an Effector”. M.J.F. is a founder and an employee of MS Bioworks. All other authors have no competing interest to declare.

Figures

Fig. 1
Fig. 1. Identification, characterization, and validation of candidate mKRAS epitopes.
a Heat maps displaying candidate WT and mKRAS epitopes with predicted HLA class I binding affinity (red) to the indicated alleles as determined by antigen.garnish, USA population HLA class I allele frequencies (blue) are as reported in the Allele Frequency Net Database, and mKRAS G12 variant frequencies (green) in pancreatic adenocarcinoma (PDA; n = 836), colorectal cancer (CRC; n = 866), and lung adenocarcinoma (LAC; n = 516) patients are as reported in the ICGC Data Portal. b Graphic depiction of the KRAS 24-mer containing candidate epitopes restricted by alleles shown in (a). The G12 codon is indicated in red. Epitopes are identified by colored lines, and amino acid positions as well as HLA class I restricting alleles are indicated. c Peptide affinity measurements of mKRAS epitopes to HLA-A*02:01, HLA-A*03:01, HLA-A*11:01, and HLA-B*07:02. p-HLA affinities were assessed by fluorescence polarization competitive peptide-binding assays. High peptide affinity is classified as a log10[IC50] < 3.7 nM and is indicated by the dashed line. d p-HLA complex stability measurements of mKRAS epitopes to HLA-A*02:01, HLA-A*03:01, HLA-A*11:01, and HLA-B*07:02. p-HLA stability measurements were determined by scintillation proximity assay of β2-microglobulin dissociation. For each HLA class I allele tested, β2-microglobulin association with MHC heavy chain in the absence of peptide served as negative controls. Displayed p-HLA affinity and stability values represent the mean of two independent tests. For affinity and stability assays, validated T cell epitopes for each allele were used as positive controls (open circles) and are listed in Supplementary Table 3. Error bars in panel (d) specify mean values ± SD of positive controls. mKRAS peptides with high measured binding affinity or stability are indicated as red circles. e Summary chart of MS/MS detected HLA class I restricted mKRAS epitopes processed and presented by TMC-engineered monoallelic cell lines (red). Validated viral epitopes (NLV, ILR, IVT, and TPR) encoded by the TMC construct were used as positive controls for epitope processing and presentation and are listed in Supplementary Table 3. Source data are provided as a Source Data file.
Fig. 2
Fig. 2. Assessment of mKRAS neoantigen immunogenicity and identification of mKRAS-specific TCR sequences.
a IFN-γ ELISPOT assay results following in vitro expansion of healthy donor purified CD8+ T cells stimulated with mKRAS peptide-pulsed autologous mDC. IFN-γ ELISPOT Spot Forming Cell (SFC) values are substrated from media controls for each subject. The data presented are the pooled results from single experiments of individual donors represented by symbols indicated in the figure legend. Red symbols denote donors with positive responses. b p-HLA multimer analysis demonstrating positive 7-16V-specific HLA-A*03:01-restricted CD8+ T cell response isolated from donor D429. c p-HLA multimer analysis demonstrating positive 7-16V-specific HLA-A*11:01-restricted CD8+ T cell response isolated from donor D500. d p-HLA multimer analysis demonstrating positive 10-19R-specific HLA-B*07:02-restricted CD8+ T cell response isolated from donor D516. Cells were stained with p-HLA multimer and anti-CD8 Ab. p-HLA multimer staining of respective donor CD8+ T cells stimulated in the absence of peptide (non-specific) were used as staining controls. A total of 1 × 106 live events were collected gating on FSC/SSC/CD8+ cells. Data presented in panels (bd) are representative of two independent tests. Source data are provided as a Source Data file.
Fig. 3
Fig. 3. Validation and functional characterization of mKRAS-specific TCRs.
a FACS histogram plots demonstrating p-HLA multimer staining following lentiviral engineering of JASP90 reporter cells with TCRA3V, TCRA11V, and TCRB7R constructs (red) vs TCRαβnull controls (black). b JASP90 reporter assay to evaluate antigen recognition. JASP90 reporter cells expressing TCRA3V, TCRA11V, or TCRB7R were cocultured with HLA-matched monoallelic K562 cell lines pulsed with titrated concentrations of WT KRAS or mKRAS peptides. TCR signaling is indicated by eGFP expression upon NFAT activation. TCR avidity was determined as the mean peptide concentration required to achieve 50% NFAT activation of TCR-engineered JASP90 reporter cells. Specific Activity (%) = (%GFPTest – %GFPMin) / (%GFPMax – %GFPMin) x 100. Representative experiments of three independent evaluations are shown. Source data are provided as a Source Data file.
Fig. 4
Fig. 4. mKRAS TCRαβ gene transfer confers HLA-restricted lytic activity against human tumor cells.
a FACS plot demonstrating p-HLA multimer binding to TCRA3V-, TCRA11V-, and TCRB7R-engineered TCRαβnull primary CD8+ T cells gated on viable/CD3+ population. The following p-HLA multimers were used as staining controls: gp17-25/A3, gp17-25/A11, NY60-72/B7 (Supplementary Table 3). b 4 h 51Cr-release cytotoxicity assay demonstrating TCRA3V, TCRA11V, and TCRB7 cell tumoricidal activity against TMC-expressing (red), mKRAS peptide-pulsed (blue), or WT KRAS peptide-pulsed (black) monoallelic K562 target cells. Percent-specific lysis of triplicates is shown for each data point. Data are presented as mean ± SD. p < 0.05 or p < 0.01 for all E:T ratios ≥0.3:1 comparing TMC-expressing or mKRAS peptide-pulsed to WT KRAS peptide-pulsed K562 targets, respectively; one-way ANOVA followed by post-hoc pair-wise Student’s t-test with multiple comparison adjustment. c, d. 4 h 51Cr-release cytotoxicity assay demonstrating TCRA3V and TCRA11V tumoricidal activity against cancer cell lines harboring WT KRAS (BxPC-3) or endogenous KRAS G12V mutation either non-modified (open circles, non-HLA matched) or engineered to express the restricting HLA allele (closed circles, HLA-matched). Each color represents a different cell line as identified in the figure legend. No significant cytotoxicity was observed against HLA matched vs non-matched BxPC-3 cell lines. Data are presented as mean values ± SD (n = 3 biologically independent samples). p < 0.05 for all E:T ratio ≥1:1 comparing HLA matched vs non-matched cell lines harboring endogenous KRAS G12V mutation; one-way ANOVA followed by post-hoc pair-wise Student’s t-test with multiple comparison adjustment. Source data are provided as a Source Data file.
Fig. 5
Fig. 5. Quantitation and recognition of KRAS G12V peptide ligands presented by human tumor cell lines.
a Absolute quantification of cell surface expression of 8-16V/HLA and 7-16V/HLA complexes by CORL23-A3 and CORL23-A11 cells. Data are representative of two independent experiments. b Cellular impedance to determine the kinetics of tumor cell death upon TCRA3V lytic recognition of CORL23-A3 vs TCR Ctrl (TCRA11V). Normalized cell index values over time for E:T ratios of 10:1, 3:1, and 1:1 are shown compared to tumor cells cultured in media alone. Data for cells exposed to triton-X to represent maximal impedance loss are displayed. Data are presented as mean values ± SD. p < 0.001 at 150 h for all E:T ratios for the TCRA3V group compared to media; one-way ANOVA followed by post-hoc pair-wise Student’s t-test with multiple comparison adjustment. Data are representative of two independent experiments. c Cellular impedance data following TCRA11V lytic recognition of CORL23-A11 vs TCR Ctrl (TCRA3V). Data are presented as mean values ± SD. p < 0.0001 at 150 h for all E:T ratios for the TCRA11V group compared to media; one-way ANOVA followed by post-hoc pair-wise Student’s t-test with multiple comparison adjustment. Data are representative of two independent experiments. d Comparative kinetics of the time to reach 50% cell death (KT50) of CORL23-A3 and CORL23-A11 cells upon TCRA3V and TCRA11V recognition, respectively, at E:T ratios of 10:1, 3:1, and 1:1. Data are presented as mean values with independent replicates displayed. *p < 0.05, **p < 0.01, ***p < 0.001; multiple t-test analysis. Data are representative of two independent experiments. e 4 h 51Cr-release cytotoxicity assay demonstrating TCRA3V tumoricidal activity against NCI-H441 cells (G12V+/HLA-A*03:01+) compared to TCR Ctrl (TCRA11V) cells. Data are presented as mean values ± SD. p < 0.01 for all E:T ratio ≥ 1:1; one-tailed Student’s t-test. Data are representative of two independent experiments. f Cellular impedance data following TCRA3V lytic recognition of NCI-H441 vs TCR Ctrl (TCRA11V). Data are presented as mean values ± SD. p < 0.0001 at 130 h for all E:T ratios for the TCRA3V group compared to media; one-way ANOVA followed by post-hoc pair-wise Student’s t-test with multiple comparison adjustment. Data are representative of two independent experiments. Source data are provided as a Source Data file.
Fig. 6
Fig. 6. Adoptive transfer of mKRAS-TCR T cells leads to in vivo eradication of KRAS G12V+ tumor cells in a xenograft model of metastatic lung cancer.
CORL23-A3 or CORL23-A11 tumors expressing CBR luciferase were engrafted into NSG mice via intravenous tail vein injection. Mice were left untreated (Mock) or treated with TCR αβ null (TCR KO) or mKRAS-TCR engineered CD8+ T cells 4 days after tumor engraftment. Tumor burden was assessed by bioluminescence imaging before and after treatment, and overall survival was monitored over time. Representative bioluminescence imaging prior to and following treatment of NSG mice bearing a CORL23-A3 pulmonary tumors treated with TCRA3V T cells and b CORL23-A11 pulmonary tumors treated with TCRA11V cells compared to control groups. Total Flux quantification over time of c CORL23-A3 and d CORL23-A11 tumor-bearing mice as shown in (a) and (b). Colored lines represent mean Total Flux values over time with individual data points corresponding to treatment groups presented as indicated in the figure legend. *p < 0.05, **p < 0.01, ***p < 0.001; one-way ANOVA followed by Tukey’s HSD post-test comparing Mock and TCRA3V or TCRA11V treated mice. No statistical difference was observed between Mock and TCR KO treated mice. Kaplan–Meier analysis of overall survival of e CORL23-A3 and f CORL23-A11 tumor-bearing mice. Colored lines correspond to treatment groups as indicated in the figure legend. p values as indicated; log-rank testing comparing Mock and TCRA3V or TCRA11V treated mice. No statistical difference was observed between Mock and TCR KO treated mice. Number of mice in representative experiment is as follows: CORL23-A3 Cohort—Mock (n = 6), TCR KO (n = 6), TCRA3V (n = 10). CORL23-A11 Cohort—Mock (n = 6), TCR KO (n = 6), TCRA11V (n = 12). Source data are provided as a Source Data file.

References

    1. Downward J. Targeting RAS signalling pathways in cancer therapy. Nat. Rev. Cancer. 2003;3:11–22. doi: 10.1038/nrc969. - DOI - PubMed
    1. Karnoub AE, Weinberg RA. Ras oncogenes: split personalities. Nat. Rev. Mol. Cell Biol. 2008;9:517–531. doi: 10.1038/nrm2438. - DOI - PMC - PubMed
    1. Simanshu DK, Nissley DV, McCormick F. RAS proteins and their regulators in human disease. Cell. 2017;170:17–33. doi: 10.1016/j.cell.2017.06.009. - DOI - PMC - PubMed
    1. Cox AD, Fesik SW, Kimmelman AC, Luo J, Der CJ. Drugging the undruggable RAS: mission possible? Nat. Rev. Drug Discov. 2014;13:828–851. doi: 10.1038/nrd4389. - DOI - PMC - PubMed
    1. Canon J, et al. The clinical KRAS(G12C) inhibitor AMG 510 drives anti-tumour immunity. Nature. 2019;575:217–223. doi: 10.1038/s41586-019-1694-1. - DOI - PubMed

Publication types

MeSH terms

Substances