Meta-Analysis
. 2021 Jul 16;12(1):4350.
doi: 10.1038/s41467-021-24491-0.

Discovery and prioritization of variants and genes for kidney function in >1.2 million individuals

Affiliations
Meta-Analysis

Discovery and prioritization of variants and genes for kidney function in >1.2 million individuals

Kira J Stanzick et al. Nat Commun. .

Abstract

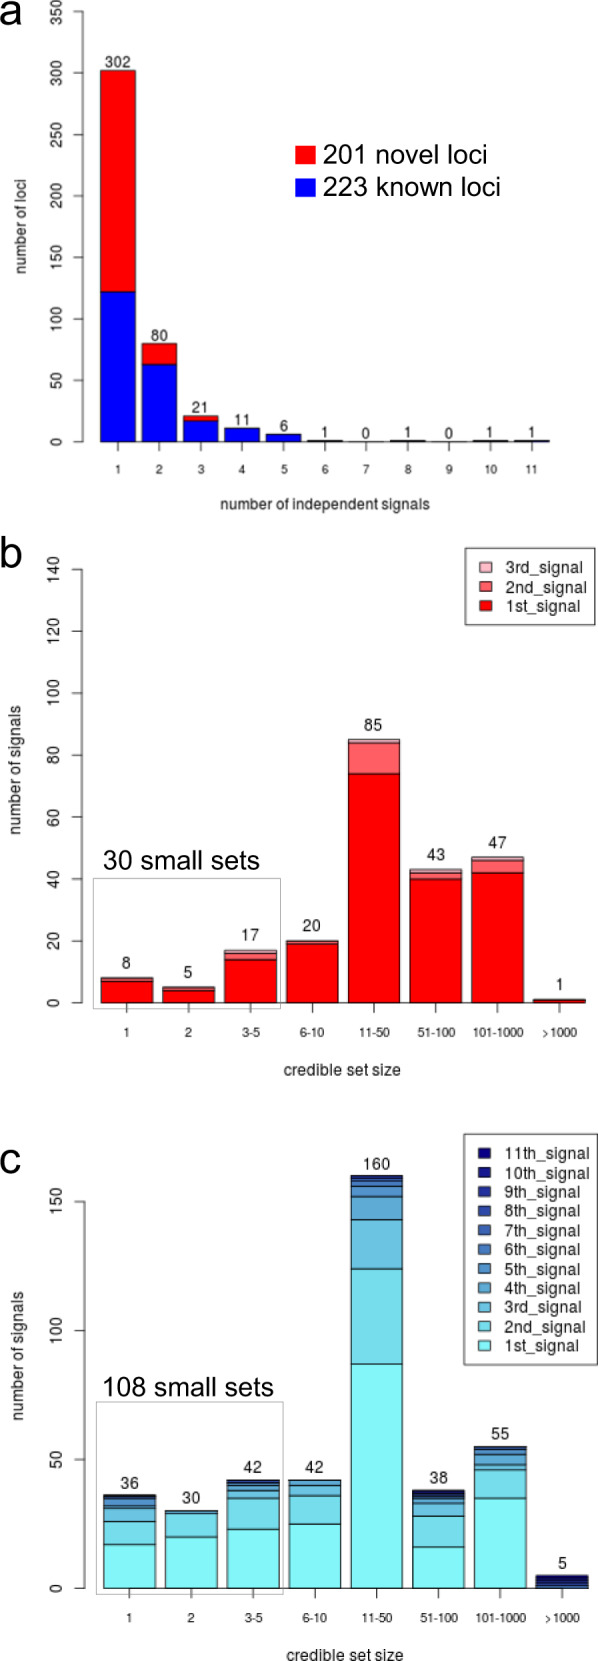
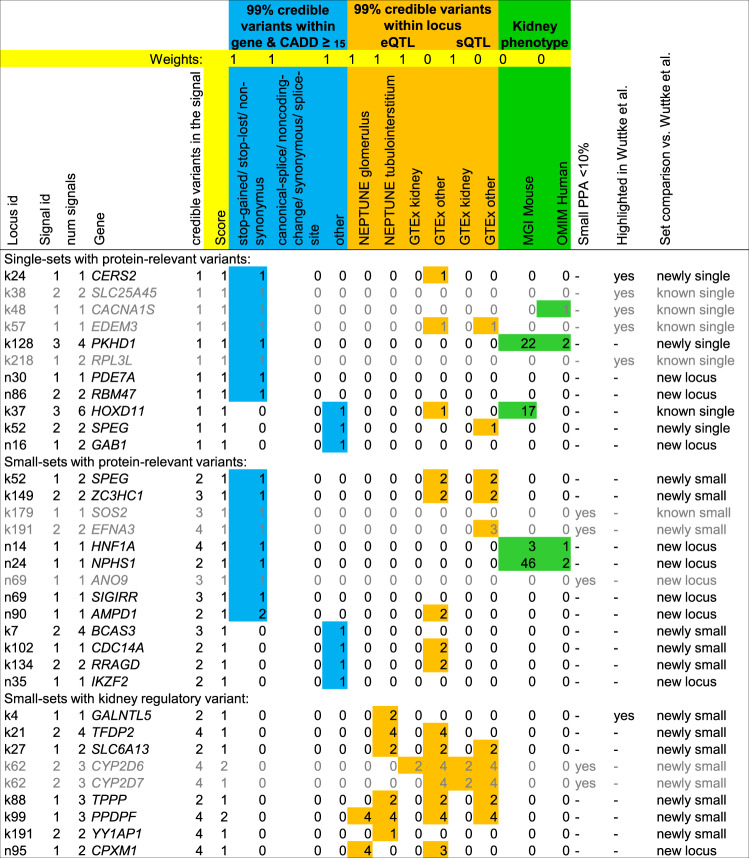
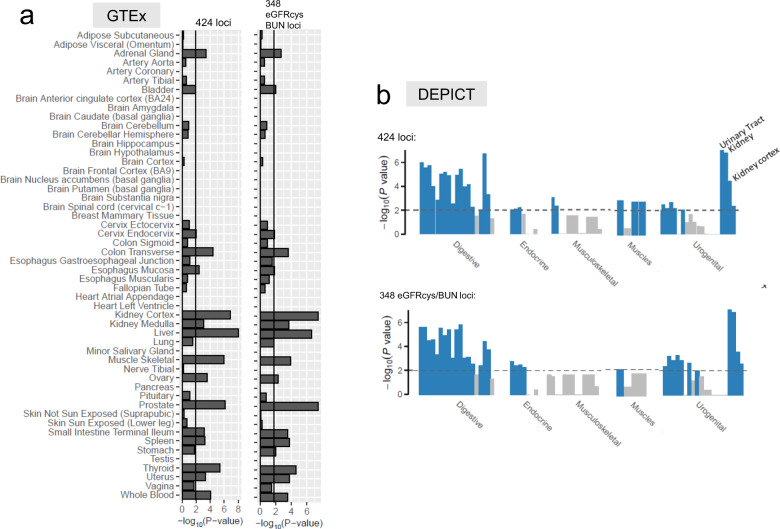
Genes underneath signals from genome-wide association studies (GWAS) for kidney function are promising targets for functional studies, but prioritizing variants and genes is challenging. By GWAS meta-analysis for creatinine-based estimated glomerular filtration rate (eGFR) from the Chronic Kidney Disease Genetics Consortium and UK Biobank (n = 1,201,909), we expand the number of eGFRcrea loci (424 loci, 201 novel; 9.8% eGFRcrea variance explained by 634 independent signal variants). Our increased sample size in fine-mapping (n = 1,004,040, European) more than doubles the number of signals with resolved fine-mapping (99% credible sets down to 1 variant for 44 signals, ≤5 variants for 138 signals). Cystatin-based eGFR and/or blood urea nitrogen association support 348 loci (n = 460,826 and 852,678, respectively). Our customizable tool for Gene PrioritiSation reveals 23 compelling genes including mechanistic insights and enables navigation through genes and variants likely relevant for kidney function in human to help select targets for experimental follow-up.


Conflict of interest statement

The authors declare no competing interests.

Figures

Fig. 1
Fig. 1. Primary meta-analysis for eGFRcrea identified 424 loci, including 201 novel loci.
Shown are results from our primary meta-analysis for eGFRcrea (n = 1,201,929). We identified 424 loci with genome-wide significance (P < 5 × 10−8), including 223 known (previous GWAS) and 201 novel (marked in blue and red, respectively). a Manhattan plot shows –log10 association P value for the genetic effect on eGFRcrea by chromosomal base position (GRCh37). The red dashed line marks genome-wide significance (5 × 10−8). P values are two-sided and were derived using a Wald test. b Scatterplot comparing eGFRcrea effect sizes versus allele frequencies for the 424 identified locus lead variants (orange lines at 5% and 95% allele frequency). Effect sizes and allele frequencies were aligned to the eGFRcrea-decreasing alleles.
Fig. 2
Fig. 2. Supporting alternative biomarker association for 348 loci.
Shown are results from our evaluation of alternative kidney function biomarker association for the 424 locus lead variants to establish loci with likely kidney function relevance. We classified each of the 424 variants as “validated” by BUN and/or eGFRcys based on a nominal significant association (P < 0.05) with consistent effect direction for BUN (n = 852,678, i.e. opposite effect to eGFRcrea) and/or eGFRcys (n = 460,826, i.e. same effect direction as eGFRcrea). We validated 348 of the 424 loci and thus more than doubled the number of loci with additional biomarker evidence compared to previous work (147 loci previously based on BUN-only). a Pie chart showing the classification of the 424 lead variants as “validated” by eGFRcys and/or BUN effects. b Scatterplot comparing effect sizes for eGFRcrea and eGFRcys with 95% confidence intervals (green: eGFRcys and BUN validated, brown: only eGFRcys-validated, magenta: only BUN validated, grey: not validated). c Scatterplot comparing effect sizes for eGFRcrea and BUN (colouring analogous to b). The correlation coefficients between effect sizes shown are Spearman correlation coefficients and were based on the 348 validated loci lead variants. Genetic effect sizes are presented with error bars +/− 1.96* standard error of the genetic effect size estimate.
Fig. 3
Fig. 3. Fine-mapping of 634 independent signals by credible set variants including 138 with small credible set size.
For the 424 identified eGFRcrea loci, we derived 634 independent signals by approximate conditional analyses with GCTA and, for each signal, 99% credible sets of variants using the method by Wakefield based on the European-only meta-analysis results (n = 1,004,040). a Distribution of the number of signals per 424 loci. b Distribution of credible set sizes for the 226 signals at novel loci. c Distribution of credible set sizes for the 408 signals at known loci. Colour in panels b and c denotes the order in which the signal appeared in the stepwise conditional analysis. Of the 634 signals, 138 were successfully fine-mapped down to a small credible set (i.e. <=5 variants) including 44 that contained exactly one variant.
Fig. 4
Fig. 4. Results from Gene PrioritiSation (GPS) yields 32 genes.
By querying our GPS (Supplementary Data 14), we identified 32 genes that are mapping to eGFRcys/BUN-validated loci and to a small credible set (≤5 variants) that contains a protein-relevant variant within the gene (CADD ≥15) or a kidney-tissue regulatory variant (eQTL in NEPTUNE glomerulus or tubule-interstitial tissue; eQTL or sQTL in GTEx kidney tissue). Shown is the locus information (locus id, signal id, number of signals in the locus and the number of credible variants in the signal), variant information for credible variants within the gene (functional annotation, blue), for regulatory credible variants (regulatory annotation, orange) and gene information for kidney-related phenotypes (in mouse or human, green). Genes are grey if the PPA of the relevant variant is <10% or if the gene was previously highlighted by Wuttke et al. without additional evidence. An alternative result limited to variants that are available in the mostly European CKDGen consortium meta-analysis is shown in Supplementary Fig. 8.
Fig. 5
Fig. 5. Specific expression in GTEx and DEPICT tissues.
Shown are tissue-specific enrichment P values from gene expression enrichment analyses. a Enrichment analyses in GTEx tissues and cell types (FDR <5%). b Tissue- and cell-type-specific enrichment analysis by DEPICT (FDR <5%). Both analyses were conducted twice: based on all 5906 genes located at the 424 identified eGFRcrea loci and based on the subset of 4941 genes located at the 348 eGFRcys/BUN-validated loci. The enrichment in muscle tissue is attenuated after focusing on eGFRcys/BUN-validated loci in both approaches. Significance lines approximately refer to a FDR of 5%. P values are derived from a one-sided resampling based enrichment test (“Methods”).
Fig. 6
Fig. 6. Specific expression in single-cell RNA-seq datasets of the human mature kidney.
Shown are results from gene expression enrichment analyses (based on 4941 genes located at eGFRcys/BUN-validated loci) and heatmaps of expression z scores for the 23 genes highlighted by Table 2. a Enrichment in 17 cell types by Wu et al. b Enrichment in 27 cell types by Stewart et al. P values are derived from a one-sided resampling based enrichment test (“Methods”). c Expression heatmap for 21 of the 23 genes in cell types by Wu et al. (AMPD1 and CPXM1 not specifically expressed in any cell type by Wu et al., Supplementary Data 20). d Expression heatmap for 22 of the 23 genes in cell types by Stewart et al. (GALNTL5 not specifically expressed in any cell type by Stewart et al., Supplementary Data 20). In A and B, shown are the enrichment P values and significance lines approximately refer to a FDR of 5%. AVRE ascending vasa recta endothelium, B B cell, CD4-T CD4 T cell, CNT connecting tubule, DVRE descending vasa recta endothelium, DCT distal convoluted tubule, EC endothelial cells, EPC epithelial progenitor cell, Fib fibroblast, GE glomerular endothelium, IC intercalated cells, LOH Loop of Henle (ATL ascending thin limbs, DTL descending thin limbs), Mast mast cell, MNP mononuclear phagocyte, MFib myofibroblast, NK natural killer cell, Neutro neutrophil, PCE peritubular capillary endothelium, Podo podocytes, PC principal cells, PT proximal tubule, TE transitional epithelium of ureter.

References

    1. Naghavi M, et al. Global, regional, and national age-sex specifc mortality for 264 causes of death, 1980-2016: a systematic analysis for the Global Burden of Disease Study 2016. Lancet. 2017 doi: 10.1016/S0140-6736(17)32152-9. - DOI - PMC - PubMed
    1. James MT, Hemmelgarn BR, Tonelli M. Early recognition and prevention of chronic kidney disease. Lancet. 2010 doi: 10.1016/S0140-6736(09)62004-3. - DOI - PubMed
    1. Levin A, et al. Global kidney health 2017 and beyond: a roadmap for closing gaps in care, research, and policy. Lancet. 2017 doi: 10.1016/S0140-6736(17)30788-2. - DOI - PubMed
    1. Levey AS, et al. Nomenclature for kidney function and disease: executive summary and glossary from a kidney disease: improving global outcomes (KDIGO) consensus conference. Am. J. Kidney Dis. 2020 doi: 10.1053/j.ajkd.2020.05.005. - DOI - PMC - PubMed
    1. Arpegård J, et al. Comparison of heritability of cystatin C- and creatinine-based estimates of kidney function and their relation to heritability of cardiovascular disease. J. Am. Heart Assoc. 2015 doi: 10.1161/JAHA.114.001467. - DOI - PMC - PubMed

Publication types