Lipidomics reveals association of circulating lipids with body mass index and outcomes in IgA nephropathy patients
- PMID: 34272854
- PMCID: PMC8697343
- DOI: 10.1093/jmcb/mjab040
Lipidomics reveals association of circulating lipids with body mass index and outcomes in IgA nephropathy patients
Abstract
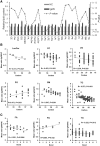
IgA nephropathy (IgAN) is a leading cause of chronic kidney disease (CKD), which are commonly accompanied by dyslipidemia. Obesity is also associated with dyslipidemia and risk of CKD, but the relation of the dyslipidemia patterns with obesity and disease progression in IgAN patients remains unknown. Traditional Chinese medicine (TCM) and the combined treatment with corticosteroids and TCM have been shown to be of benefit for IgAN patients, but predictive markers for guiding these treatments are lacking. Here, we quantified 545 lipid species in the plasma from 196 participants, including 140 IgAN patients and 56 healthy volunteers, and revealed an altered plasma lipidome in IgAN patients as compared to healthy participants. Association analysis showed that a sub-group of glycerides, particularly triacylglycerols (TGs) containing docosahexaenoic acid, were positively associated with high body mass index (BMI) in under- or normal weight IgAN patients, while several free fatty acids and sphingomyelins were positively associated with high BMI in overweight or obese IgAN patients. Further, our study suggested that elevated levels of eight lipids, mainly TG species containing linolenic acid, were independent risk factors for IgAN progression and also reported the prospective association of circulating lipids with treatment outcomes in IgAN. Taken together, our findings may not only help to achieve precision medicine but also provide a knowledge base for dietary intervention in the treatment of IgAN.
Keywords: IgA nephropathy; body mass index; circulating lipids; dyslipidemia; lipidomics; traditional Chinese medicine.
© The Author(s) 2021. Published by Oxford University Press on behalf of Journal of Molecular Cell Biology, IBCB, SIBS, CAS.
Figures


Similar articles
-
Association of high body mass index with development of interstitial fibrosis in patients with IgA nephropathy.BMC Nephrol. 2018 Dec 29;19(1):381. doi: 10.1186/s12882-018-1164-2. BMC Nephrol. 2018. PMID: 30594167 Free PMC article.
-
Treatment effects of Chinese medicine (Yi-Qi-Qing-Jie herbal compound) combined with immunosuppression therapies in IgA nephropathy patients with high-risk of end-stage renal disease (TCM-WINE): study protocol for a randomized controlled trial.Trials. 2020 Jan 6;21(1):31. doi: 10.1186/s13063-019-3989-9. Trials. 2020. PMID: 31907076 Free PMC article.
-
Association of obesity with the development of end stage renal disease in IgA nephropathy patients.Front Endocrinol (Lausanne). 2023 Mar 20;14:1094534. doi: 10.3389/fendo.2023.1094534. eCollection 2023. Front Endocrinol (Lausanne). 2023. PMID: 37020590 Free PMC article.
-
Effects and mechanisms of Chinese herbal medicine on IgA nephropathy.Phytomedicine. 2023 Aug;117:154913. doi: 10.1016/j.phymed.2023.154913. Epub 2023 Jun 5. Phytomedicine. 2023. PMID: 37307737 Review.
-
Role of macromolecular IgA in IgA nephropathy.Kidney Int. 2005 Mar;67(3):813-21. doi: 10.1111/j.1523-1755.2005.00146.x. Kidney Int. 2005. PMID: 15698421 Review.
Cited by
-
Ethnic Disparities in Lipid Metabolism and Clinical Outcomes between Dutch South Asians and Dutch White Caucasians with Type 2 Diabetes Mellitus.Metabolites. 2024 Jan 3;14(1):33. doi: 10.3390/metabo14010033. Metabolites. 2024. PMID: 38248836 Free PMC article.
-
Integrative bioinformatics analysis unveils hub transcription factors and their interacting drugs in immunoglobulin A nephropathy: Implications for pathogenesis and treatments.J Genet Eng Biotechnol. 2025 Sep;23(3):100513. doi: 10.1016/j.jgeb.2025.100513. Epub 2025 May 29. J Genet Eng Biotechnol. 2025. PMID: 40854632 Free PMC article.
-
Thickened Perirenal Fat Predicts Poor Renal Outcome in Patients with Immunoglobulin A Nephropathy: A Population-Based Retrospective Cohort Study.Kidney Dis (Basel). 2023 Oct 19;10(1):51-60. doi: 10.1159/000533507. eCollection 2024 Feb. Kidney Dis (Basel). 2023. PMID: 38322631 Free PMC article.
-
Evaluating Progression Risk in Patients With Immunoglobulin A Nephropathy.Kidney Int Rep. 2023 Sep 22;8(12):2515-2528. doi: 10.1016/j.ekir.2023.09.020. eCollection 2023 Dec. Kidney Int Rep. 2023. PMID: 38106572 Free PMC article. Review.
-
Cord blood lipid correlation network profiles are associated with subsequent attention-deficit/hyperactivity disorder and autism spectrum disorder symptoms at 2 years: a prospective birth cohort study.EBioMedicine. 2024 Feb;100:104949. doi: 10.1016/j.ebiom.2023.104949. Epub 2024 Jan 9. EBioMedicine. 2024. PMID: 38199043 Free PMC article.
References
-
- Chen W.J., Deng Y.Y., Ni Z.H., et al. (2013a). Treatment of patients with severe IgA nephropathy (Pishenyangxu pattern) with Jianpibushentongluo granules plus prednisone: a randomized, controlled, and double-blind multicentre trial. Chin. J. Kidney Dis. Invest. 2, 35–40.
LinkOut - more resources
Full Text Sources
Miscellaneous

