. 2022 Mar;71(3):553-563.
doi: 10.1007/s00262-021-03015-1. Epub 2021 Jul 17.

Transcriptomic signatures of tumors undergoing T cell attack

Affiliations

Transcriptomic signatures of tumors undergoing T cell attack

Aishwarya Gokuldass et al. Cancer Immunol Immunother. 2022 Mar.

Abstract

Background: Studying tumor cell-T cell interactions in the tumor microenvironment (TME) can elucidate tumor immune escape mechanisms and help predict responses to cancer immunotherapy.

Methods: We selected 14 pairs of highly tumor-reactive tumor-infiltrating lymphocytes (TILs) and autologous short-term cultured cell lines, covering four distinct tumor types, and co-cultured TILs and tumors at sub-lethal ratios in vitro to mimic the interactions occurring in the TME. We extracted gene signatures associated with a tumor-directed T cell attack based on transcriptomic data of tumor cells.

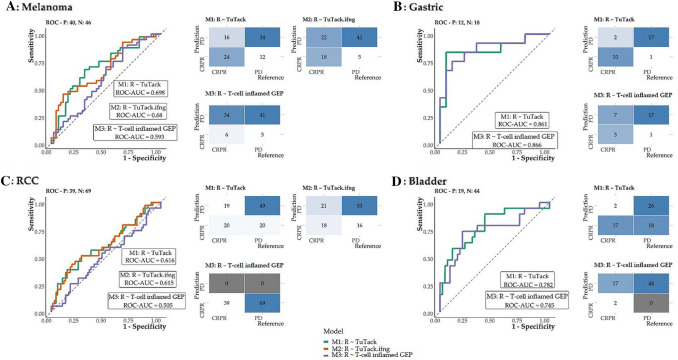
Results: An autologous T cell attack induced pronounced transcriptomic changes in the attacked tumor cells, partially independent of IFN-γ signaling. Transcriptomic changes were mostly independent of the tumor histological type and allowed identifying common gene expression changes, including a shared gene set of 55 transcripts influenced by T cell recognition (Tumors undergoing T cell attack, or TuTack, focused gene set). TuTack scores, calculated from tumor biopsies, predicted the clinical outcome after anti-PD-1/anti-PD-L1 therapy in multiple tumor histologies. Notably, the TuTack scores did not correlate to the tumor mutational burden, indicating that these two biomarkers measure distinct biological phenomena.

Conclusions: The TuTack scores measure the effects on tumor cells of an anti-tumor immune response and represent a comprehensive method to identify immunologically responsive tumors. Our findings suggest that TuTack may allow patient selection in immunotherapy clinical trials and warrant its application in multimodal biomarker strategies.

Keywords: Adaptive immune resistance; Anti-PD-1; Anti-PD-L1; Immunotherapy biomarkers; Patient selection; Transcriptomics.


Conflict of interest statement

MD has received honoraria for lectures from Roche and Novartis (past two years). IMS has received honoraria for consultancies and lectures from Novartis, Roche, Merck and Bristol-Myers Squibb; a restricted research grant from Novartis; and financial support for attending symposia from Bristol-Myers Squibb, Merck, Novartis, Pfizer and Roche. A patent (inventors AG, AS and MD) disclosing methods to predict response to immunotherapy has been submitted. The rights of the patent applications will be transferred to Capital Region of Denmark, according to the Danish Law of Public Inventions at Public Research Institutions. All other authors declare that they have no conflict of interest.

Figures

Fig. 1
Fig. 1
T cell attack induced broader transcriptomic changes in tumor cells compared to IFN-γ. Venn diagram showing the number of differentially expressed genes (log-fold change > 0.58 in each of the three samples) by co-culture with autologous tumor-infiltrating lymphocytes (TILs) or exposure to rhIFN-γ, after filtering for T cell contamination. T cell attack induced gene expression changes in tumor cells independent of IFN-γ signaling
Fig. 2
Fig. 2
Global transcriptomic changes in Tumors undergoing T cell attack (TuTack) A Heatmap of differentially expressed genes (DEGs, log-fold change (LFC) > 0.58 in 14/14 tumor cell lines, TuTack extended gene set) identified by comparing gene expression in tumor cells undergoing attack from either autologous or allogeneic tumor-infiltrating lymphocytes (TILs). A heterogeneous response across tumor cell lines is observed without any specific clustering by tissue or cohort type. Each row represents a gene and each column represents a sample. The color and intensity of the boxes illustrates the LFCs of each of the differentially expressed genes. For improved visualization, the colors represent z-values calculated by row. Lower top sidebar indicates tumor histology: melanoma (light orange), ovarian (blue), renal cancer (purple), sarcoma (red). Upper top sidebar indicates cohort of the sample: melanoma (orange), non-melanoma (green). Letters at the bottom of the heatmap indicate the origin of each individual sample: melanoma (M), sarcoma (S), ovarian cancer (O), renal cancer (R). B Heatmap showing the top 40 DEGs. LFCs were calculated by comparing gene expression of tumor cells co-cultured with autologous (at sub-lethal ratios) or allogenic TILs. C Two dimension (2D) principal component analysis (PCA) plot of the upper quantile normalized FPKM gene expression values of the tumor cells, projected onto the 2D plane. The PCA was constructed using the expression data from tumors co-cultured with autologous TILs. No clustering of DEG signatures by tumor histology was observed, and only DEGs (TuTack extended gene set) were used. The x-axis direction separates the data points the most (PC1). The y-axis direction, orthogonal to the first, separates the data the second most (PC2). Different colors indicate the different cohorts: melanoma (orange), non-melanoma (green)
Fig. 3
Fig. 3
Prediction of response to anti-PD-1/anti-PD-L1 monotherapy in clinical datasets The performance of the histology-specific TuTack scores, the TuTack minus non-IFN-γ-related genes (TuTack.ifng) and T cell-inflamed GEP to predict the response (CR or PR) or progression (PD) of patients treated with anti-PD-1/anti-PD-L1 monotherapy was evaluated in test datasets of melanoma (A), gastric- (B), kidney- (C) and bladder- (D) cancer. In the absence of a specific TuTack score for gastric cancer, the TuTack score developed for bladder cancer was used. In the TuTack bladder, all genes were IFN-γ related; therefore, TuTack.ifng is not presented for gastric- and bladder- cancer. A list of all genes included in the signature scores is provided in Supplementary Table S3. The figure shows the area under the ROC curves describing the specificity and sensitivity of the prediction model in the respective test dataset (left panels), and confusion matrix graphs showing the number of correctly or wrongly predicted responders and progressors (right panels), with predictions updated with optimal classification thresholds, based on Youden Index. Higher ROC-AUC indicates better prediction performance. Confusion matrix graphs show the number of correctly predicted response information in the bottom left (correctly predicted CR or PR) and upper right (correctly predicted PD) squares. Incorrectly identified patient responses are also shown in the confusion matrix graphs (false positives and false negatives). ROC curves: Tutack in green, TuTack.ifng in orange, T cell-inflamed GEP in purple; Confusion matrices: color-coding from white to blue indicates increasing numbers, gray indicates zero; RCC = kidney cancer
Fig. 4
Fig. 4
Survival in anti-PD-1/anti-PD-L1 monotherapy clinical datasets. Kaplan–Meier (KM) survival plots of test data split by median TuTack scores or T cell-inflamed GEP. Data from all available patients with melanoma, gastric-, kidney- and bladder cancer, where overall survival information was available (regardless of clinical response) and not previously used as training data, was employed. KM plots of TuTack scores are shown in the upper panels (A), while KM plots of T cell-inflamed GEP are shown in the lower panels (B). For TuTack a low score was expected to be associated with elevated tissue immune responsiveness. Therefore scores below the median were considered biomarker-positive. Biomarker-negative is shown in red, biomarker-positive are shown in blue. Dotted lines indicate median survival. LogRank test values are two-sided. RCC = kidney cancer

References

    1. Galon J, Bruni D. Approaches to treat immune hot, altered and cold tumours with combination immunotherapies. Nat Rev Drug Discov. 2019;18:197–218. doi: 10.1038/s41573-018-0007-y. - DOI - PubMed
    1. Ribas A, Wolchok JD (2018) Cancer immunotherapy using checkpoint blockade. Science 359:1350–1355. 10.1126/science.aar4060 - PMC - PubMed
    1. Dudley ME, Grossa, Somerville RPT C, et al. Randomized selection design trial evaluating CD8+-enriched versus unselected tumor-infiltrating lymphocytes for adoptive cell therapy for patients with melanoma. J Clin Oncol. 2013;31:2152–2159. doi: 10.1200/JCO.2012.46.6441. - DOI - PMC - PubMed
    1. Andersen R, Donia M, Ellebæk E, et al. Long-lasting complete responses in patients with metastatic melanoma after adoptive cell therapy with tumor-infiltrating lymphocytes and an attenuated IL-2 regimen. Clin Cancer Res. 2016 doi: 10.1158/1078-0432.CCR-15-1879. - DOI - PubMed
    1. Keenan TE, Burke KP, Van Allen EM. Genomic correlates of response to immune checkpoint blockade. Nat Med. 2019 doi: 10.1038/s41591-019-0382-x. - DOI - PMC - PubMed

MeSH terms

Substances