

Comment
doi: 10.1093/brain/awab276.
Looking beyond indirect lesion network mapping of prosopagnosia: direct measures required
Affiliations
- PMID: 34273156
- PMCID: PMC8536935
- DOI: 10.1093/brain/awab276
Item in Clipboard
Comment
Looking beyond indirect lesion network mapping of prosopagnosia: direct measures required
Brain.
.
No abstract available
Figures
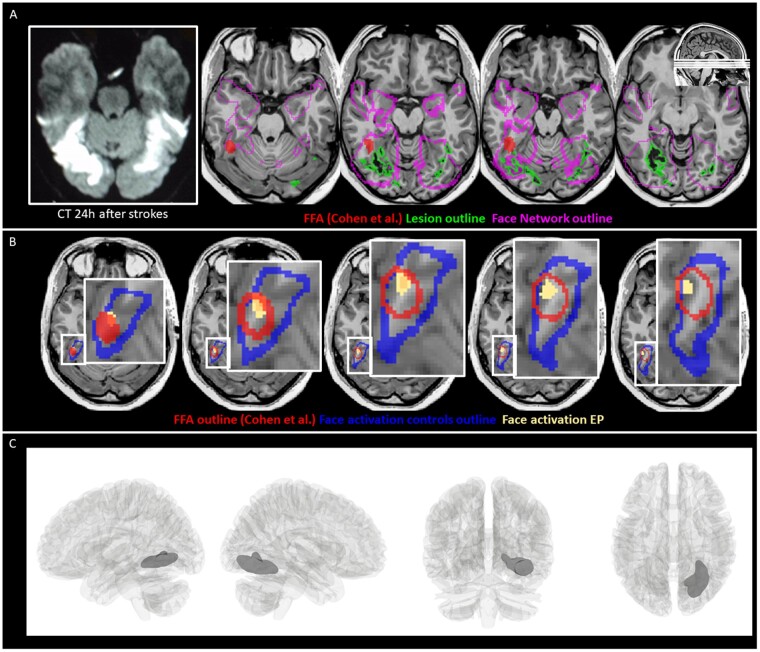
Lesion and face processing topography. (A) On the left, axial slices from a CT within 24 h following stroke; on the right, T1-weighted MRI slices taken 1 month after the strokes with the segmented lesion (outlined in green) superimposed as well as the face network (outlined in pink) and FFA defined by Cohen et al. (in red). (B) Face-specific (faces versus tools) activation in Subject EP (yellow) in the ventral occipito-temporal cortex (P < 0.005), relative to the FFA defined in the meta-analysis by Cohen et al. (outlined in red) and face-responsive activation (faces versus fixation) of the control subjects (outlined in blue), defined by means of an object-category localizer performed in six age-matched healthy control subjects (three male, mean age = 46.3, age range = 39–56 years) following a fixed-effect analysis (q < 0.01, FDR-corrected). (C) Lesion estimated by voxel-based morphometry (thresholded at FDR = 0.01) overlaid on a 3D glass brain.
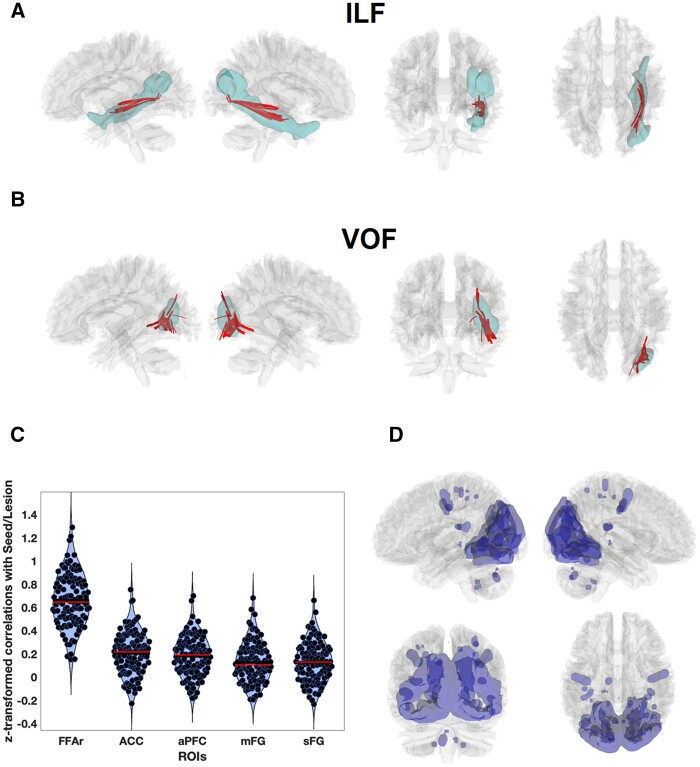
Lesion effect on connectivity. The trajectories of (A) inferior longitudinal fasciculus (ILF) and (B) inferior fronto-occipital fasciculus (IFOF) in the HCP841 atlas (blue) in the right hemisphere. The lesioned tracts in Subject EP identified by the individual connectometry analysis are plotted in red. (C) Violin plots of Fisher transformed correlations between the seed region of interest (lesion) and four regions of interest from Cohen et al.: the right FFA (FFAr), the left anterior prefrontal cortex (aPFC), the left middle frontal gyrus (mFG), the dorsal anterior cingulate cortex (ACC), and the left superior frontal gyrus (sFG), for 119 healthy subjects. Horizontal red lines represent the median, blue the mean. (D) Seed-to-voxel connectivity map for the lesion. The map was thresholded at q = 0.001, FDR-corrected, equivalent to t = 15.25. Significant negative correlations were not found. ROIs = regions of interest.
Comment in
-
Reply: Looking beyond indirect lesion network mapping of prosopagnosia: direct measures required.Brain. 2021 Oct 22;144(9):e76. doi: 10.1093/brain/awab277. Brain. 2021. PMID: 34273160 Free PMC article. No abstract available.
Comment on
-
Looking beyond the face area: lesion network mapping of prosopagnosia.Brain. 2019 Dec 1;142(12):3975-3990. doi: 10.1093/brain/awz332. Brain. 2019. PMID: 31740940 Free PMC article.
References
-
- Valdés-Sosa M, Bobes MA, Quiñones I, et al.Covert face recognition without the fusiform-temporal pathways. Neuroimage. 2011;57(3):1162–1176. - PubMed
-
- Van den Stock J, de Gelder B, De Winter FL, Van Laere K, Vandenbulcke M.. A strange face in the mirror. Face-selective self-misidentification in a patient with right lateralized occipito-temporal hypo-metabolism. Cortex. 2012;48(8):1088–1090. - PubMed
