

Estimating global and regional disruptions to routine childhood vaccine coverage during the COVID-19 pandemic in 2020: a modelling study
- PMID: 34273292
- PMCID: PMC8285122
- DOI: 10.1016/S0140-6736(21)01337-4
Estimating global and regional disruptions to routine childhood vaccine coverage during the COVID-19 pandemic in 2020: a modelling study
Abstract
Background: The COVID-19 pandemic and efforts to reduce SARS-CoV-2 transmission substantially affected health services worldwide. To better understand the impact of the pandemic on childhood routine immunisation, we estimated disruptions in vaccine coverage associated with the pandemic in 2020, globally and by Global Burden of Disease (GBD) super-region.
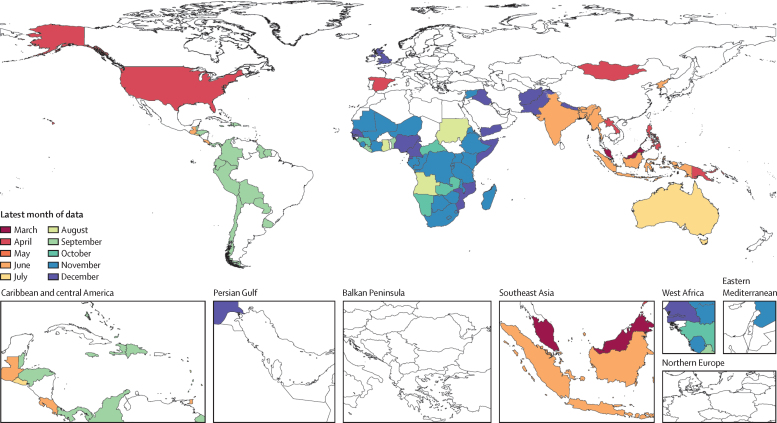
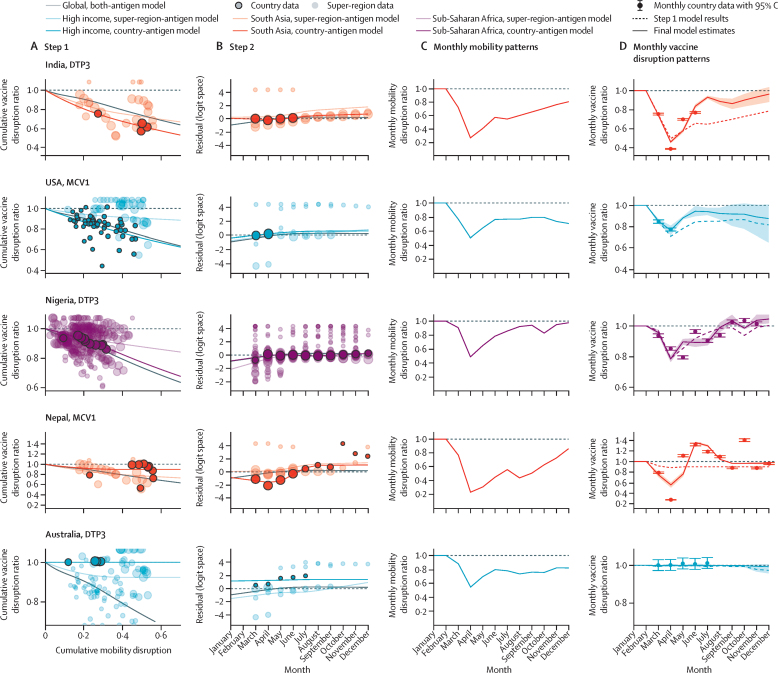
Methods: For this analysis we used a two-step hierarchical random spline modelling approach to estimate global and regional disruptions to routine immunisation using administrative data and reports from electronic immunisation systems, with mobility data as a model input. Paired with estimates of vaccine coverage expected in the absence of COVID-19, which were derived from vaccine coverage models from GBD 2020, Release 1 (GBD 2020 R1), we estimated the number of children who missed routinely delivered doses of the third-dose diphtheria-tetanus-pertussis (DTP3) vaccine and first-dose measles-containing vaccine (MCV1) in 2020.
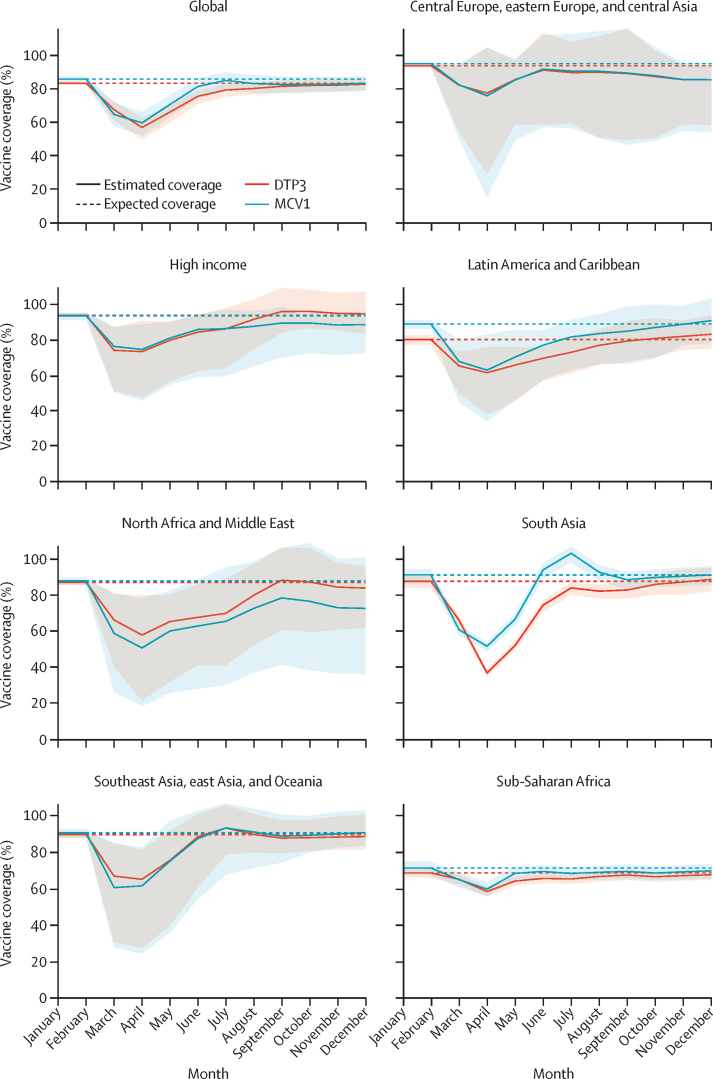
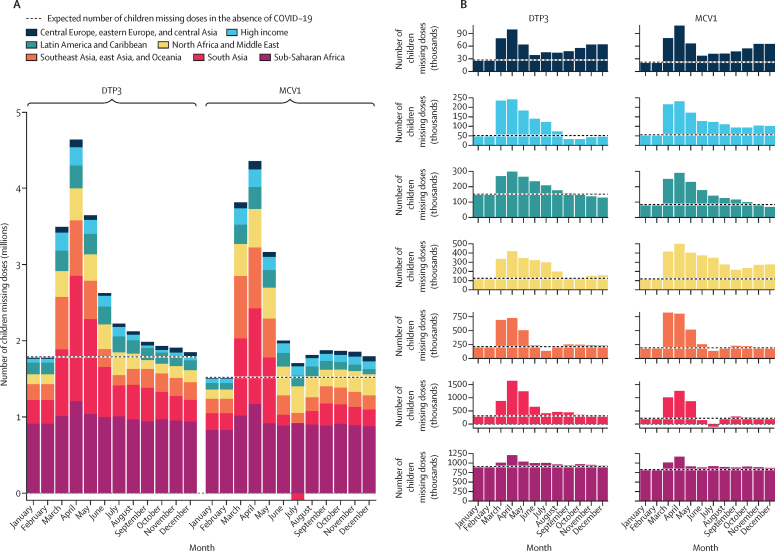
Findings: Globally, in 2020, estimated vaccine coverage was 76·7% (95% uncertainty interval 74·3-78·6) for DTP3 and 78·9% (74·8-81·9) for MCV1, representing relative reductions of 7·7% (6·0-10·1) for DTP3 and 7·9% (5·2-11·7) for MCV1, compared to expected doses delivered in the absence of the COVID-19 pandemic. From January to December, 2020, we estimated that 30·0 million (27·6-33·1) children missed doses of DTP3 and 27·2 million (23·4-32·5) children missed MCV1 doses. Compared to expected gaps in coverage for eligible children in 2020, these estimates represented an additional 8·5 million (6·5-11·6) children not routinely vaccinated with DTP3 and an additional 8·9 million (5·7-13·7) children not routinely vaccinated with MCV1 attributable to the COVID-19 pandemic. Globally, monthly disruptions were highest in April, 2020, across all GBD super-regions, with 4·6 million (4·0-5·4) children missing doses of DTP3 and 4·4 million (3·7-5·2) children missing doses of MCV1. Every GBD super-region saw reductions in vaccine coverage in March and April, with the most severe annual impacts in north Africa and the Middle East, south Asia, and Latin America and the Caribbean. We estimated the lowest annual reductions in vaccine delivery in sub-Saharan Africa, where disruptions remained minimal throughout the year. For some super-regions, including southeast Asia, east Asia, and Oceania for both DTP3 and MCV1, the high-income super-region for DTP3, and south Asia for MCV1, estimates suggest that monthly doses were delivered at or above expected levels during the second half of 2020.
Interpretation: Routine immunisation services faced stark challenges in 2020, with the COVID-19 pandemic causing the most widespread and largest global disruption in recent history. Although the latest coverage trajectories point towards recovery in some regions, a combination of lagging catch-up immunisation services, continued SARS-CoV-2 transmission, and persistent gaps in vaccine coverage before the pandemic still left millions of children under-vaccinated or unvaccinated against preventable diseases at the end of 2020, and these gaps are likely to extend throughout 2021. Strengthening routine immunisation data systems and efforts to target resources and outreach will be essential to minimise the risk of vaccine-preventable disease outbreaks, reach children who missed routine vaccine doses during the pandemic, and accelerate progress towards higher and more equitable vaccination coverage over the next decade.
Funding: Bill & Melinda Gates Foundation.
© 2021 The Author(s). Published by Elsevier Ltd. This is an Open Access article published under the CC BY 3.0 IGO license which permits unrestricted use, distribution, and reproduction in any medium, provided the original work is properly cited. In any use of this article, there should be no suggestion that WHO endorses any specific organisation, products or services. The use of the WHO logo is not permitted. This notice should be preserved along with the article's original URL.
Conflict of interest statement
Declaration of interests MPV-G and RM-P are staff members of the Pan American Health Organization. The authors alone are responsible for the views expressed in this Article, and they do not necessarily represent the decisions or policies of the Pan American Health Organization. NF reports receiving funding for work unrelated to this Article from Gates Ventures since June, 2020. All other authors declare no competing interests.
Figures
Comment in
-
Prioritising immunisation across the life course.Lancet. 2021 Dec 11;398(10317):2145. doi: 10.1016/S0140-6736(21)02331-X. Lancet. 2021. PMID: 34895526 Free PMC article. No abstract available.
References
-
- WHO Weekly epidemiological update. Dec 29, 2020. https://www.who.int/publications/m/item/weekly-epidemiological-update---...
-
- UNICEF Tracking the situation of children during COVID-19. May, 2021. https://data.unicef.org/resources/rapid-situation-tracking-covid-19-soci...
-
- WHO Special feature: immunization and COVID-19. Second pulse poll to help understand disruptions to vaccination and how to respond. 2020. https://www.who.int/immunization/GIN_June_2020.pdf
-
- Baleta A. Dramatic drop in SA's immunisation rates. Spotlight. June 24, 2020. https://www.spotlightnsp.co.za/2020/06/24/dramatic-drop-in-sas-immunisat...
Publication types
MeSH terms
Substances
LinkOut - more resources
Full Text Sources
Medical
Miscellaneous
