

Study of SARS-CoV-2 transmission in urban environment by questionnaire and modeling for sustainable risk control
- PMID: 34274804
- PMCID: PMC8270745
- DOI: 10.1016/j.jhazmat.2021.126621
Study of SARS-CoV-2 transmission in urban environment by questionnaire and modeling for sustainable risk control
Abstract
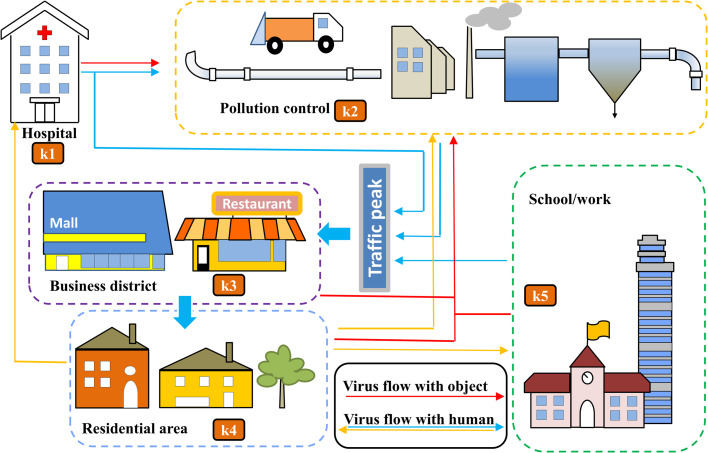
Caused by SARS-CoV-2, COVID-19 has become a severe threaten to society and human health, its epidemic control emerges as long-term issue. A sustainable epidemic and environmental transmission risk control (SEERC) in urban area is urgently needed. This work aims to conduct a new investigation on the transmission risk of SARS-COV-2 as virus/hazardous material through various environmental medias, routes and regions in the entirely urban area for guiding the SEERC. Specifically, 5 routes in 28 regions (totally 140 scenarios) are considered. For a new perspective, the risk evaluation is conducted by the quantification of frontline medicals staffs' valuable experience in this work. 207 specialists responsible for the treatment of over 9000 infected patients are involved. The result showed that degree of risk was in the order of breath>contact-to-object>contact-to-human>intake>unknown. The modeling suggested source control as the prior measure for epidemic control. The combination of source control & mask wearing showed high efficiency in SEERC. The homeworking policy needed to cooperate with activity limitation to perform its efficiency. Subsequently, a new plan for SEERC was discussed. This work delivered significant information to researchers and decision makers for the further development of sustainable control for SARS-COV-2 spreading and COVID-19 epidemic.
Keywords: Frontline medical staff; Lab-experiment independent; New modeling; SARS-CoV-2; Sustainability.
Copyright © 2021 The Authors. Published by Elsevier B.V. All rights reserved.
Conflict of interest statement
The authors declare that they have no known competing financial interests or personal relationships that could have appeared to influence the work reported in this paper.
Figures


Similar articles
-
Mask-wearing and control of SARS-CoV-2 transmission in the USA: a cross-sectional study.Lancet Digit Health. 2021 Mar;3(3):e148-e157. doi: 10.1016/S2589-7500(20)30293-4. Epub 2021 Jan 19. Lancet Digit Health. 2021. PMID: 33483277 Free PMC article.
-
Effectiveness and cost-effectiveness of four different strategies for SARS-CoV-2 surveillance in the general population (CoV-Surv Study): a structured summary of a study protocol for a cluster-randomised, two-factorial controlled trial.Trials. 2021 Jan 8;22(1):39. doi: 10.1186/s13063-020-04982-z. Trials. 2021. PMID: 33419461 Free PMC article.
-
Mask wearing in pre-symptomatic patients prevents SARS-CoV-2 transmission: An epidemiological analysis.Travel Med Infect Dis. 2020 Jul-Aug;36:101803. doi: 10.1016/j.tmaid.2020.101803. Epub 2020 Jun 24. Travel Med Infect Dis. 2020. PMID: 32592903 Free PMC article.
-
Transmission routes of SARS-CoV-2 and protective measures in dental clinics during the COVID-19 pandemic.Am J Dent. 2020 Jun;33(3):129-134. Am J Dent. 2020. PMID: 32470237 Review.
-
Transmission and prevention of SARS-CoV-2.Biochem Soc Trans. 2020 Oct 30;48(5):2307-2316. doi: 10.1042/BST20200693. Biochem Soc Trans. 2020. PMID: 33084885 Review.
Cited by
-
Spatiotemporal analysis of COVID-19, air pollution, climate, and meteorological conditions in a metropolitan region of Iran.Environ Sci Pollut Res Int. 2022 Apr;29(17):24911-24924. doi: 10.1007/s11356-021-17535-x. Epub 2021 Nov 26. Environ Sci Pollut Res Int. 2022. PMID: 34826084 Free PMC article.
-
Ventilation reconstruction in bathrooms for restraining hazardous plume: Mitigate COVID-19 and beyond.J Hazard Mater. 2022 Oct 5;439:129697. doi: 10.1016/j.jhazmat.2022.129697. Epub 2022 Jul 29. J Hazard Mater. 2022. PMID: 36104926 Free PMC article.
References
-
- Allen W.E., Altae-Tran H., Briggs J., Jin X., McGee G., Shi A., Raghavan R., Kamariza M., Nova N., Pereta A., Danford C., Kamel A., Gothe P., Milam E., Aurambault J., Primke T., Li W., Inkenbrandt J., Huynh T., Chen E., Lee C., Croatto M., Bentley H., Lu W., Murray R., Travassos M., Coull B.A., Openshaw J., Greene C.S., Shalem O., King G., Probasco R., Cheng D.R., Silbermann B., Zhang F., Lin X. Population-scale longitudinal mapping of COVID-19 symptoms, behaviour and testing. Nat. Hum. Behav. 2020;4:972–982. doi: 10.1038/s41562-020-00944-2. - DOI - PMC - PubMed
-
- Coccia M. How (Un)sustainable environments are related to the diffusion of covid-19: the relation between coronavirus disease 2019, air pollution, wind resource and energy. Sustain. 2020;12:1–12. doi: 10.3390/su12229709. - DOI
Publication types
MeSH terms
LinkOut - more resources
Full Text Sources
Medical
Miscellaneous
